1. Weekly Review
July 3, 2010
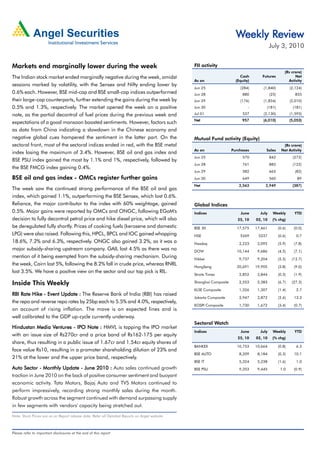
Markets end marginally lower during the week FII activity
(Rs crore)
The Indian stock market ended marginally negative during the week, amidst Cash Futures Net
As on (Equity) Activity
sessions marked by volatility, with the Sensex and Nifty ending lower by
Jun 25 (284) (1,840) (2,124)
0.6% each. However, BSE mid-cap and BSE small-cap indices outperformed Jun 28 880 (25) 855
their large-cap counterparts, further extending the gains during the week by Jun 29 (176) (1,834) (2,010)
0.5% and 1.3%, respectively. The market opened the week on a positive Jun 30 - (181) (181)
note, as the partial decontrol of fuel prices during the previous week and Jul 01 537 (2,130) (1,593)
Net 957 (6,010) (5,053)
expectations of a good monsoon boosted sentiments. However, factors such
as data from China indicating a slowdown in the Chinese economy and
negative global cues hampered the sentiment in the latter part. On the Mutual Fund activity (Equity)
sectoral front, most of the sectoral indices ended in red, with the BSE metal (Rs crore)
As on Purchases Sales Net Activity
index losing the maximum of 3.4%. However, BSE oil and gas index and
Jun 25 570 842 (272)
BSE PSU index gained the most by 1.1% and 1%, respectively, followed by
Jun 28 761 883 (122)
the BSE FMCG index gaining 0.4%.
Jun 29 582 665 (82)
BSE oil and gas index - OMCs register further gains Jun 30 649 560 89
Net 2,563 2,949 (387)
The week saw the continued strong performance of the BSE oil and gas
index, which gained 1.1%, outperforming the BSE Sensex, which lost 0.6%.
Reliance, the major contributor to the index with 60% weightage, gained Global Indices
0.5%. Major gains were reported by OMCs and ONGC, following EGoM's Indices June July Weekly YTD
decision to fully decontrol petrol price and hike diesel price, which will also 25, 10 02, 10 (% chg)
be deregulated fully shortly. Prices of cooking fuels (kerosene and domestic BSE 30 17,575 17,461 (0.6) (0.0)
LPG) were also raised. Following this, HPCL, BPCL and IOC gained whopping NSE 5269 5237 (0.6) 0.7
18.6%, 7.2% and 6.3%, respectively. ONGC also gained 3.2%, as it was a Nasdaq 2,223 2,092 (5.9) (7.8)
major subsidy-sharing upstream company. GAIL lost 4.5% as there was no DOW 10,144 9,686 (4.5) (7.1)
mention of it being exempted from the subsidy-sharing mechanism. During Nikkei 9,737 9,204 (5.5) (12.7)
the week, Cairn lost 5%, following the 8.2% fall in crude price, whereas RNRL HangSeng 20,691 19,905 (3.8) (9.0)
lost 3.5%. We have a positive view on the sector and our top pick is RIL.
Straits Times 2,852 2,844 (0.3) (1.9)
Inside This Weekly Shanghai Composite 2,553 2,383 (6.7) (27.3)
KLSE Composite 1,326 1,307 (1.4) 2.7
RBI Rate Hike - Event Update : The Reserve Bank of India (RBI) has raised
Jakarta Composite 2,947 2,872 (2.6) 13.3
the repo and reverse repo rates by 25bp each to 5.5% and 4.0%, respectively,
KOSPI Composite 1,730 1,672 (3.4) (0.7)
on account of rising inflation. The move is on expected lines and is
well calibrated to the GDP up-cycle currently underway.
Sectoral Watch
Hindustan Media Ventures - IPO Note : HMVL is tapping the IPO market
Ventures
Indices June July Weekly YTD
with an issue size of Rs270cr and a price band of Rs162-175 per equity
25, 10 02, 10 (% chg)
share, thus resulting in a public issue of 1.67cr and 1.54cr equity shares of
BANKEX 10,753 10,664 (0.8) 6.3
face value Rs10, resulting in a promoter shareholding dilution of 23% and
BSE AUTO 8,209 8,184 (0.3) 10.1
21% at the lower and the upper price band, respectively.
BSE IT 5,324 5,238 (1.6) 1.0
Auto Sector - Monthly Update - June 2010 : Auto sales continued growth BSE PSU 9,353 9,445 1.0 (0.9)
traction in June 2010 on the back of positive consumer sentiment and buoyant
economic activity. Tata Motors, Bajaj Auto and TVS Motors continued to
perform impressively, recording strong monthly sales during the month.
Robust growth across the segment continued with demand surpassing supply
in few segments with vendors' capacity being stretched out.
Note: Stock Prices are as on Report release date; Refer all Detailed Reports on Angel website.
Please refer to important disclosures at the end of this report
2. Fundamental Focus | July 3, 2010
Focus
RBI hikes Repo and Reverse Repo Rates
Event Update
Hikes repo rate by 25bp to 5.5% inflationary expectations, there is no need for any urgent,
Hikes reverse repo rate by 25bp to 4.0% disruptive tightening at present.
Extends ad-hoc liquidity measures till July 16 Interest rates to rise but unlikely to hurt growth
Inevitable move
By June 18, 2010, the yoy growth rate in credit increased to
Focus on anchoring inflationary expectations 19.2% yoy compared to 10% levels in October 2009. Banks
have incrementally lent Rs70,000cr YTD in FY2011 (compared
The Reserve Bank of India (RBI) has raised the repo and reverse
to a meagre Rs8,280cr during the corresponding period last
repo rate by 25bp each to 5.5% and 4.0%, respectively. The
year). Going forward, as credit demand is expected to sustain
move is on expected lines and well-calibrated to the GDP
at least above the 19% level, banks are expected to raise their
up-cycle currently underway.
lending and deposit rates.
Up to Feb 2010, food and textiles were contributing as much
Further monetary tightening may be required to anchor
as 70% of the overall 9.9% WPI inflation, on account of the
inflationary expectations, which will exert further upward
drought-driven increase in prices of food grains, sugar, cotton,
pressure on the domestic interest rates.
etc. By May 2010, their contribution to the 10.2% WPI, though
on a downward trend, was still high at 57%. Oil continued to In the previous cycle, the strength of credit demand suggested
contribute 12% to overall inflation, though this is likely to increase low elasticity to 300-400bp increase in interest rates amidst an
in the coming weeks due to the increase in petrol and diesel environment of robust economic activity. Presently, interest rates
prices. Contribution of other items (having 50% weightage in are well below peak levels, leaving ample scope for gradual
the WPI index) had increased to 31% in May 2010 due to the monetary tightening, without adversely affecting the growth
increase in the prices of coal, metals, electricity, wood products, outlook.
etc. indicating that inflation is becoming more broad-based. Banking sector outlook
Therefore, monetary tightening to anchor inflation expectations
is appropriate at this juncture. The expected increase in interest rates will not affect the sector
negatively, as it will be outweighed by acceleration in core
WPI (food v/s non-food) earnings growth on the back of improvement in credit growth
Inflation (yoy) Weightage % contribution
and fee income coupled with a sharp reduction in NPA losses.
in WPI Index to current WPI
However, on a relative basis, we continue to prefer banks with
Food & Textiles 13.6% 43% 57%
a high CASA ratio and lower-duration investment book, given
Oil 17.7% 7% 12%
the rising interest rate scenario.
Others 6.2% 50% 31%
Current WPI 10.2% Among the large banks, our top picks include HDFC Bank,
Source: Bloomberg, Angel Research; Note: As on May 2010 ICICI Bank, Axis Bank and SBI on account of their stronger
core competitiveness and likelihood of credit market share gains
Looking at the two-year CAGR in the prices of the various
because of strong capital adequacy as well as CASA market
components of the WPI, it is evident that it is mainly the food
share gains due to strong branch expansion. Among the
and textile prices that have been up by 10-12% even on a
mid-cap PSUs, we like Dena Bank because of its structurally
two-year CAGR basis. Other components whose prices have
strong CASA ratio relative to its peers. We have an Accumulate
gone up on a yoy basis recently, such as crude, coal and metals,
rating on Federal Bank and South Indian Bank as, in our view,
are either still below their two-year peak levels or up by a
they represent the most efficient and attractively valued old
marginal 2-6% on a CAGR basis, indicating that the base effect
private banks that were re-rated during the quarter on the back
is amplifying current headline numbers. This indicates that
of the ICICI Bank-BOR deal.
though there are grounds for monetary tightening to anchor
Research Analyst - Vaibhav Agrawal/Amit Rane
For Private Circulation Only | Angel Broking Ltd: BSE Sebi Regn No : INB 010996539 / CDSL Regn No: IN - DP - CDSL - 234 - 2004 / PMS Regn Code: PM/INP00000154 6 Angel Securities Ltd:BSE: INB010994639/INF010994639 NSE: INB230994635/INF230994635 Membership numbers: BSE 028/NSE:09946 2
3. Fundamental Focus | July 3, 2010
Focus
Hindustan Media Ventures - Subscribe
IPO Note - Venturing Out
Exhibit 1: Objects of the Issue relatively short time frame. The company is a part of the HT
Particulars Amount (Rs cr) Media group, and derives significant leverage from the brand
Setting up new publishing units 66.0 identity of Hindustan Times (2nd largest English daily), and Mint
Upgradation of existing plant and machinery 55.0 (2nd largest business daily), in terms of both advertisement and
Repayment of loans 135.0 sharing of content.
Genreal corporate purpose * Outlook and Valuation
Total 270.0
For the full year FY2010 (including the current 4 months
Source: Company, RHP Angel Research
,
financials and 8 months of financials of acquired business),
Issue Details HMVL reported a top-line of Rs439cr and an earnings of
Hindustan Media Ventures (HMVL) is tapping the IPO market Rs45.2cr. At the upper price band of Rs175, HMVL is trading at
with an issue size of Rs270cr and a price band of Rs162-175 16.2x FY2012E EPS of Rs10.8 which we believe is reasonable,
per equity share, thus resulting in a public issue of 1.67cr and given - 1) its high earnings growth (31.8% CAGR during
1.54cr equity shares of face value Rs10, resulting in a promoter FY2010-12E), 2) rich parentage and group portfolio under HT
shareholding dilution of 23% and 21% at the lower and the Media, 3) strong position in the regional print markets and
upper price band, respectively. 4) proven execution skills.
Rationale for our Subscribe view We have valued HMVL on the basis of P/E multiple relative to
Regional print market poised for growth, Hindustan well placed its peers - Jagran Prakashan (JPL) and DB Corp. We have valued
to benefit: According to KPMG, the print landscape is dominated the stock at 18x FY2012E EPS (~10% discount to our target
by regional newspapers. Moreover, Hindi is the largest language multiple of 20x for Jagran and DB Corp) and arrived at a fair
in terms of penetration. With a cumulative readership base of value of Rs195, indicating a ~11% upside to the upper price
9.9mn (third largest daily newspaper in terms of readership) band. Hence, we recommend a Subscribe view on the issue.
and a cumulative growth in readership of 15.9% between July
2006 and December 2009 (Source: IRS, R2 2007 to Q1 2010), Exhibit 2: Key Financials
we believe Hindustan is well placed to benefit from growth in Y/E March (Rs cr) FY2009 FY2010 FY2011E FY2012E
the regional print market. Net Sales 370 439 506 596
No1 in Bihar/Jharkhand, fastest growing daily in UP: Hindustan
UP: % chg 31.4 18.5 15.3 17.8
has a firm presence in the key Hindi markets of Bihar and Profit
Net Profit (3.8) 45.2 61.8 78.5
Jharkhand with a readership of 4.5mn and 1.4mn, respectively.
% chg 0.0 0.0 36.7 27.0
It is also the fastest growing Hindi daily in UP (the largest Hindi
OPM (%) 3.8 18.5 19.9 21.5
market in India) since its launch in the state in 2007. Hindustan
was launched in UP with eight editions in Agra, Allahabad, EPS (Rs) (0.5) 6.2 8.5 10.8
Kanpur, Lucknow, Meerut, Varanasi, Bareilly and Dehradun and P/E (x) - 28.1 20.5 16.2
has since garnered a total Hindi daily readership share of 21% P/BV (x) - 6.7 5.2 4.2
(16% in 2007). RoE (%) - 42.4 15.2 16.2
Strong infrastructure and synergies with promoter HT Media: RoCE (%) - 27.2 20.6 21.9
Backed by a 70-year history as an eminent Hindi daily, EV/Sales (x) - 3.1 2.4 2.1
Hindustan has successfully ventured out of its traditional markets,
EV/EBITDA (x) - 17.0 12.0 9.6
expanding into new states and gaining market share in a
Source: Company, Angel Research, Note: Based on upper price band of Rs175
Research Analyst - Anand Shah/Chitrangda Kapur
For Private Circulation Only | Angel Broking Ltd: BSE Sebi Regn No : INB 010996539 / CDSL Regn No: IN - DP - CDSL - 234 - 2004 / PMS Regn Code: PM/INP00000154 6 Angel Securities Ltd:BSE: INB010994639/INF010994639 NSE: INB230994635/INF230994635 Membership numbers: BSE 028/NSE:09946 3
4. Fundamental Focus | July 3, 2010
Focus
Auto Sector Update - June 2010
Growth to taper off… Maruti reported 14.6% yoy increase in exports to 15,279
units (13,336 units).
Auto sales continued its growth traction in June 2010 on the
back of positive consumer sentiment and buoyant economic The company registered 17.9% yoy increase in the domestic
market, while exports sales increased by around 14.6% yoy.
activity. Tata Motors, Bajaj Auto and TVS Motors continued to
perform impressively, recording strong monthly sales during Exhibit 2: Maruti Suzuki
the month. Robust growth across the segment continued with Segment June YTD
demand surpassing supply in few segments with vendors' 2010 2009 %chg FY11
FY11 FY10 %chg
capacity being stretched out. This is despite the fact that most Total Sales 88,091 75,109 17.3 283,324 226,729 25.0
auto majors increased their prices, passing on the cost impact A1 M800 2,090 2,438 (14.3) 6,906 7,119 (3.0)
to consumers, owing to high commodity prices, changes in C Omni, Versa 9,914 6,890 43.9 33,521 22,233 50.8
emission norms and excise duty hike. Pickup in economic activity A2 Alto, Wagon R, Zen,Swift, A-Star, Ritz 51,418 46,156 11.4 170,513 146,733 16.2
A3 SX4, Dezire 8,081 6,099 32.5 28,958 19,947 45.2
kept auto demand strong, albeit it remained more normalised
Total P Cars
. 71,503 61,583 16.1 239,898 196,032 22.4
across segments, considering price hikes post the excise duty
MUV Gypsy, Vitara 1,309 190 588.9 2,989 1,383 116.1
hike, change in emission norms and spurt in raw material prices. Domestic 72,812 61,773 17.9 242,887 197,415 23.0
Tata Motors Exports 15,279 13,336 14.6 40,437 29,314 37.9
Source: Company, Angel Research
Tata Motors registered 49.2% yoy growth in total sales to
67,730 units (45,399 units) in June 2010. Mahindra & Mahindra
The CV segment recorded robust 37.4% yoy growth aided M&M reported lower monthly sales, up 7.1% yoy to 44,152
by the M&HCV segment registering substantial yoy growth units (41,243 units).
of 50.1%. The tractor segment declined by 9.1% yoy on account of
Indica sales were at 9,003 units, reporting a decline of 12% 13.5% yoy decline in domestic tractor sales.
yoy; Indigo recorded sales of 7,502 units, registering growth The automotive segment grew 19.8% yoy, led by growth of
of 113% yoy. 125.2% in the domestic three-wheeler segment coupled with
178.9% yoy growth in the auto-export segment.
The Sumo/Safari/Xenon XT range reported sales of 3,602
units, up 9% yoy. The UV (including Xylo, Bolero and pick-ups) segment
reported decline of 3.6% yoy, while the LCV segment
The PV segment reported decent growth of 68.1% yoy, with
reported growth of 9.5% yoy.
the Nano selling 7,704 units.
During the month, the company suffered sales losses on
Exhibit 1: Tata Motors the automotive and tractor fronts, owing to component
Segment June YTD supply constraints. Also, overall volumes were affected by
2010 2009 %chg FY11
FY11 FY10 %chg the shutdown at the company's facilities for 5-6 days for
Total Sales 67,730 45,399 49.2 181,711 123,113 47.6 planned maintenance.
M&HCV 16,400 10,927 50.1 45,298 28,965 56.4
LCV 22,023 17,037 29.3 61,639 47,358 30.2 Exhibit 3: Mahindra & Mahindra
Total CV 38,423 27,964 37.4 106,937 76,323 40.1
Segment June YTD
Utility Vehicles 3,639 3,342 8.9 9,795 8,117 20.7
Cars 25,668 14,093 82.1 64,979 38,673 68.0
2010 2009 %chg FY11
FY11 FY10 %chg
Total PV 29,307 17,435 68.1 74,774 46,790 59.8 Total Sales 44,152 41,243 7.1 132,093 106,254 24.3
Exports (Inc Above ) 5,128 2,155 138.0 12,243 5,220 134.5 Utility Vehicles 17,010 17,653 (3.6) 53,948 48,720 10.7
Source: Company, Angel Research LCV 1,111 1,015 9.5 2,978 2,494 19.4
Logan 563 501 12.4 1,316 1,478 (11.0)
Maruti Suzuki Three wheelers + GIO + Maximo 7,559 3,357 125.2 20,076 9,032 122.3
Exports 1,319 473 178.9 3,625 1,145 216.6
Maruti registered sales growth of 17.3% yoy to 88,091units Total Automotive Sales 27,562 22,999 19.8 81,943 62,869 30.3
(75,109 units). Domestic Tractor Sales 15,411 17,811 (13.5) 47,718 41,963 13.7
The A2 segment grew by 11.4% yoy; sales of the C segment Exports Tractor Sales 1,179 433 172.3 2,432 1,422 71.0
hiked by 43.9% yoy, boosted by the launch of its new offering Total Tractor Sales
Tractor 16,590 18,244 (9.1) 50,150 43,385 15.6
Eeco. Source: Company, Angel Research; Note: Tractor sales include figures of Swaraj
Division
For Private Circulation Only | Angel Broking Ltd: BSE Sebi Regn No : INB 010996539 / CDSL Regn No: IN - DP - CDSL - 234 - 2004 / PMS Regn Code: PM/INP00000154 6 Angel Securities Ltd:BSE: INB010994639/INF010994639 NSE: INB230994635/INF230994635 Membership numbers: BSE 028/NSE:09946 4
5. Fundamental Focus | July 3, 2010
Focus
Auto Sector Update - June 2010
Bajaj Auto TVS Motor
Bajaj Auto posted overall sales growth of 63.3% yoy to 315,422 The two-wheeler segment reported 35.7% yoy growth to
units (193,202 units). 156,685 units (115,488).
The company reported the highest-ever sales numbers in
Domestic sales grew by 32.7% yoy to 139,905 units
June 2010.
(105,401 units).
The motorcycle segment grew 68.4%, led by two of its major
The scooter segment recorded 41.6% yoy growth to 36,742
brands, Pulsar and Discover, which accounted for over 70%
of the sales. units (25,945 units).
The newly launched Discover-150 sold 20,000 units mainly The motorcycle segment grew by 44.3% yoy to 66,452 units
in Delhi, UP WB and AP
, . (46,048 units).
The three-wheeler segment grew by 31.9% yoy to 32,614 Exports reported strong growth of 66.4% to 16,780 units
units (24,731 units). (10,087 units).
As per management, production constraints at the facilities The newly launched Jive and Wega posted improved
affected overall sales. volume growth in June.
We expect the company to continue to post strong sales, led Three-wheeler sales continued to excel with the company,
by capacity additions for motorcycles and three-wheelers registering sales of 3,003 units (753 units) in June 2010.
likely to go on stream from July 2010.
Exhibit 6: TVS Motors
Exhibit 4: Bajaj Auto
Segment June YTD
Segment June YTD
2010 2009 %chg FY11
FY11 FY10 %chg
2010 2009 %chg FY11
FY11 FY10 %chg
Total Sales 159,688 116,241 37.4 463,834 349,311 32.8
Total Sales 315,422 193,202 63.3 928,336 547,662 69.5
Motorcycles 66,452 46,048 44.3 200,358 152,778 31.1
Motorcycles 282,808 167,945 68.4 828,391 482,727 71.6
Scooters 36,742 25,945 41.6 95,486 67,250 42.0
Scooters - 526 (100.0) 27 1,693 (98.4)
Mopeds 53,491 43,495 23.0 160,191 127,153 26.0
Total 2 Wheelers 282,808 168,471 67.9 828,418 484,420 71.0
Total 2 Wheelers 156,685 115,488 35.7 456,035 347,181 31.4
Three Wheelers 32,614 24,731 31.9 99,918 63,242 58.0
Export (Incl Above) 16,780 10,087 66.4 54,044 31,356 72.4
Export (Incl Above) 114,024 67,726 68.4 323,899 178,295 81.7
Three Wheelers 3,003 753 298.8 7,799 2,130 266.2
Source: Company, Angel Research
Source: Company, Angel Research
Hero Honda
Outlook
Hero Honda sold 426,454 units (365,734 units) during the
We remain positive on the Indian auto sector. We estimate overall
month, registering healthy growth of 16.6% yoy and yet
Auto Volumes to register a CAGR of around 11% yoy over
another month with sales exceeding four lakh units.
FY2010-12E, aided by the improved economic environment
Growth was aided by high sales in the motorcycle and
for the sector. Over the longer term, comparatively low
scooter segments (Pleasure reported sales of over 25,000
penetration levels, a healthy economic environment, and
units in June 2010).
favourable demographics, supported by higher per-capita
According to management, the recently launched Glamour income levels, are likely to help the Auto companies in sustaining
and Glamour FI models have been received well by their Top-line growth. However, increase in input cost and interest
customers and are expected to drive the volumes in the rates are anticipated headwinds for the volume and earnings
deluxe segment. growth of the sector. We expect rising input costs to restrict
Exhibit 5: Hero Honda profitability, despite positive view on demand. A higher-than-
expected increase in input and emission-related costs will impact
Segment June YTD
margins in FY2011E. Among the pack, we continue to maintain
2010 2009 %chg FY11
FY11 FY10 %chg
Tata
Overweight on Maruti Suzuki, M&M and Tata Motors.
Total Sales
Total 426,454 365,734 16.6 1,234,039 1,118,987 10.3
Source: Company, Angel Research
Research Analyst - Vaishali Jajoo/Yaresh Kothari
For Private Circulation Only | Angel Broking Ltd: BSE Sebi Regn No : INB 010996539 / CDSL Regn No: IN - DP - CDSL - 234 - 2004 / PMS Regn Code: PM/INP00000154 6 Angel Securities Ltd:BSE: INB010994639/INF010994639 NSE: INB230994635/INF230994635 Membership numbers: BSE 028/NSE:09946 5
6. Technical Picks | July 3, 2010
Markets likely to be subdued - More range-bound movement expected
Sensex (17461) / Nifty (5237)
In our previous Weekly report, we had mentioned that the indices 17080 / 5214 - 5167 - 5120. On the other hand, we are
are likely to trade in the range of 17000 / 5100 on the downside observing that the indices are showing resilience near 17355 /
and 17920 / 5366 on the upside. Further, we had also 5200 levels inspite of weak global cues. As long as the indices
mentioned that the intermediate trend being up there is a hold 17355 / 5200 levels there is a possibility that the indices
possibility that the indices may find support at Fibonacci could test the upper band of the range or even extend their
retracement levels of 17400 - 17240 - 17080 / 5214 - 5167 - gains to test 7th April 2010 highs of 18047 / 5400 levels.
5120. The week began on a pessimistic note and the indices
We reiterate our view that the uptrend on the Daily chart would
tested the 38.2% Fibonacci retracement support levels as
be under serious threat if 16970 / 5090 levels are breached
mentioned in the previous report.
on the downside.
The Sensex ended with a marginal loss of 0.65 %, whereas the
Nifty lost 0.61 % vis-à-vis the previous week. Exhibit 1: Sensex Daily chart
Pattern Formation
On the Daily chart, we reiterate our view that the move
which started from 16560 to 17920 / 4967 to 5367 levels has
Fibonacci support levels at 17400 - 17240 - 17080 / 5214 -
5167 - 5120. The intermediate trend being up there is a
possibility that the indices may find support at Fibonacci
retracement levels (Refer Exhibit 1).
Future Outlook
Source: Falcon
We maintain our view that the indices are likely to trade in the
range of 17000 / 5100 on the downside and 17920 / 5366
on the upside in the coming week. The intermediate trend
remains up and there is a possibility that the indices may find
support at Fibonacci retracement levels of 17400 - 17240 -
Dow Industrial Exhibit 2: Dow Industrial Weekly chart
H
The Dow Industrial is at crucial support levels of 9600. On the
weekly charts it has confirmed a lower top lower bottom
S
S
formation which is a trend reversal pattern. Further, the
breakdown also resembles a bearish "Head and Shoulder
pattern" which project a downfall of approximately 800 to 900
points. In such a scenario though our markets may track global
cues, they may fall lesser compared to the other markets
(Refer Exhibit 2).
Source: Falcon
For Private Circulation Only | Angel Broking Ltd: BSE Sebi Regn No : INB 010996539 / CDSL Regn No: IN - DP - CDSL - 234 - 2004 / PMS Regn Code: PM/INP00000154 6 Angel Securities Ltd:BSE: INB010994639/INF010994639 NSE: INB230994635/INF230994635 Membership numbers: BSE 028/NSE:09946 6
8. Derivatives Review | July 3, 2010
IV to increase from here on; buy options to trade either side
Nifty spot has closed at 5237 this week, against a close of 5269 last week. The Put-Call Ratio has increased from 1.29 to 1.30 levels and
the annualized Cost of Carry (CoC) is positive 3.55 The Open Interest in Nifty Futures has increased by 11.17
3.55%. 11.17%.
Put-Call Ratio Analysis Futures Annual Volatility Analysis
The Nifty PCR has increased from 1.29 to 1.30 levels. On the The Historical Volatility of the Nifty has decreased from 22.69%
option side, the 5300 to 5500 calls and 5000 to 5200 puts to 21.87%. IV of at the money options has increased from 18%
added significant open interest. The 5200 put continues to show to 20%. Some liquid counters where HV has increased
highest contracts in it and with the negative move in the market, significantly are MRPL, BALRAMCHIN, ULTRACEMCO,
we are not seeing considerable unwinding. It suggests that it is STERLINBIO and IFCI. Stocks where HV has decreased are
difficult for the market to go significantly below this level. VIJAYABANK, ABB, DENABANK, ADANIENT and UCOBANK.
Open Interest Analysis Cost-of-Carry Analysis
The total Open Interest of the market is Rs1,26,798cr, as against The July Future closed at a premium of 13.75 points as against
Rs1,05286cr last week, and the Stock Futures' open interest a premium of 14.65 points last week and Aug future closed at
increased from Rs31,158cr to Rs35,527cr. SAIL is trading a premium of 18.20 points. Some liquid counters where CoC
around its support level and over-the-week the stock added turned from negative to positive are VIJAYABANK, TATACHEM,
around 23% OI. We may see some short covering in the counter. PIRHEALTH, JPPOWER and DRREDDY. Stocks where CoC turned
Some liquid stocks where open interest increased significantly from positive to negative are ULTRACEMCO, IVRCLINFRA,
are GRASIM, GMDC, CHENNPETRO, GAIL and MRPL. Stocks RELCAPITAL, ABIRLANUVO and RNRL.
where open interest decreased significantly are KOTAKBANK,
UNIONBANK, HCLTECH.
Derivative Strategy
TA
Scrip : TATASTEEL CMP : Rs. 474.95/- Lot Size : 500 Expiry Date (F&O) :
29th July, 2010
View: Bullish Strategy: Put Hedge Expected Payoff
Buy/Sell Qty Scrip Strike Series Option Buy Rate Closing Price
Price Expected
Price Type (Rs.) rofit/Loss
Profit/Loss
Buy 500 TATASTEEL Fut July - 470.00 Rs. 472.50 (Rs. 14.00)
Buy 500 TATASTEEL 480 July Put 24.00 Rs. 480.00 (Rs. 14.00)
BEP: Rs. 494.00/-
BEP: Rs. 487.50 (Rs. 6.50)
Max. Risk: Rs.7000.00/- Max. Profit: Unlimited
Profit: Rs. 495.00 Rs. 1.00
If Stock closes at or below Rs480 on expiry. If TATASTEEL continues to trade above BEP.
Rs. 502.50 Rs. 8.50
Note: Profit can be booked before expiry, if stock moves in a favorable direction.
ote:
Rs. 510.00 Rs. 16.00
For Private Circulation Only | Angel Broking Ltd: BSE Sebi Regn No : INB 010996539 / CDSL Regn No: IN - DP - CDSL - 234 - 2004 / PMS Regn Code: PM/INP00000154 6 Angel Securities Ltd:BSE: INB010994639/INF010994639 NSE: INB230994635/INF230994635 Membership numbers: BSE 028/NSE:09946 8
9. Fund Focus
Mutual Fund Focus | July 3, 2010
Exchange Traded Funds and Gold ETFS
exchange-traded
An exchange-traded fund (ETF) is a type of fund whose investment Working of an Exchange Traded Funds
objective is to achieve the same return as a particular market
index. An ETF is similar to an index fund in the sense that it will
Primary Market ETF Issuer Secondary Markets
primarily invest in the securities of companies that are included in
a selected market index.
ETF Asset Classes Authorised
Market Making/ Seller
Participants / Financial
ETFs can be of the following underlying asset classes Arbitrage
Institutions
Equity: ETFs investing in Equity Indices e.g. Nifty BeEs Cash ETF
Bonds : ETFs that invest in Debt e.g. Liquid BeEs Buy/Sell
Commodities: ETFs that invest in Commodities e.g. Gold ETFs
Stock Exchange
Subscription /
Features of ETFs Redemption
Immediate exposure to an entire or specific market. Cash ETF
Correlation to the benchmark close to 1.
Very low total expense ratio: 0.45% on average.
No subscription/redemption fee. Fund Buyer
No maturity date.
Equally accessible both to institutional and retail investors. Current Scenario - Diversification with Gold
Broad range of asset classes. Hedge against inflation.
Advantages of ETFs Hedge against a declining dollar: Strong Negative Correlation.
Allows you to implement asset allocation or portfolio investment Safe haven in times of geopolitical and financial market
decision as Single Investment which is, instability.
• Easier to track. Commodity based on gold's supply and demand fundamentals.
• Small Investment amount.
Store of value.
Asset Classes are much simpler to track than individual stocks
Portfolio diversifier; gold can act as portfolio insurance.
since you do not have to worry about,
• Quality of management. Due to rise in demand of gold, gold prices have increased thus
causing a rally in stocks of gold mining companies.
• Accounting frauds.
• Off Balance sheet derivative losses. Due to lower inflation & deflation the input costs have come
down thereby providing operating cash flows.
• Individual Credit Quality.
High quality and well diversified portfolio. Share prices of gold mining companies appreciate at twice the
gold price.
Generates income from frozen account.
Since there is a negative correlation between the equity markets
Gold Exchange Traded Funds-ETFs and gold it can act as hedge against the down fall in equity
Open-ended MF schemes backed by units of physical gold. markets.
Follow a passive investment strategy.
Advantages Gold ETFs
Buys & holds gold on behalf of investors without actively
managing it. ETFs allow investment in gold in small denominations, which
makes it easier for the retail investor to participate.
Aims to give returns as close as possible, post-expenses, to that
given for gold as a commodity. Quick and convenient dealing through demat account.
Investor can buy & sell quickly at market price, making them No storage and security issue for investors.
highly liquid assets.
Taxation of Mutual Fund.
Intra-day trading is possible with an ETF, but not with
open-ended mutual funds. Can be traded on stock exchange like buying / selling a stock.
Disclaimer: Angel Broking Ltd is not responsible for any error or inaccuracy or any losses suffered on account of information contained in this report. Data is obtained from MFI Explorer. Mutual Fund
investments are subject to market risk. Please read the Scheme Information document carefully before investing.
For Private Circulation Only | Angel Broking Ltd: BSE Sebi Regn No : INB 010996539 / CDSL Regn No: IN - DP - CDSL - 234 - 2004 / PMS Regn Code: PM/INP00000154 6 Angel Securities Ltd:BSE: INB010994639/INF010994639 NSE: INB230994635/INF230994635 Membership numbers: BSE 028/NSE:09946 9
10. Fund Focus
Mutual Fund Focus | July 3, 2010
ICICI Prutential Gold Exchange Traded Fund - NFO Analysis
Fund Features NFO Date: - 30th June to 29th July 2010
Scheme Objective The Fund seeks to provide investment returns that, before expenses, closely track the performance of domestic prices of Gold
derived from the LBMA AM fixing prices. However, the performance of the scheme may differ from that of the underlying gold
due to tracking error.
Type of Scheme A Open- Ended Gold Exchange Traded Scheme
Bench Mark Index Price derived from LBMA AM fixing price
Units 1 Unit of IGETF = Unit to 1 gram of gold.
New Fund Offer Price Each unit of IGETF having a face value of Rs. 100/- will be issued at a premium equivalent to the difference between the
allotment price and the face value of Rs. 100/-. Each unit is approximately equal to 1 (one) gram of gold
Minimum Application The minimum application for issue of units shall be made for a minimum of Rs. 5000/-plus in multiples of
Amount Re 1 by way of demand draft and cheque during the NFO (New Fund Offer). On an ongoing unit will be
created in unit creation size.
Fund Manager Mr. Chaitanya Pande
Entry/ Exit load Entry load :NIL
Exit Load : NIL
Asset Allocation Pattern Instruments Risk Profile Range
Gold Bullion Medium to High 95 to 100 %
Debt and Money Market Instruments Low 5 to 10 %
*Investments in securitized debt shall be limited to the maximum exposure allowed to the debt instruments as per above asset allocation
Performance Analysis of Gold as an Asset Class Benefits of ICICI Prutential Gold ETFs
Gold Performance Liquidity - can be easily converted into cash thereby making
30%
26.13%
profit due to price rise.
24.61%
25% 22.44%
Cost effective - cost of buying ETFs is lower than buying, storing
20% and insuring physical gold.
16.40%
15% Convenience - investing in gold ETFs makes buying and selling
10%
of gold easier.
5%
Smaller unit size - you can invest in as low as one unit of IGETF
i.e. approximately equal to one gram of Gold.
0%
1 year 3 year 5 year 10 year Assured Purity - scheme will invest in gold with Purity (fineness)
Note: Data is from the period January 31, 1973 to April 30, 2010.
of 995 parts per 1,000 Purity of Gold (99.5%) or higher.
Returns (%) considered for analysis are on CAGR Basis.
Source: Angel Research Transparency - holding of portfolio will be disclosed monthly
and NAV will be published daily.
Funds managed by Fund Manager
Ideal for Investors
Schemes 1 2 3 Since
Month Month Month Inception Investors looking for diversification through Gold as an Asset
Class
ICICI Prudential Banking
& PSU Debt Fund 6.05 5.88 5.87 5.16 Investment Horizon: Long Term
ICICI Prudential Blended Risk Appetite: Medium to High
Plan - Option B 5.23 4.96 4.85 6.77
ICICI Prudential Medium
Term Plan - Prem 5.63 5.64 5.73 1.89
Note: Returns (%) are simple annualized as on 30th June 2010
Disclaimer - Angel Broking Ltd is not responsible for any error or inaccuracy or any losses suffered on account of information contained in this report. Data source is from MFI Explorer and HDFC Mutual Fund
NFO Product Note. Mutual Fund investments are subjected to market risk. Please read the Statement of Additional Information and Scheme Information document carefully before investing.
For Private Circulation Only | Angel Broking Ltd: BSE Sebi Regn No : INB 010996539 / CDSL Regn No: IN - DP - CDSL - 234 - 2004 / PMS Regn Code: PM/INP00000154 6 Angel Securities Ltd:BSE: INB010994639/INF010994639 NSE: INB230994635/INF230994635 Membership numbers: BSE 028/NSE:09946 10