1. Market Outlook
India Research
April 23, 2010
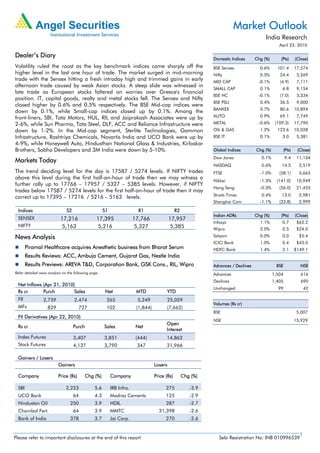
Dealer’s Diary Domestic Indices Chg (%) (Pts) (Close)
Volatility ruled the roost as the key benchmark indices came sharply off the BSE Sensex 0.6% 101.4 17,574
higher level in the last one hour of trade. The market surged in mid-morning Nifty 0.5% 24.4 5,269
trade with the Sensex hitting a fresh intraday high and trimmed gains in early MID CAP -0.1% (4.9) 7,111
afternoon trade caused by weak Asian stocks. A steep slide was witnessed in
SMALL CAP 0.1% 6.8 9,154
late trade as European stocks faltered on worries over Greece's financial
BSE HC -0.1% (7.0) 5,334
position. IT, capital goods, realty and metal stocks fell. The Sensex and Nifty
BSE PSU 0.4% 36.5 9,000
closed higher by 0.6% and 0.5% respectively. The BSE Mid-cap indices were
BANKEX 0.7% 80.6 10,894
down by 0.1%, while Small-cap indices closed up by 0.1%. Among the
front-liners, SBI, Tata Motors, HUL, RIL and Jaiprakash Associates were up by AUTO 0.9% 69.1 7,749
2-6%, while Sun Pharma, Tata Steel, DLF, ACC and Reliance Infrastructure were METAL -0.6% (109.3) 17,790
down by 1-2%. In the Mid-cap segment, Sterlite Technologies, Gammon OIL & GAS 1.2% 123.6 10,028
Infrastructure, Rashtriya Chemicals, Novartis India and UCO Bank were up by BSE IT 0.1% 3.0 5,381
4-9%, while Honeywell Auto, Hindusthan National Glass & Industries, Kirloskar
Brothers, Sobha Developers and 3M India were down by 5-10%. Global Indices Chg (%) (Pts) (Close)
Dow Jones 0.1% 9.4 11,134
Markets Today
NASDAQ 0.6% 14.5 2,519
The trend deciding level for the day is 17587 / 5274 levels. If NIFTY trades FTSE -1.0% (58.1) 5,665
above this level during the first half-an-hour of trade then we may witness a
Nikkei -1.3% (141.0) 10,949
further rally up to 17766 – 17957 / 5327 – 5385 levels. However, if NIFTY
Hang Seng -0.3% (56.0) 21,455
trades below 17587 / 5274 levels for the first half-an-hour of trade then it may
Straits Times 0.4% 13.0 2,981
correct up to 17395 – 17216 / 5216 – 5163 levels.
Shanghai Com -1.1% (33.8) 2,999
Indices S2 S1 R1 R2
Indian ADRs Chg (%) (Pts) (Close)
SENSEX 17,216 17,395 17,766 17,957
Infosys 1.1% 0.7 $62.2
NIFTY 5,163 5,216 5,327 5,385 Wipro 2.0% 0.5 $24.0
News Analysis Satyam 0.0% 0.0 $5.4
ICICI Bank 1.0% 0.4 $43.0
Piramal Healthcare acquires Anesthetic business from Bharat Serum HDFC Bank 1.4% 2.1 $149.1
Results Reviews: ACC, Ambuja Cement, Gujarat Gas, Nestle India
Results Previews: AREVA T&D, Corporation Bank, GSK Cons., RIL, Wipro Advances / Declines BSE NSE
Refer detailed news analysis on the following page. Advances 1,504 616
Declines 1,405 690
Net Inflows (Apr 21, 2010)
Unchanged 99 42
Rs cr Purch Sales Net MTD YTD
FII 2,739 2,474 265 5,249 25,059
Volumes (Rs cr)
MFs 829 727 102 (1,844) (7,662)
BSE 5,007
FII Derivatives (Apr 22, 2010)
NSE 15,929
Open
Rs cr Purch Sales Net
Interest
Index Futures 3,407 3,851 (444) 14,862
Stock Futures 4,137 3,790 347 31,966
Gainers / Losers
Gainers Losers
Company Price (Rs) Chg (%) Company Price (Rs) Chg (%)
SBI 2,223 5.6 IRB Infra. 275 -3.9
UCO Bank 64 4.3 Madras Cements 125 -2.9
Hindustan Oil 250 3.9 HDIL 287 -2.7
Chambal Fert. 64 3.9 MMTC 31,398 -2.6
Bank of India 378 3.7 Jai Corp. 270 -2.6
1
Please refer to important disclosures at the end of this report Sebi Registration No: INB 010996539
2. Market Outlook | India Research
Piramal Healthcare acquires Anesthetic business from Bharat Serum
Piramal Healthcare Limited (PHL) and Bharat Serums And Vaccines Limited (“BSV”) have
jointly announced that they have signed a definitive agreement under which PHL will
acquire BSV’s injectible anesthetic products business including - Propofol, Bupivacaine and
Atracurium Besylate. This anesthetic product range is developed and currently
manufactured by BSV at its own plant. As per the terms of the agreement, BSV will enter
into a long-term manufacture and supply agreement with PHL for anesthetic products
developed and manufactured by BSV. PHL will now expand the reach of this business to
108 countries from current 30 countries. The business had sales of Rs10.6cr in FY2010 out
of which around 80% is accounted for by Propofol. The acquisition gives PHL access to key
intellectual property developed by BSV for the manufacture of injectible anesthetics
products including process-based intellectual property and business contracts. The
acquisition provides PHL an immediate entry into the Propofol market, the largest selling
injectible anesthetic globally. As per IMS, the total market size of Propofol is approximately
US $825mn. The market excluding Europe/US/Japan is approximately US$250mn.
We believe the acquisition is strategic in nature as it strengthens the overall inhalation
anesthetics portfolio of PHL comprising of sevoflurane, enflurane, halothane and
isoflurane. However the financial impact would be minimal given the size of the
acquisition. The stock is under review.
Result Reviews
ACC (1QCY2010)
ACC posted a muted 2.3% growth in standalone Top-line during 1QCY2010 to Rs2,102cr,
which was ahead of our estimates. The growth in Top-line was primarily on account of a
4% yoy increase in realizations. The increase in company’s realization can be largely
attributed to the price hikes carried out post the Union Budget. The company’s dispatches
during the quarter were marginally down by 1.6% to 5.55mn tonnes primarily due to non
availability of rail wagons. On the operating front, the company clocked an OPM of 31.2%
(32.8%) down 155bp on account of increase in raw material costs. The company’s
Bottom-line remained flat on yoy basis at Rs405cr despite higher depreciation costs of
Rs94cr (Rs79cr). The increase in depreciation costs were offset by a 65.3% decline in
interest costs to Rs13cr. We maintain our Neutral view on the stock.
Ambuja Cements (1QCY2010)
Ambuja Cements (Ambuja) posted a 7.8% growth in its Top-line during 1QCY2010 to
Rs1,990cr, which was in-line with our estimates. The Top-line growth was aided by both
increase in dispatches and better realizations. While the company’s dispatches during the
quarter were up by 4.3% yoy, the realizations were higher by 3.3%. The company clocked
an OPM of 32.3% during the quarter, up 328bp on yoy basis. The expansion in the OPM
during the quarter was primarily on account of fall in the energy costs due to lower cost of
imported coal and reduced clinker purchases. The company’s power and fuel costs were
down by 10.9% during the quarter. On the Bottom-line front, the company clocked a
robust 38.3% growth in Net Profit to Rs462cr, primarily on account of a healthy operating
performance. We maintain our Neutral view on the stock.
April 23, 2010 2
3. Market Outlook | India Research
Gujarat Gas (1QCY2010)
Gujarat Gas results was better than our expectation on the Top-line and Bottom-line front.
Top-line increased by 33.8% yoy to Rs410cr (Rs306cr) as against our expectation of
Rs397cr, whereas Bottom-line increased by 70.1% yoy to Rs61cr (Rs36cr) as against our
expectation of Rs50cr. Top-line was higher on account of higher volumes, which stood at
3.23mmscmd. Higher gas volume was from domestic sources (Cairn and PMT), whereas
LNG volumes stood around 0.35mmscmd. Gross Spread was at its highest level at robust
Rs4.3/scm (against Rs3.3/scm in 1QCY2009 and Rs4.0/scm in 4QCY2009) on account of
lower gas cost due to average rupee appreciation of 1.6% during the quarter. This resulted
in OPM expanding by 672bp yoy to 25% (18.3%), resulting in EBITDA increasing by 83.1%
yoy to Rs103cr (Rs56cr). We maintain an Accumulate on Gujarat Gas, with a Target Price
of Rs306.
Nestle (1QCY2010)
Nestle reported its 1QCY2010 results. Nestle registered a modest Top-line growth of
16.9% yoy to Rs1,480cr (Rs1,266cr) aided by steady growth in its Net Domestic Sales (up
16.7% yoy to Rs1,391cr). Export Sales registered a positive growth of 20.4% yoy. Bottom-
line (on a reported basis) registered a muted growth of 2.3% yoy to Rs202cr (Rs197cr)
largely impacted due to significant spike up in input costs (Milk up 30% yoy, Sugar up 70%
yoy and Wheat up 25% yoy, highest in last 10 years). Hence, Gross Margins contracted by
263bp yoy. Moreover, high investments into brands and distribution capabilities coupled
with limited/staggered price increases and 150bp yoy jump in Other Expenditure (due to
recovery in fuel prices) led to a sharp Margin contraction of 397bp yoy at the EBITDA level.
Hence, EBITDA registered a decline of 2% yoy to Rs304cr (Rs310cr).
Post 1QCY2010 results, we have revised our Earnings estimates for Nestle marginally
downwards by ~3-5% to factor in higher-than-expected rise in input costs, jump in Other
expenditure (due to higher fuel costs), higher brand investments (due to rising competition
particularly in Noodles category) and lower Tax savings in the current year (model in a Tax
rate of 26% and 24.5% for CY2010E and CY2011E respectively). However, we have
maintained our Top-line estimates and note that there could be upside risks to same given
Nestle’s strong pricing power (has only taken limited/staggered price hikes in recent
quarters). At the CMP of Rs2,865, the stock is trading at rich valuations of 29.1x CY2011E
revised EPS of Rs98.5. Nestle justifies its premium valuations compared to its peers on
account of its global parent support, strong brand recall, excellent Return Ratios and
superior EBITDA Margins. However, at current levels, we believe the stock leaves little room
for upside and negative surprises given significant spike up in input costs and rising
competitive pressures (particularly in Noodles category). Hence, we downgrade the stock to
Neutral from Accumulate with a revised Fair value of Rs2,841 (Rs2,925) and await better
entry opportunities in the stock.
Result Previews
AREVA T&D India (1QCY2010)
Areva T&D India is scheduled to announce its 1QCY2010 results today. The top-line of the
company is expected to grow at 16.9% yoy to Rs988cr. On the operating front, we expect
the company to register an 88bp margin compression to 12%. Consequently, the net profit
is expected to increase at 14.8% yoy to Rs59cr. We maintain our Neutral recommendation
on the stock.
April 23, 2010 3
4. Market Outlook | India Research
Corporation Bank (4QFY2010)
Corporation Bank is scheduled to announce its 4QFY2010 results today. The bank is
expected to post a strong Net Interest Income growth of 48% yoy to Rs635cr. However, due
to absence of treasury gains in 4QFY2010, the net profit growth is expected to be flat. We
will be closely watching slippages from the restructured loans of the bank which stand at
Rs2,478cr, forming 43.1% of the networth. The Bank has one of the lowest Operating
expenses as a % to average Assets, healthy Asset quality history, and a track record of
proactive Investments in modern distribution and payment systems (relative to its peers). At
the CMP, the stock is trading at 5.6x FY2012E EPS of Rs89.5 and 0.9x FY2012E Adjusted
Book Value of Rs530. We have a Neutral rating on the stock.
GSK Consumer (1QCY2010)
GSK Consumer is slated to announce its 1QCY2010 numbers. For the quarter, we expect
GSK Consumer to post a growth of 12.6% in its Top-line to Rs608cr (Rs539cr), driven by
growth in its core brands and new product launches. On the operating margin front, we
expect the company’s OPM to increase by 245bp to 24.5%. The Bottom-line is expected to
register a growth of 19.8% yoy to Rs101.5cr (Rs83.9cr), aided largely by Top-line growth
and Margin expansion. We maintain our Neutral view on the stock.
RIL (4QFY2010)
RIL is slated to announce 4QFY2010 results today. The Top-line during the quarter is
expected to increase by 119.4% yoy to Rs62,232cr largely on account of increase in the
crude oil prices, commencement of gas production from the KG-basin and increased
refinery throughput. Operating profits are expected to increase by 80.3% yoy to Rs9,817cr
(Rs5,446cr), largely on account of higher gas production from the KG basin, coupled with
the increased production from the new refinery. In the Upstream Segment, we expect KG
gas sales volumes to increase to an average of 63mmscmd during 4QFY2010. On the
refining front, we expect RIL's Refining Margins to increase, to an average of US $8.5/bbl
(US $5.9/bbl-3QFY2010) on qoq basis; however, the same is likely to decline yoy, on
account of weak product cracks. On the Petrochemical front, performance is likely to be
flat on qoq basis on account of subdued PP Margins. Inspite of the strong growth in
EBIDTA, we expect the Bottom-line to increase at a lower rate of 31.9% yoy to Rs5,109cr
(3,874cr). We maintain a Buy on the stock, with a Target Price of Rs1,260.
Wipro (4QFY2010)
We expect Wipro to witness 1.9% qoq growth in revenues to Rs 7,096cr in 4QFY2010
backed by volumes as 1.6% Rupee appreciation vis-à-vis US dollar during the quarter
would restrict the further growth in revenues. The EBIDTA margins are expected to contract
by 40bp on account of higher manpower intake and SG&A costs with improved business
environment, however the net profit is expected to be up by 0.8% qoq to Rs1,228cr. We
maintain Accumulate on the stock with a Target Price of Rs760.
April 23, 2010 4
5. Market Outlook | India Research
Economic and Political News
Food inflation climbs further to 17.7%
Number of domestic flyers up 21% in Jan-Mar
3G bids reach Rs6,877cr on day 11
Corporate News
NTPC may sign pact for additional KG-D6 gas
Bharat Forge launches US$150mn QIP issue
M&M slashes Logan prices by Rs24,000-80,000
Bajaj Hindusthan to invest Rs15,000cr in UP
Source: Economic Times, Business Standard, Business Line, Financial Express, Mint
Events for the day
3i Infotech Results
Areva T&D Results
Corporation Bank Results
GSK Consumer Results
GMR Ind. Results
MMTC Results
Merck Results
Pantaloon Retail Results
Piramal Glass Results
Procter & Gamble Results
RIL Results
Wipro Results
April 23, 2010 5
6. Market Outlook | India Research
Research Team Tel: 022-4040 3800 E-mail: research@angeltrade.com Website: www.angeltrade.com
DISCLAIMER
This document is solely for the personal information of the recipient, and must not be singularly used as the basis of any investment decision. Nothing in
this document should be construed as investment or financial advice. Each recipient of this document should make such investigations as they deem
necessary to arrive at an independent evaluation of an investment in the securities of the companies referred to in this document (including the merits and
risks involved), and should consult their own advisors to determine the merits and risks of such an investment.
Angel Securities Limited, its affiliates, directors, its proprietary trading and investment businesses may, from time to time, make investment decisions that
are inconsistent with or contradictory to the recommendations expressed herein. The views contained in this document are those of the analyst, and the
company may or may not subscribe to all the views expressed within.
Reports based on technical and derivative analysis center on studying charts of a stock's price movement, outstanding positions and trading volume, as
opposed to focusing on a company's fundamentals and, as such, may not match with a report on a company's fundamentals.
The information in this document has been printed on the basis of publicly available information, internal data and other reliable sources believed to be
true, and is for general guidance only. Angel Securities Limited has not independently verified all the information contained within this document.
Accordingly, we cannot testify, nor make any representation or warranty, express or implied, to the accuracy, contents or data contained within this
document. While Angel Securities Limited endeavours to update on a reasonable basis the information discussed in this material, there may be
regulatory, compliance, or other reasons that prevent us from doing so.
This document is being supplied to you solely for your information, and its contents, information or data may not be reproduced, redistributed or passed
on, directly or indirectly.
Angel Securities Limited and its affiliates may seek to provide or have engaged in providing corporate finance, investment banking or other advisory
services in a merger or specific transaction to the companies referred to in this report, as on the date of this report or in the past.
Neither Angel Securities Limited, nor its directors, employees or affiliates shall be liable for any loss or damage that may arise from or in connection with
the use of this information.
Note: Please refer to the important `Stock Holding Disclosure' report on the Angel website (Research Section).
Address: Acme Plaza, ‘A’ Wing, 3rd Floor, M.V. Road, Opp. Sangam Cinema, Andheri (E), Mumbai - 400 059.
Tel : (022) 3952 4568 / 4040 3800
Angel Broking Ltd: BSE Sebi Regn No : INB 010996539 / CDSL Regn No: IN - DP - CDSL - 234 - 2004 / PMS Regn Code: PM/INP000001546 Angel Securities Ltd:BSE: INB010994639/INF010994639 NSE:
INB230994635/INF230994635 Membership numbers: BSE 028/NSE:09946
Angel Capital & Debt Market Ltd: INB 231279838 / NSE FNO: INF 231279838 / NSE Member code -12798 Angel Commodities Broking (P) Ltd: MCX Member ID: 12685 / FMC Regn No: MCX / TCM /
CORP / 0037 NCDEX : Member ID 00220 / FMC Regn No: NCDEX / TCM / CORP / 0302
April 23, 2010 6