Best VIP Call Girls Noida Sector 18 Call Me: 8448380779
Federal bank ru2 qfy2011-291010
1. Please refer to important disclosures at the end of this report 1
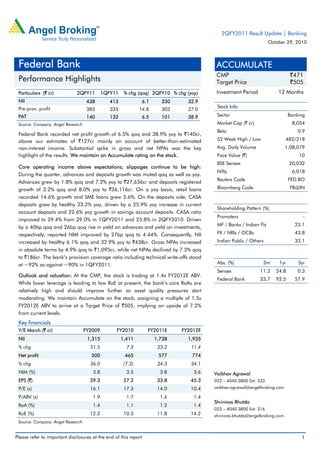
Particulars (` cr) 2QFY11 1QFY11 % chg (qoq) 2QFY10 % chg (yoy)
NII 438 413 6.1 330 32.9
Pre-prov. profit 385 335 14.8 303 27.0
PAT 140 132 6.5 101 38.9
Source: Company, Angel Research
Federal Bank recorded net profit growth of 6.5% qoq and 38.9% yoy to `140cr,
above our estimates of `127cr mainly on account of better-than-estimated
non-interest income. Substantial spike in gross and net NPAs was the key
highlight of the results. We maintain an Accumulate rating on the stock.
Core operating income above expectations; slippages continue to be high:
During the quarter, advances and deposits growth was muted qoq as well as yoy.
Advances grew by 1.8% qoq and 7.2% yoy to `27,636cr and deposits registered
growth of 3.2% qoq and 8.0% yoy to `36,116cr. On a yoy basis, retail loans
recorded 14.6% growth and SME loans grew 5.6%. On the deposits side, CASA
deposits grew by healthy 23.2% yoy, driven by a 25.9% yoy increase in current
account deposits and 22.6% yoy growth in savings account deposits. CASA ratio
improved to 29.4% from 29.0% in 1QFY2011 and 25.8% in 2QFY2010. Driven
by a 40bp qoq and 26bp qoq rise in yield on advances and yield on investments,
respectively, reported NIM improved by 27bp qoq to 4.44%. Consequently, NII
increased by healthy 6.1% qoq and 32.9% yoy to `438cr. Gross NPAs increased
in absolute terms by 4.9% qoq to `1,095cr, while net NPAs declined by 7.2% qoq
to `186cr. The bank’s provision coverage ratio including technical write-offs stood
at ~92% as against ~90% in 1QFY2011.
Outlook and valuation: At the CMP, the stock is trading at 1.4x FY2012E ABV.
While lower leverage is leading to low RoE at present, the bank’s core RoAs are
relatively high and should improve further as asset quality pressures start
moderating. We maintain Accumulate on the stock, assigning a multiple of 1.5x
FY2012E ABV to arrive at a Target Price of `505, implying an upside of 7.2%
from current levels.
Key financials
Y/E March (` cr) FY2009 FY2010 FY2011E FY2012E
NII 1,315 1,411 1,738 1,935
% chg 51.5 7.3 23.2 11.4
Net profit 500 465 577 774
% chg 36.0 (7.2) 24.3 34.1
NIM (%) 3.8 3.5 3.8 3.6
EPS (`) 29.3 27.2 33.8 45.3
P/E (x) 16.1 17.3 14.0 10.4
P/ABV (x) 1.9 1.7 1.6 1.4
RoA (%) 1.4 1.1 1.2 1.4
RoE (%) 12.2 10.3 11.8 14.2
Source: Company, Angel Research
ACCUMULATE
CMP `471
Target Price `505
Investment Period 12 Months
Stock Info
Sector Banking
Market Cap (` cr) 8,054
Beta 0.9
52 Week High / Low 482/218
Avg. Daily Volume 1,08,079
Face Value (`) 10
BSE Sensex 20,032
Nifty 6,018
Reuters Code FED.BO
Bloomberg Code FB@IN
Shareholding Pattern (%)
Promoters -
MF / Banks / Indian Fls 23.1
FII / NRIs / OCBs 43.8
Indian Public / Others 33.1
Abs. (%) 3m 1yr 3yr
Sensex 11.3 24.8 0.3
Federal Bank 33.7 92.5 57.9
Vaibhav Agrawal
022 – 4040 3800 Ext: 333
vaibhav.agrawal@angelbroking.com
Shrinivas Bhutda
022 – 4040 3800 Ext: 316
shrinivas.bhutda@angelbroking.com
2QFY2011 Result Update | Banking
October 29, 2010
Federal Bank
Performance Highlights
2. Federal Bank | 2QFY2011 Result Update
October 29, 2010 2
Exhibit 1: 2QFY2011 performance
Particulars (` cr) 2QFY11 1QFY11 % chg (qoq) 2QFY10 % chg (yoy)
Interest earned 978 952 2.8 901 8.6
Interest expenses 540 538 0.3 571 (5.5)
NII 438 413 6.1 330 32.9
Non-interest income 144 110 31.1 136 5.6
Operating income 582 523 11.3 466 24.9
Operating expenses 197 188 5.1 163 21.0
Pre-prov. profit 385 335 14.8 303 27.0
Provisions & cont. 170 133 27.7 150 13.4
PBT 215 202 6.3 153 40.2
Prov. for taxes 74 70 6.0 52 42.8
PAT 140 132 6.5 101 38.9
EPS (`) 8.2 7.7 6.5 5.9 38.9
Cost-to-income ratio (%) 33.9 35.9 35.0
Effective tax rate (%) 34.6 34.7 34.0
Net NPA (%) 0.7 0.7 0.5
Source: Company, Angel Research
Exhibit 2: 2QFY2011 Actual v/s Angel estimates
Particulars (` cr) Actual Estimates Var. (%)
Net interest income 438 413 6.0
Non-interest income 144 103 40.0
Operating income 582 516 12.8
Operating expenses 197 196 0.5
Pre-prov. profit 385 320 20.3
Provisions & cont. 170 127 33.9
PBT 215 193 11.4
Prov. for taxes 74 66 13.4
PAT 140 127 10.4
Source: Company, Angel Research
3. Federal Bank | 2QFY2011 Result Update
October 29, 2010 3
Advances and deposits growth below industry
For 2QFY2011, advances and deposits growth was muted on a qoq as well as yoy
basis. Advances grew by 1.8% qoq and 7.2% yoy to `27,636cr and deposits
registered growth of 3.2% qoq and 8.0% yoy to `36,116cr. On a yoy basis, retail
loans recorded 14.6% growth, SME loans grew 5.6% and corporate loans grew
marginally by 0.9%. While on a sequential basis, corporate loans registered a
3.0% decline, while SME and retail loans grew by 7.6% and 3.0%, respectively.
On the deposits side, CASA deposits grew by healthy 23.2% yoy, driven by a
25.9% yoy increase in current account deposits and 22.6% yoy growth in savings
account deposits. On a sequential basis, CASA deposits grew by 4.7% qoq on the
back of a 7.0% increase in current account deposits and 4.1% growth in savings
account deposits. CASA ratio improved to 29.4% from 29.0% in 1QFY2011 and
25.8% in 2QFY2010.
Driven by a 40bp qoq and 26bp qoq rise in yield on advances and yield on
investments, respectively, the reported NIM improved by 27bp qoq to 4.44%.
Consequently, NII increased by healthy 6.1% qoq and 32.9% yoy to `438cr. For
FY2011, management expects NIM to moderate to 3.7–3.8% from current levels.
Exhibit 3: Trend in advances and deposits
Source: Company, Angel Research
Exhibit 4: Trend in deposit-mix
Source: Company, Angel Research
Exhibit 5: Break-up of gross advances
Source: Company, Angel Research
69.5
73.3
77.1
75.3 74.7
77.6 76.5
60.0
66.0
72.0
78.0
84.0
-
10,000
20,000
30,000
40,000
4QFY09
1QFY10
2QFY10
3QFY10
4QFY10
1QFY11
2QFY11
Advances (` cr) Deposits (` cr) CD ratio (%, RHS)
4.5 4.8 4.8 4.9 5.1 5.4 5.6
20.0 21.3 21.0 21.0 21.1 23.6 23.8
75.5 73.9 74.2 74.1 73.8 71.0 70.6
0%
20%
40%
60%
80%
100%
4QFY09
1QFY10
2QFY10
3QFY10
4QFY10
1QFY11
2QFY11
CA SA Term Deposits
Large corporates
38%
SME
31%
Housing
18%
Gold loans
3%
Adv. against
sec./dep.
2%
Mortgage
1%
Home OD
2%
Vehicle
2%
Education
1%
Others
2%
Retail
31%
4. Federal Bank | 2QFY2011 Result Update
October 29, 2010 4
Strong recoveries drive non-interest income
Non-interest income registered growth of 31.1% qoq and 5.6% yoy to `144cr, in
spite of a 14.7% qoq and 51.8% yoy decline in treasury income. Growth in
non-interest income excluding treasury was healthy at 39.2% qoq and 21.3% yoy.
Growth in other income was driven by strong recoveries, which increased by
160.1% qoq and 66.8% yoy to `47cr compared to `18cr in 1QFY2011 and `28cr
in 2QFY2010. Commission, exchange and brokerage (CEB) income growth was
muted, in line with advances growth.
Exhibit 6: Recoveries drive growth in other income
Particulars (` cr) 2QFY11 1QFY11 % chg (qoq) 2QFY10 % chg (yoy)
CEB 29 28 5.4 29 1.5
Treasury 14 17 (14.7) 29 (51.8)
Forex 14 14 (1.4) 13 9.2
Recoveries 47 18 160.1 28 66.8
Others 40 34 19.1 38 6.4
Total 144 110 31.1 136 5.6
Source: Company, Angel Research
Operating costs under control
During the quarter, the bank’s operating expenses increased by 21.0% yoy, driven
by a 34.6% increase in employee costs and 4.4% increase in other operating
expenses. Cost-to-income ratio improved on the back of healthy operating
performance to 33.9% (from 35.9% in 1QFY2011 and 35.0% in 2QFY2010).
Exhibit 7: Trend in productivity
Source: Company, Angel Research
66
72
103
77
92
90
87
96
105
121
55
62
62
76
67
73
79
92
83
77
32.3
30.5 30.0
32.4
36.4 35.0
33.4 34.9 35.9
33.9
-
5.0
10.0
15.0
20.0
25.0
30.0
35.0
40.0
-
50
100
150
200
250
1QFY09
2QFY09
3QFY09
4QFY09
1QFY10
2QFY10
3QFY10
4QFY10
1QFY11
2QFY11
Staff exps (` cr) Other opex (` cr) Cost-to-income ratio (%, RHS)
5. Federal Bank | 2QFY2011 Result Update
October 29, 2010 5
Slippages still high
Gross NPAs increased in absolute terms by 4.9% qoq to `1,095cr, while net NPAs
declined by 7.2% qoq to `186cr. Gross NPA ratio deteriorated to 3.84% as against
3.73% in 1QFY2011, while net NPA ratio improved from 0.74% in 1QFY2011 to
0.68% in 2QFY2011. Gross slippages stood at `257cr (as against `327cr in
1QFY2011), indicating an annualised slippage ratio of 3.8% (4.8% in 1QFY2011).
Majority of the slippages were from the SME segment (`121cr), while the retail
loans segment witnessed slippages of `75cr, of which slippages of ~`60cr were
from the housing segment. Out of the outstanding gross NPAs, the SME loans
segment accounts for 45.2% and the retail and corporate loans segments account
for 33.1% and 21.7%, respectively. Management has indicated that it will take
about 4–6 quarters for the slippage rate to come down by 150–200bp.
Accordingly, we have conservatively increased our estimates for provision expenses
for FY2011 by 25.1% and for FY2012 by 9.9%. There could be an upside to our
earnings estimates from stronger-than-expected recoveries and upgrades (already
`126cr or 1.9% of advances in 2QFY2011) along with strong recoveries from fully
written-off accounts (already `47cr in 2QFY2011).
On the positive side, the bank’s provision coverage ratio including technical
write-offs remained strong at ~92% as against ~90% in 1QFY2011. The bank
restructured `103cr of its loans during the quarter, taking its cumulative
restructured loans to `1,243cr (4.5% of loans, 25.1% of net worth).
Exhibit 8: Trend in asset quality
Source: Company, Angel Research; Note: NPA coverage % excluding technical write-offs
The bank made provisions of `143cr towards NPAs in 2QFY2011, up 5.3% from
`136cr made in 1QFY2011. The bank had to provide for depreciation of `8cr on
investments compared to a write-back of `4cr in 1QFY2011 and `27cr in
2QFY2010. The bank also made provisions of ~`16cr on account of the second
pension option, of which total liability is estimated to be ~`145cr.
572
626
590
631
789
791
821
1,044
1,095
85
71
68
67
138
147
129
201
186
85.1
88.7 88.4 89.3
82.5 81.4
83.4
88.4
82.2
60.0
65.0
70.0
75.0
80.0
85.0
90.0
-
300
600
900
1,200
2QFY09
3QFY09
4QFY09
1QFY10
2QFY10
3QFY10
4QFY10
1QFY11
2QFY11
Gross NPAs (` cr) Net NPAs (` cr) Coverage ratio (%, RHS)
6. Federal Bank | 2QFY2011 Result Update
October 29, 2010 6
Exhibit 9: Break-up of provisions
Particulars (` cr) 2QFY11 1QFY11 % chg (qoq) 2QFY10 % chg (yoy)
NPA 143 136 5.3 159 (9.9)
Investment-related 8 (4) - (27) -
Others 20 2 1,071.9 18 8.7
Total 170 133 27.7 150 13.4
Source: Company, Angel Research
Comfortable capital adequacy (CAR)
The bank’s CAR was strong at 17.3% as compared to 17.9% in 1QFY2011.
Tier-I capital component was at 16.0%, constituting 92.6% of the total CAR.
Exhibit 10: Comfortable capital adequacy
Source: Company, Angel Research
Investment arguments
Healthy deposit mix
Federal Bank’s CASA deposits grew at a 20.4% CAGR during FY2005–10, leading
to a stable 25%+ CASA ratio. Further, a key differentiator for the bank is the
low-cost NRI deposits base, which constitutes 15.6% of total deposits. Thus,
effectively, low-cost deposits as a proportion of total deposits stand at around
45.0%, which are expected to underpin calculated NIM of about 3.6% in FY2012E,
even as the bank grows its advances faster than the industry to leverage its large
net worth.
Impact of Dubai crisis within manageable limits
The stock has been an underperformer due to concerns over the impact of the
Dubai crisis on the bank’s business model, which benefits meaningfully from
Middle East NRI clients. However, as indicated by the management, the bank has
a very low direct loan exposure of about `350cr (1.3% of loan book) to these
clients. Hence, the impact of the crisis on asset quality is expected to be within
manageable limits.
18.4 17.5 17.0 17.1
16.0 16.6 16.0
1.8
1.6
1.5 1.5
1.3
1.3
1.3
9.0
12.0
15.0
18.0
21.0
4QFY09
1QFY10
2QFY10
3QFY10
4QFY10
1QFY11
2QFY11
Tier-I CAR Tier-II CAR(%)
7. Federal Bank | 2QFY2011 Result Update
October 29, 2010 7
Reasonable valuations
At the CMP, the stock is trading at 1.4x FY2012E ABV. While lower leverage is
leading to low RoE at present, the bank’s core RoAs are relatively high and should
improve further as asset quality pressures start moderating. We maintain
Accumulate on the stock, assigning a multiple of 1.5x FY2012E ABV to arrive at a
Target Price of `505, implying an upside of 7.2% from current levels.
Exhibit 11: Key assumptions
Particulars (%)
Earlier estimates Revised estimates
FY2011E FY2012E FY2011E FY2012E
Credit growth 23.0 24.0 15.0 24.0
Deposit growth 23.0 24.0 15.0 24.0
CASA ratio 24.5 22.5 26.2 24.0
NIM 3.7 3.4 3.8 3.6
Other income growth 27.6 21.0 0.8 18.1
Growth in staff expenses 18.4 19.2 30.0 18.0
Growth in other expenses 18.4 19.2 5.0 18.0
Slippages 3.5 2.7 3.5 2.7
Coverage ratio 82.5 79.9 83.5 88.2
Treasury gain/(loss) (% of investments) 0.3 0.3 0.3 0.2
Source: Company, Angel Research
Exhibit 12: Change in estimates
Particulars (` cr)
FY2011E FY2012E
Earlier
estimates
Revised
estimates
% chg
Earlier
estimates
Revised
estimates
% chg
NII 1,727 1,738 0.7 1,984 1,935 (2.4)
Non-interest income 515 535 4.0 622 632 1.5
Operating income 2,241 2,273 1.4 2,606 2,567 (1.5)
Operating expenses 801 802 0.1 955 947 (0.9)
Pre-prov. profit 1,440 1,471 2.1 1,651 1,621 (1.8)
Provisions & cont. 480 600 25.1 412 453 9.9
PBT 960 871 (9.3) 1,239 1,168 (5.7)
Prov. for taxes 326 293 (10.1) 421 393 (6.6)
PAT 634 577 (8.9) 818 774 (5.3)
Source: Company, Angel Research
11. Federal Bank | 2QFY2011 Result Update
October 29, 2010 11
Research Team Tel: 022 - 4040 3800 E-mail: research@angeltrade.com Website: www.angeltrade.com
DISCLAIMER
This document is solely for the personal information of the recipient, and must not be singularly used as the basis of any investment
decision. Nothing in this document should be construed as investment or financial advice. Each recipient of this document should make
such investigations as they deem necessary to arrive at an independent evaluation of an investment in the securities of the companies
referred to in this document (including the merits and risks involved), and should consult their own advisors to determine the merits and
risks of such an investment.
Angel Broking Limited, its affiliates, directors, its proprietary trading and investment businesses may, from time to time, make
investment decisions that are inconsistent with or contradictory to the recommendations expressed herein. The views contained in this
document are those of the analyst, and the company may or may not subscribe to all the views expressed within.
Reports based on technical and derivative analysis center on studying charts of a stock's price movement, outstanding positions and
trading volume, as opposed to focusing on a company's fundamentals and, as such, may not match with a report on a company's
fundamentals.
The information in this document has been printed on the basis of publicly available information, internal data and other reliable
sources believed to be true, but we do not represent that it is accurate or complete and it should not be relied on as such, as this
document is for general guidance only. Angel Broking Limited or any of its affiliates/ group companies shall not be in any way
responsible for any loss or damage that may arise to any person from any inadvertent error in the information contained in this report.
Angel Broking Limited has not independently verified all the information contained within this document. Accordingly, we cannot testify,
nor make any representation or warranty, express or implied, to the accuracy, contents or data contained within this document. While
Angel Broking Limited endeavours to update on a reasonable basis the information discussed in this material, there may be regulatory,
compliance, or other reasons that prevent us from doing so.
This document is being supplied to you solely for your information, and its contents, information or data may not be reproduced,
redistributed or passed on, directly or indirectly.
Angel Broking Limited and its affiliates may seek to provide or have engaged in providing corporate finance, investment banking or
other advisory services in a merger or specific transaction to the companies referred to in this report, as on the date of this report or in
the past.
Neither Angel Broking Limited, nor its directors, employees or affiliates shall be liable for any loss or damage that may arise from or in
connection with the use of this information.
Note: Please refer to the important `Stock Holding Disclosure' report on the Angel website (Research Section). Also, please
refer to the latest update on respective stocks for the disclosure status in respect of those stocks. Angel Broking Limited and
its affiliates may have investment positions in the stocks recommended in this report.
Disclosure of Interest Statement Federal Bank
1. Analyst ownership of the stock No
2. Angel and its Group companies ownership of the stock No
3. Angel and its Group companies' Directors ownership of the stock No
4. Broking relationship with company covered No
Note: We have not considered any Exposure below ` 1 lakh for Angel, its Group companies and Directors.
Ratings (Returns): Buy (> 15%) Accumulate (5% to 15%) Neutral (-5 to 5%)
Reduce (-5% to 15%) Sell (< -15%)