1. Derivative Report
India Research
Sep 23, 2010
Comments
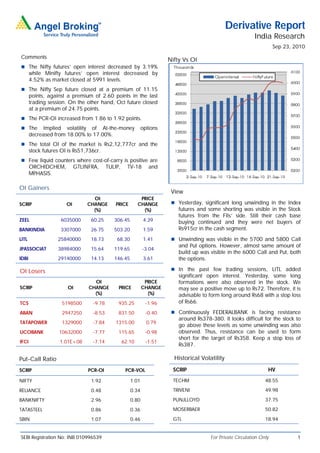
Nifty Vs OI
The Nifty futures’ open interest decreased by 3.19%
while Minifty futures’ open interest decreased by
4.52% as market closed at 5991 levels.
The Nifty Sep future closed at a premium of 11.15
points, against a premium of 2.60 points in the last
trading session. On the other hand, Oct future closed
at a premium of 24.75 points.
The PCR-OI increased from 1.86 to 1.92 points.
The Implied volatility of At-the-money options
decreased from 18.00% to 17.00%.
The total OI of the market is Rs2,12,777cr and the
stock futures OI is Rs51,736cr.
Few liquid counters where cost-of-carry is positive are
ORCHIDCHEM, GTLINFRA, TULIP, TV-18 and
MPHASIS.
OI Gainers
View
OI PRICE
SCRIP OI CHANGE PRICE CHANGE Yesterday, significant long unwinding in the Index
(%) (%) futures and some shorting was visible in the Stock
futures from the FIIs’ side. Still their cash base
ZEEL 6035000 60.25 306.45 4.39 buying continued and they were net buyers of
BANKINDIA 3307000 26.75 503.20 1.59 Rs915cr in the cash segment.
LITL 25840000 18.73 68.30 1.41 Unwinding was visible in the 5700 and 5800 Call
and Put options. However, almost same amount of
JPASSOCIAT 38984000 15.64 119.65 -3.04
build up was visible in the 6000 Call and Put, both
IDBI 29140000 14.13 146.45 3.61 the options.
OI Losers In the past few trading sessions, LITL added
significant open interest. Yesterday, some long
OI PRICE formations were also observed in the stock. We
SCRIP OI CHANGE PRICE CHANGE may see a positive move up to Rs72. Therefore, it is
(%) (%) advisable to form long around Rs68 with a stop loss
TCS 5198500 -9.78 935.25 -1.96 of Rs66.
ABAN 2947250 -8.53 831.50 -0.40 Continuously FEDERALBANK is facing resistance
around Rs378-380. It looks difficult for the stock to
TATAPOWER 1329000 -7.84 1315.00 0.79
go above these levels as some unwinding was also
UCOBANK 10632000 -7.77 115.65 -0.98 observed. Thus, resistance can be used to form
short for the target of Rs358. Keep a stop loss of
IFCI 1.01E+08 -7.14 62.10 -1.51
Rs387.
Put-Call Ratio Historical Volatility
SCRIP PCR-OI PCR-VOL SCRIP HV
NIFTY 1.92 1.01 TECHM 48.55
RELIANCE 0.48 0.34 TRIVENI 49.98
BANKNIFTY 2.96 0.80 PUNJLLOYD 37.75
TATASTEEL 0.86 0.36 MOSERBAER 50.82
SBIN 1.07 0.46 GTL 18.94
SEBI Registration No: INB 010996539 For Private Circulation Only 1
2. Derivative Report | India Research
FII Statistics for 22-Sep-2010 Turnover on 22-Sep-2010
Open Interest
No. of Turnover Change
Detail Buy Sell Net Instrument
Contracts (Rs. in cr.) (%)
Contracts Value Change
(Rs. in cr.) (%)
INDEX Index Futures 856055 24502.42 10.34
4276.73 5994.13 (1717.40) 802324 24073.83 -5.73
FUTURES
INDEX Stock Futures 907469 28005.55 0.26
9013.52 10352.33 (1338.81) 2996151 89758.96 -0.45
OPTIONS
STOCK Index Options 3222120 96246.32 -4.28
3412.78 4273.04 (860.26) 1378057 40907.85 0.61
FUTURES
STOCK Stock Options 160302 5348.91 -8.29
698.01 714.96 (16.96) 56223 1760.19 0.61
OPTIONS
TOTAL 17401.04 21334.47 (3933.43) 5232755 156500.83 -1.01 Total 5145946 154103.2 -1.55
Nifty Spot = 5991.00 Lot Size = 50
Bull-Call Spreads Bear-Put Spreads
Action Strike Price Risk Reward BEP Action Strike Price Risk Reward BEP
Buy 6000 61.70 Buy 5900 29.95
34.95 65.05 6034.95 13.45 86.55 5886.55
Sell 6100 26.75 Sell 5800 16.50
Buy 6000 61.70 Buy 5900 29.95
52.25 147.75 6052.25 21.15 178.85 5878.85
Sell 6200 9.45 Sell 5700 8.80
Buy 6100 26.75 Buy 5800 16.50
17.30 82.70 6117.30 7.70 92.30 5792.30
Sell 6200 9.45 Sell 5700 8.80
Note: Above mentioned Bullish or Bearish Spreads in Nifty (September Series) are given as an information and not as a recommendation
Nifty Put-Call Analysis
For Private Circulation Only SEBI Registration No: INB 010996539 2
3. Derivative Report | India Research
Strategy Date Scrip Strategy Status
30-Aug-10 RELINFRA Long Call Ladder Continue
06-Sep-10 BHARTIARTL Ratio Put Spread Continue
13-Sep-10 HINDUNILVR Call Hedge Continue
13-Sep-10 NIFTY Long Put Continue
20-Sep-10 RPOWER Ratio Bull Call Spread Continue
20-Sep-10 IFCI Ratio Bull Call Spread Continue
DISCLAIMER
This document is solely for the personal information of the recipient, and must not be singularly used as the basis of any investment
decision. Nothing in this document should be construed as investment or financial advice. Each recipient of this document should
make such investigations as they deem necessary to arrive at an independent evaluation of an investment in the securities of the
companies referred to in this document (including the merits and risks involved), and should consult their own advisors to determine
the merits and risks of such an investment.
Angel Broking Limited, its affiliates, directors, its proprietary trading and investment businesses may, from time to time, make
investment decisions that are inconsistent with or contradictory to the recommendations expressed herein. The views contained in this
document are those of the analyst, and the company may or may not subscribe to all the views expressed within.
Reports based on technical and derivative analysis center on studying charts of a stock's price movement, outstanding positions and
trading volume, as opposed to focusing on a company's fundamentals and, as such, may not match with a report on a company's
fundamentals.
The information in this document has been printed on the basis of publicly available information, internal data and other reliable
sources believed to be true, but we do not represent that it is accurate or complete and it should not be relied on as such, as this
document is for general guidance only. Angel Broking or any of its affiliates/ group companies shall not be in any way responsible
for any loss or damage that may arise to any person from any inadvertent error in the information contained in this report. Angel
Broking Limited has not independently verified all the information contained within this document. Accordingly, we cannot testify, nor
make any representation or warranty, express or implied, to the accuracy, contents or data contained within this document. While
Angel Broking Limited endeavours to update on a reasonable basis the information discussed in this material, there may be
regulatory, compliance, or other reasons that prevent us from doing so.
This document is being supplied to you solely for your information, and its contents, information or data may not be reproduced,
redistributed or passed on, directly or indirectly.
Angel Broking Limited and its affiliates may seek to provide or have engaged in providing corporate finance, investment banking or
other advisory services in a merger or specific transaction to the companies referred to in this report, as on the date of this report or
in the past.
Neither Angel Broking Limited, nor its directors, employees or affiliates shall be liable for any loss or damage that may arise from or
in connection with the use of this information.
Note: Please refer to the important `Stock Holding Disclosure' report on the Angel website (Research Section).
Derivative Research Team derivatives.desk@angeltrade.com
For Private Circulation Only SEBI Registration No: INB 010996539 3