1. 4QFY2010 Result Update I Banking
April 29, 2010
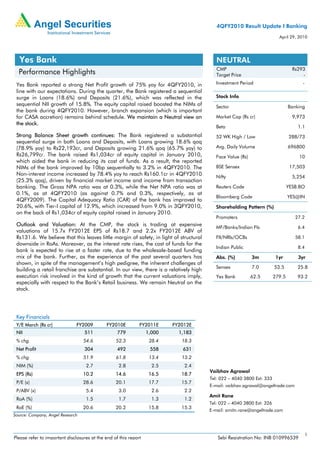
Yes Bank NEUTRAL
CMP Rs293
Performance Highlights Target Price -
Yes Bank reported a strong Net Profit growth of 75% yoy for 4QFY2010, in Investment Period -
line with our expectations. During the quarter, the Bank registered a sequential
surge in Loans (18.6%) and Deposits (21.6%), which was reflected in the Stock Info
sequential NII growth of 15.8%. The equity capital raised boosted the NIMs of Sector Banking
the bank during 4QFY2010. However, branch expansion (which is important
for CASA accretion) remains behind schedule. We maintain a Neutral view on Market Cap (Rs cr) 9,973
the stock.
Beta 1.1
Strong Balance Sheet growth continues: The Bank registered a substantial 52 WK High / Low 288/73
sequential surge in both Loans and Deposits, with Loans growing 18.6% qoq
(78.9% yoy) to Rs22,193cr, and Deposits growing 21.6% qoq (65.7% yoy) to Avg. Daily Volume 696800
Rs26,799cr. The bank raised Rs1,034cr of equity capital in January 2010, Face Value (Rs) 10
which aided the bank in reducing its cost of funds. As a result, the reported
NIMs of the bank improved by 10bp sequentially to 3.2% in 4QFY2010. The BSE Sensex 17,503
Non-interest income increased by 78.4% yoy to reach Rs160.1cr in 4QFY2010 Nifty 5,254
(25.3% qoq), driven by financial market income and income from transaction
banking. The Gross NPA ratio was at 0.3%, while the Net NPA ratio was at Reuters Code YESB.BO
0.1%, as at 4QFY2010 (as against 0.7% and 0.3%, respectively, as at
Bloomberg Code YES@IN
4QFY2009). The Capital Adequacy Ratio (CAR) of the bank has improved to
20.6%, with Tier-I capital of 12.9%, which increased from 9.0% in 3QFY2010, Shareholding Pattern (%)
on the back of Rs1,034cr of equity capital raised in January 2010.
Promoters 27.2
Outlook and Valuation: At the CMP, the stock is trading at expensive MF/Banks/Indian FIs 6.4
valuations of 15.7x FY2012E EPS of Rs18.7 and 2.2x FY2012E ABV of
Rs131.6. We believe that this leaves little margin of safety, in light of structural FII/NRIs/OCBs 58.1
downside in RoAs. Moreover, as the interest rate rises, the cost of funds for the
Indian Public 8.4
bank is expected to rise at a faster rate, due to the wholesale-based funding
mix of the bank. Further, as the experience of the past several quarters has Abs. (%) 3m 1yr 3yr
shown, in spite of the management’s high pedigree, the inherent challenges of
Sensex 7.0 53.5 25.8
building a retail franchise are substantial. In our view, there is a relatively high
execution risk involved in the kind of growth that the current valuations imply, Yes Bank 62.5 279.5 93.2
especially with respect to the Bank’s Retail business. We remain Neutral on the
stock.
Key Financials
Y/E March (Rs cr) FY2009 FY2010E FY2011E FY2012E
NII 511 779 1,000 1,183
% chg 54.6 52.3 28.4 18.3
Net Profit 304 492 558 631
% chg 51.9 61.8 13.4 13.2
NIM (%) 2.7 2.8 2.5 2.4
Vaibhav Agrawal
EPS (Rs) 10.2 14.6 16.5 18.7
Tel: 022 – 4040 3800 Ext: 333
P/E (x) 28.6 20.1 17.7 15.7
E-mail: vaibhav.agrawal@angeltrade.com
P/ABV (x) 5.4 3.0 2.6 2.2
Amit Rane
RoA (%) 1.5 1.7 1.3 1.2
Tel: 022 – 4040 3800 Ext: 326
RoE (%) 20.6 20.2 15.8 15.3
E-mail: amitn.rane@angeltrade.com
Source: Company, Angel Research
1
Please refer to important disclosures at the end of this report Sebi Registration No: INB 010996539
2. Yes Bank I 4QFY2010 Result Update
Exhibit 1: 4QFY2010 Performance
Y/E March (Rs cr) 4QFY10 3QFY10 % chg (qoq) 4QFY09 % chg (yoy) FY10 FY09 % chg
Interest Earned 665 626 6.1 566 17.4 2,361 2,003 17.8
Interest Expenses 420 415 1.2 411 2.3 1,582 1,492 6.0
Net Interest Income 244 211 15.8 155 57.3 779 511 52.3
Non-Interest Income 160 127.8 25.3 90 78.4 585 469 24.7
Total Income 404 339 19.4 245 65.0 1,363 980 39.1
Operating Expenses 147 123 19.7 91 61.2 500 419 19.5
Pre-Prov. Profit 258 216 19.2 154 67.3 863 562 53.7
Provisions & Cont. 43 25.38 67.7 32 32.2 137 96 43.1
PBT 215 191 12.7 122 76.6 726 466 55.9
Prov. for Taxes 75 65 15.6 42 80.1 249 162 53.5
PAT 140 126 11.2 80 74.8 478 304 57.2
EPS (Rs) 4.1 4.2 (2.2) 2.7 53.7 14.1 10.2 38.3
Cost to Income (%) 36.3 36.2 37.2 36.7 42.7
Effective Tax Rate (%) 34.9 34.0 34.2 34.2 34.8
Net NPA (%) 0.1 0.1 0.3 0.1 0.3
Source: Company, Angel Research
Strong Business Growth Continues
The bank registered a substantial sequential surge in both loans and deposits, with
loans growing 18.6% qoq (78.9% yoy) to Rs22,193cr and deposits growing 21.6%
qoq (65.7% yoy) to Rs26,799cr. CASA deposits also recorded a similar surge, and
the CASA ratio stood at 10.5% (10.1% in 3QFY2010). The growth on the asset-side
was mainly driven by sectors such as infrastructure (Power, Oil, Gas), Engineering,
Telecom, and also by the year-end advances to the priority sector.
Exhibit 2: Advances Break-up as on 4QFY2010
Branch Banking
5%
Commercial
Banking
26%
Corp & Insti
Banking
69%
Source: Company, Angel Research
Strong Net Interest Income growth
The NII of the bank registered a growth of 57.3% yoy and 15.7% qoq to Rs244cr in
4QFY2010. The reported NIMs of the bank improved by 10bp sequentially to 3.2%
in 4QFY2010, on the back of the benefit of Rs1,034cr through a QIP in January
2010. The cost of funds of the bank reduced from 6.6% in 3QFY2010 to 6.3% in
4QFY2010.
April 29, 2010 2
3. Yes Bank I 4QFY2010 Result Update
Exhibit 3: Trend in Quarterly Reported NIMs
%
4.0
3.5
3.0
2.5
2.0
4QFY2008
1QFY2009
2QFY2009
3QFY2009
4QFY2009
1QFY2010
2QFY2010
3QFY2010
4QFY2010
Source: Company, Angel Research
Asset-quality healthy, in a cyclical context
The Gross NPA ratio was at 0.3%, while the Net NPA ratio was at 0.1%, as at
4QFY2010 (as against 0.7% and 0.3%, respectively, as at 4QFY2009). The bank’s
restructured advances declined by Rs54cr during the quarter, taking the total
restructured advances to Rs80cr at the end of 4QFY2010, and constituted 0.4% of
the Advances. In our opinion, the present level of gross NPAs is significantly lower
than the sectoral averages relative to the Bank’s high-yield credit portfolio.
Accordingly, from a structural point-of-view, we believe that asset-quality
deterioration remains a risk for the bank.
Strong Non-interest Income
Non-interest income increased by 78.4% yoy to reach Rs160.1cr in 4QFY2010
(25.3% qoq). The financial market income witnessed strong traction, and grew by
69.3% qoq and 42.8% yoy to Rs47cr. Income from transaction banking also
increased by a strong 16.4% qoq and 71.4% yoy to Rs43cr. The non-interest income
to average Assets stood at a healthy level of 2.0% in FY2010.
Exhibit 4: Trend in Non-Interest Income Mix
Rs cr
250
200
150
100
50
-
4QFY08
1QFY09
2QFY09
3QFY09
4QFY09
1QFY10
2QFY10
3QFY10
4QFY10
Financial markets Financial advisory Transaction banking Retail, Others
Source: Company, Angel Research
Operating Expenses under control, but muted branch expansion
Operating expenses increased by 61.2% yoy and 19.7% qoq, to reach Rs147cr.
However, the operating income of the bank grew at a much faster rate of 65% yoy
which was reflected in an improvement in the cost-to-income ratio to 36.3% (37.2%
in 4QFY2009). During the quarter, the bank opened 18 branches, taking the total
network to 150. The bank plans to open 70 branches in FY2011E.
April 29, 2010 3
4. Yes Bank I 4QFY2010 Result Update
We believe that building CASA deposits is a key challenge for the Bank, the lack of
which renders the bank at a cost disadvantage to larger banks, and is exacerbated
by regulatory reserve requirements. Branch expansion plans, a key driver for CASA
growth, have fallen behind schedule several times. Even otherwise, the
management’s CASA target of 25% by FY2012E (50% CAGR in CASA) appears
difficult to achieve.
Exhibit 5: Trend in Branch Expansion
Nos
170.0
150
150.0
132
123 126
130.0 117
109
110.0 101
90.0 80
67
70.0
50.0
4QFY08
1QFY09
2QFY09
3QFY09
4QFY09
1QFY10
2QFY10
3QFY10
4QFY10
Source: Company, Angel Research
Strong Capital Adequacy
The Capital Adequacy Ratio (CAR) of the bank has improved to 20.6%, with Tier-I
capital of 12.9%, which increased from 9.0% in 3QFY2010, on the back of
Rs1,034cr of equity capital raised in January 2010. The bank also raised Rs82cr of
Hybrid Tier-I debt and Rs300cr of Subordinated Lower Tier-II debt during the
quarter.
Outlook and Valuation
The bank’s high NIMs are a function of a higher yield on advances, while, at the
same time, the provisioning costs have been lower than the sectoral average. Hence,
we believe that asset-quality deterioration remains a significant risk for the bank.
Moreover, as the interest rate rises, the cost of funds for the bank is expected to rise
at a faster rate, due to the wholesale-based funding mix of the bank.
Accordingly, we expect a lower Net Profit growth of 13.4% yoy in FY2011E and 13.2
yoy in FY2012E as compared to 61.8% growth in FY2010. Moreover, due to equity
dilution, the RoE of the bank is expected to decline to 15.3% in FY2012E from 20.2%
for FY2010.
At the CMP, the stock is trading at expensive valuations of 15.7x FY2012E EPS of
Rs18.7 and 2.2x FY2012E ABV of Rs131.6. We believe that this leaves little margin of
safety, in light of structural downside in RoAs. Moreover, as the experience of the past
several quarters has shown, in spite of the management’s high pedigree, the inherent
challenges of building a retail franchise are substantial. In our view, there is a
relatively high execution risk involved in the kind of growth that the current valuations
imply, especially with respect to the Bank’s Retail business. We remain Neutral on the
stock.
April 29, 2010 4
5. Yes Bank I 4QFY2010 Result Update
Exhibit 6: P/ABV Band – Yes Bank
Rs
600
500
400
300
200
100
0
Jul-05
Oct-05
Jan-06
Apr-06
Jul-06
Oct-06
Jan-07
Apr-07
Jul-07
Oct-07
Jan-08
Apr-08
Jul-08
Oct-08
Jan-09
Apr-09
Jul-09
Oct-09
Jan-10
Apr-10
Price 0.5x 1.5x 2.5x 3.5x 4.5x
Source: Company, Angel Research
April 29, 2010 5
7. Yes Bank I 4QFY2010 Result Update
Research Team Tel: 022-4040 3800 E-mail: research@angeltrade.com Website: www.angeltrade.com
DISCLAIMER
This document is solely for the personal information of the recipient, and must not be singularly used as the basis of any investment decision. Nothing in this
document should be construed as investment or financial advice. Each recipient of this document should make such investigations as they deem necessary to
arrive at an independent evaluation of an investment in the securities of the companies referred to in this document (including the merits and risks involved),
and should consult their own advisors to determine the merits and risks of such an investment.
Angel Securities Limited, its affiliates, directors, its proprietary trading and investment businesses may, from time to time, make investment decisions that are
inconsistent with or contradictory to the recommendations expressed herein. The views contained in this document are those of the analyst, and the company
may or may not subscribe to all the views expressed within.
Reports based on technical and derivative analysis center on studying charts of a stock's price movement, outstanding positions and trading volume, as
opposed to focusing on a company's fundamentals and, as such, may not match with a report on a company's fundamentals.
The information in this document has been printed on the basis of publicly available information, internal data and other reliable sources believed to be true,
and are for general guidance only. Angel Securities Limited has not independently verified all the information contained within this document. Accordingly,
we cannot testify, nor make any representation or warranty, express or implied, to the accuracy, contents or data contained within this document. While Angel
Securities Limited endeavours to update on a reasonable basis the information discussed in this material, there may be regulatory, compliance, or other
reasons that prevent us from doing so.
This document is being supplied to you solely for your information, and its contents, information or data may not be reproduced, redistributed or passed on,
directly or indirectly.
Angel Securities Limited and its affiliates may seek to provide or have engaged in providing corporate finance, investment banking or other advisory services
in a merger or specific transaction to the companies referred to in this report, as on the date of this report or in the past.
Neither Angel Securities Limited nor its directors, employees and affiliates shall be liable for any loss or damage that may arise from or in connection with the
use of this information.
Note: Please refer to the important `Stock Holding Disclosure' report on the Angel website (Research Section).
Disclosure of Interest Statement Yes Bank
1. Analyst ownership of the stock No
2. Angel and its Group companies ownership of the stock No
3. Angel and its Group companies’ Directors ownership of the stock No
4. Broking relationship with company covered No
Note: We have not considered any Exposure below Rs 1 lakh for Angel and its Group companies.
Address: Acme Plaza, ‘A’ Wing, 3rd Floor, M.V. Road, Opp. Sangam Cinema, Andheri (E), Mumbai - 400 059.
Tel : (022) 3952 4568 / 4040 3800
Angel Broking Ltd: BSE Sebi Regn No : INB 010996539 / CDSL Regn No: IN - DP - CDSL - 234 - 2004 / PMS Regn Code: PM/INP000001546 Angel Securities Ltd:BSE: INB010994639/INF010994639 NSE:
INB230994635/INF230994635 Membership numbers: BSE 028/NSE:09946
Angel Capital & Debt Market Ltd: INB 231279838 / NSE FNO: INF 231279838 / NSE Member code -12798 Angel Commodities Broking (P) Ltd: MCX Member ID: 12685 / FMC Regn No: MCX / TCM /
CORP / 0037 NCDEX : Member ID 00220 / FMC Regn No: NCDEX / TCM / CORP / 0302
April 29, 2010 7