VIP Kolkata Call Girl Serampore 👉 8250192130 Available With Room
ACC Result Update
1. 2QCY2010 Result Update | Cement
July 23 2010
ACC NEUTRAL
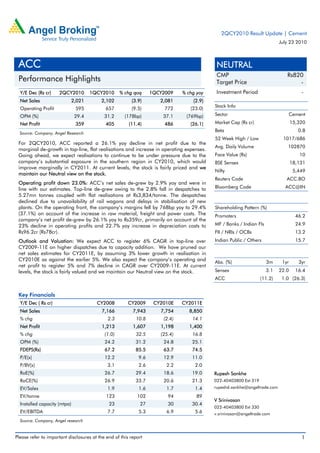
CMP Rs820
Performance Highlights Target Price -
Y/E Dec (Rs cr) 2QCY2010 1QCY2010 % chg qoq 1QCY2009 % chg yoy Investment Period -
Net Sales 2,021 2,102 (3.9) 2,081 (2.9)
Stock Info
Operating Profit 595 657 (9.5) 772 (23.0)
OPM (%) 29.4 31.2 (178bp) 37.1 (769bp) Sector Cement
Net Profit 359 405 (11.4) 486 (26.1) Market Cap (Rs cr) 15,320
Beta 0.8
Source: Company, Angel Research
52 Week High / Low 1017/686
For 2QCY2010, ACC reported a 26.1% yoy decline in net profit due to the
Avg. Daily Volume 102870
marginal de-growth in top-line, flat realisations and increase in operating expenses.
Going ahead, we expect realisations to continue to be under pressure due to the Face Value (Rs) 10
company’s substantial exposure in the southern region in CY2010, which would BSE Sensex 18,131
improve marginally in CY2011. At current levels, the stock is fairly priced and we
Nifty 5,449
maintain our Neutral view on the stock.
Reuters Code ACC.BO
Operating profit down 23.0%: ACC’s net sales de-grew by 2.9% yoy and were in
line with our estimates. Top-line de-grew owing to the 2.8% fall in despatches to Bloomberg Code ACC@IN
5.27mn tonnes coupled with flat realisations at Rs3,834/tonne. The despatches
declined due to unavailability of rail wagons and delays in stabilisation of new
plants. On the operating front, the company’s margins fell by 768bp yoy to 29.4% Shareholding Pattern (%)
(37.1%) on account of the increase in raw material, freight and power costs. The Promoters 46.2
company’s net profit de-grew by 26.1% yoy to Rs359cr, primarily on account of the
23% decline in operating profits and 22.7% yoy increase in depreciation costs to MF / Banks / Indian Fls 24.9
Rs96.2cr (Rs78cr). FII / NRIs / OCBs 13.2
Outlook and Valuation: We expect ACC to register 6% CAGR in top-line over Indian Public / Others 15.7
CY2009-11E on higher dispatches due to capacity addition. We have pruned our
net sales estimates for CY2011E, by assuming 3% lower growth in realisation in
CY2010E as against the earlier 5%. We also expect the company’s operating and Abs. (%) 3m 1yr 3yr
net profit to register 5% and 7% decline in CAGR over CY2009-11E. At current
levels, the stock is fairly valued and we maintain our Neutral view on the stock. Sensex 3.1 22.0 16.4
ACC (11.2) 1.0 (26.3)
Key Financials
Y/E Dec ( Rs cr) CY2008 CY2009 CY2010E CY2011E
Net Sales 7,166 7,943 7,754 8,850
% chg 2.3 10.8 (2.4) 14.1
Net Profit 1,213 1,607 1,198 1,400
% chg (1.0) 32.5 (25.4) 16.8
OPM (%) 24.2 31.2 24.8 25.1
FDEPS(Rs) 67.2 85.5 63.7 74.5
P/E(x) 12.2 9.6 12.9 11.0
P/BV(x) 3.1 2.6 2.2 2.0
RoE(%) 26.7 29.4 18.6 19.0 Rupesh Sankhe
RoCE(%) 26.9 33.7 20.6 21.3 022-40403800 Ext 319
EV/Sales 1.9 1.6 1.7 1.4 rupeshd.sankhe@angeltrade.com
EV/tonne 123 102 94 89
V Srinivasan
Installed capacity (mtpa) 23 27 30 30.4
022-40403800 Ext 330
EV/EBITDA 7.7 5.3 6.9 5.6 v.srinivasan@angeltrade.com
Source: Company, Angel research
Please refer to important disclosures at the end of this report 1
3. ACC| 2QCY2010 Result Update
Exhibit 3: 2QCY10 Angel Estimates v/s Actual
Actual Estimates Variation (%)
Net Sales 2,021 2,051 (1.5)
Operating Profit 595 623 (4.5)
Net Profit 359 377 (4.8)
Source: Company, Angel Research
Operational highlights
For 2QCY2010, the company’s realisation per tonne remained flat on a yoy basis
at Rs3,834. However, the raw material costs per tonne grew by 9.5% yoy. The
freight costs per tonne rose by 9.0% yoy due the increase in diesel costs.
Depreciation cost too increased by 26.1% yoy following increase in capacity. The
operating profit per tonne stood at Rs1,128, down 24.2% yoy. Net profit per tonne
for the quarter stood at Rs681, down 24% yoy.
Exhibit 4: Operational performance
yoy qoq
Parameter (Rs) 2QCY10 1QCY10 2QCY09
chg(%) chg (%)
Realisation/tonne 3,834 3,767 3,840 (0.1) 1.8
Raw Material Cost/tonne 501 550 458 9.5 (8.8)
Power & Fuel Cost /tonne 746 703 690 8.2 6.1
Freight & Forwarding
512 493 470 9.0 3.9
Cost/tonne
Operating Profit/tonne 1,128 1,177 1,489 (24.2) (4.1)
Depreciation/tonne 182 168 145 26.1 8.9
Net Profit/tonne 681 726 896 (24.0) (6.2)
Source: Company, Angel Research
3mt expansion project to be commissioned shortly
Work at the 3mtpa clinkering plant in Chanda, along with the 25MW captive
power plant is on track and is expected to be commissioned in 3QCY2010. Post
these capacity additions, the company’s cement capacity will increase to
30.0mtpa, while its captive power capacity (CPC) will increase to 346MW.
Exhibit 5: Installed capacity
40
30 30
30 27
22 23
mtpa
20
10
0
CY2007 CY2008 CY2009 CY2010E CY2011E
Source: Company, Angel Research
July 23 2010 3
4. ACC| 2QCY2010 Result Update
Investment Arguments
Growth to be driven by capacity addition: ACC’s despatches grew by a moderate
5% during CY2006-09 as against the industry growth rate in excess of 10%.
However, the company’s volumes are set to post a CAGR of 8.3% over
CY2009-11E as its capacity is set to expand from 26mtpa in CY2009 to 30mtpa in
CY2010. The company has already completed expansion at Bargarh taking total
capacity of the plant to 2.1mtpa. Apart from expanding capacities on its own, ACC
has also been increasing its capacity by acquiring stakes in smaller companies. In
line with this, the company had acquired 45% stake in Asian Cement while
acquiring 100% stake in Encore Cement. Asian Cement, which has a 0.3mn
tonnes grinding unit in HP, is adding another 1mn tonnes at the unit. Encore
Cement has a 0.2mt slag grinding unit at Vishakapatnam. ACC has a strong
balance sheet with healthy cash inflows and free cash flow over CY2009E-11E,
which will enable it to fund its next round of expansion through internal accruals.
Diversified geographical presence to negate ill-effects of poor regional demand-
supply dynamics: ACC is a pan-India player and hence is insulated to a large
extent from the risks of slow-down in demand and price collapse in any particular
region. The company’s brands are popular across the country. Going ahead, post
the proposed capacity expansions, the south, west, north, central and east regions
would contribute 23%, 22%, 19%, 18% and 16% respectively to the company’s
overall revenues. Thus, the company’s exposure to the southern region, which has
faced the highest price correction over the past several months due to excess
capacity and slowdown, is limited.
Increased use of captive power to improve operating margins: The use of captive
power has improved the company’s cost competitiveness and quality of power. The
share of captive power in the company’s overall power consumption has increased
to 70% in CY2009 from 64% in CY2008 and is set to increase to 75% in CY2010.
The company’s captive power capacity (CPC) is set to increase to 346MW by
CY2010. Over the years, ACC has improved its efficiency owing to which its power
consumption per tonne of cement has declined.
Outlook and Valuation
We expect ACC to register 6% CAGR in top-line over CY2009-11E, on account of
the increased dispatches due to capacity addition. We have pruned our estimates
of net sales for CY2011E, by assuming lower 3% growth in realisations in
CY2010E as against the earlier 5%. We also expect the company’s operating and
net profit to witness a decline of 5% and 7% CAGR respectively, over CY2009-11E.
At current levels, the stock is fairly valued and we maintain our Neutral view on the
stock.
July 23 2010 4
11. ACC| 2QCY2010 Result Update
Research Team Tel: 022 - 4040 3800 E-mail: research@angeltrade.com Website: www.angeltrade.com
DISCLAIMER
This document is solely for the personal information of the recipient, and must not be singularly used as the basis of any investment
decision. Nothing in this document should be construed as investment or financial advice. Each recipient of this document should make
such investigations as they deem necessary to arrive at an independent evaluation of an investment in the securities of the companies
referred to in this document (including the merits and risks involved), and should consult their own advisors to determine the merits and
risks of such an investment.
Angel Broking Limited, its affiliates, directors, its proprietary trading and investment businesses may, from time to time, make
investment decisions that are inconsistent with or contradictory to the recommendations expressed herein. The views contained in this
document are those of the analyst, and the company may or may not subscribe to all the views expressed within.
Reports based on technical and derivative analysis center on studying charts of a stock's price movement, outstanding positions and
trading volume, as opposed to focusing on a company's fundamentals and, as such, may not match with a report on a company's
fundamentals.
The information in this document has been printed on the basis of publicly available information, internal data and other reliable
sources believed to be true, but we do not represent that it is accurate or complete and it should not be relied on as such, as this
document is for general guidance only. Angel Broking Limited or any of its affiliates/ group companies shall not be in any way
responsible for any loss or damage that may arise to any person from any inadvertent error in the information contained in this report.
Angel Broking Limited has not independently verified all the information contained within this document. Accordingly, we cannot testify,
nor make any representation or warranty, express or implied, to the accuracy, contents or data contained within this document. While
Angel Broking Limited endeavours to update on a reasonable basis the information discussed in this material, there may be regulatory,
compliance, or other reasons that prevent us from doing so.
This document is being supplied to you solely for your information, and its contents, information or data may not be reproduced,
redistributed or passed on, directly or indirectly.
Angel Broking Limited and its affiliates may seek to provide or have engaged in providing corporate finance, investment banking or
other advisory services in a merger or specific transaction to the companies referred to in this report, as on the date of this report or in
the past.
Neither Angel Broking Limited, nor its directors, employees or affiliates shall be liable for any loss or damage that may arise from or in
connection with the use of this information.
Note: Please refer to the important `Stock Holding Disclosure' report on the Angel website (Research Section). Also, please
refer to the latest update on respective stocks for the disclosure status in respect of those stocks. Angel Broking Limited and
its affiliates may have investment positions in the stocks recommended in this report.
Disclosure of Interest Statement ACC
1. Analyst ownership of the stock No
2. Angel and its Group companies ownership of the stock No
3. Angel and its Group companies' Directors ownership of the stock No
4. Broking relationship with company covered No
Note: We have not considered any Exposure below Rs 1 lakh for Angel, its Group companies and Directors.
Ratings (Returns) : Buy (> 15%) Accumulate (5% to 15%) Neutral (-5 to 5%)
Reduce (-5% to 15%) Sell (< -15%)
July 23 2010 11