Interimreport1 January–31 March2024 Elo Mutual Pension Insurance Company
Derivatives Report - 12 October 2010
1. Derivative Report
India Research
Oct 12, 2010
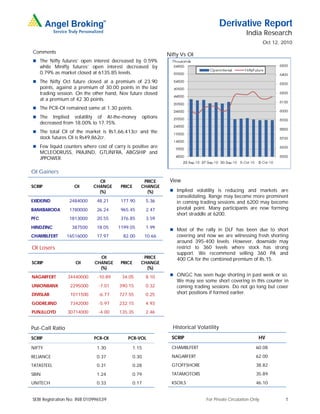
Comments
Nifty Vs OI
The Nifty futures’ open interest decreased by 0.59%
while Minifty futures’ open interest decreased by
0.79% as market closed at 6135.85 levels.
The Nifty Oct future closed at a premium of 23.90
points, against a premium of 30.00 points in the last
trading session. On the other hand, Nov future closed
at a premium of 42.30 points.
The PCR-OI remained same at 1.30 points.
The Implied volatility of At-the-money options
decreased from 18.00% to 17.75%.
The total OI of the market is Rs1,66,413cr and the
stock futures OI is Rs49,862cr.
Few liquid counters where cost of carry is positive are
MCLEODRUSS, PRAJIND, GTLINFRA, ABGSHIP and
JPPOWER.
OI Gainers
OI PRICE View
SCRIP OI CHANGE PRICE CHANGE
(%) (%) Implied volatility is reducing and markets are
consolidating. Range may become more prominent
EXIDEIND 2484000 48.21 177.90 5.36 in coming trading sessions and 6200 may become
BANKBARODA 1780000 26.24 965.45 2.47 pivotal point. Many participants are now forming
short straddle at 6200.
PFC 1813000 20.55 376.85 3.59
HINDZINC 387500 18.05 1199.05 1.99
Most of the rally in DLF has been due to short
CHAMBLFERT 16516000 17.97 82.00 10.66 covering and now we are witnessing fresh shorting
around 395-400 levels. However, downside may
OI Losers restrict to 360 levels where stock has strong
support. We recommend selling 360 PA and
OI PRICE 400 CA for the combined premium of Rs.15.
SCRIP OI CHANGE PRICE CHANGE
(%) (%)
NAGARFERT 34440000 -10.89 34.05 8.10 ONGC has seen huge shorting in past week or so.
We may see some short covering in this counter in
UNIONBANK 2295000 -7.01 390.15 0.32 coming trading sessions. Do not go long but cover
DIVISLAB 1011500 -6.77 727.55 0.25 short positions if formed earlier.
GODREJIND 7342000 -5.97 232.15 4.93
PUNJLLOYD 30714000 -4.00 135.35 2.46
Put-Call Ratio Historical Volatility
SCRIP PCR-OI PCR-VOL SCRIP HV
NIFTY 1.30 1.15 CHAMBLFERT 60.08
RELIANCE 0.37 0.30 NAGARFERT 62.00
TATASTEEL 0.31 0.28 GTOFFSHORE 38.82
SBIN 1.24 0.79 TATAMOTORS 35.89
UNITECH 0.33 0.17 KSOILS 46.10
SEBI Registration No: INB 010996539 For Private Circulation Only 1
2. Derivative Report | India Research
FII Statistics for 11-Oct-2010 Turnover on 11-Oct-2010
Open Interest
No. of Turnover Change
Detail Buy Sell Net Instrument
Contracts (Rs. in cr.) (%)
Contracts Value Change
(Rs. in cr.) (%)
INDEX Index Futures 327576 9589.23 -38.23
1108.50 896.33 212.17 517158 15932.91 -1.15
FUTURES
INDEX Stock Futures 550971 18473.14 -21.41
3254.55 3850.51 (595.96) 1974862 60587.92 -0.05
OPTIONS
STOCK Index Options 1380137 42514.71 -28.11
945.05 1542.18 (597.13) 1420871 43749.54 1.01
FUTURES
STOCK Stock Options 122939 4241.2 -20.58
397.56 466.86 (69.30) 31869 1051.49 10.37
OPTIONS
TOTAL 5705.67 6755.87 (1050.21) 3944760 121321.86 0.26 Total 2381623 74818.28 -27.72
Nifty Spot = 6135.85 Lot Size = 50
Bull-Call Spreads Bear-Put Spreads
Action Strike Price Risk Reward BEP Action Strike Price Risk Reward BEP
Buy 6200 72.95 Buy 6100 70.05
36.75 63.25 6236.75 27.35 72.65 6072.65
Sell 6300 36.20 Sell 6000 42.70
Buy 6200 72.95 Buy 6100 70.05
56.90 143.10 6256.90 44.85 155.15 6055.15
Sell 6400 16.05 Sell 5900 25.20
Buy 6300 36.20 Buy 6000 42.70
20.15 79.85 6320.15 17.50 82.50 5982.50
Sell 6400 16.05 Sell 5900 25.20
Note: Above mentioned Bullish or Bearish Spreads in Nifty (October Series) are given as an information and not as a recommendation
Nifty Put-Call Analysis
For Private Circulation Only SEBI Registration No: INB 010996539 2
3. Derivative Report | India Research
Strategy Date Scrip Strategy Status
04-Oct-10 JPASSOCIAT Bull Call Spread Continue
11-Oct-10 RELIANCE Long Call Continue
DISCLAIMER
This document is solely for the personal information of the recipient, and must not be singularly used as the basis of any investment
decision. Nothing in this document should be construed as investment or financial advice. Each recipient of this document should
make such investigations as they deem necessary to arrive at an independent evaluation of an investment in the securities of the
companies referred to in this document (including the merits and risks involved), and should consult their own advisors to determine
the merits and risks of such an investment.
Angel Broking Limited, its affiliates, directors, its proprietary trading and investment businesses may, from time to time, make
investment decisions that are inconsistent with or contradictory to the recommendations expressed herein. The views contained in this
document are those of the analyst, and the company may or may not subscribe to all the views expressed within.
Reports based on technical and derivative analysis center on studying charts of a stock's price movement, outstanding positions and
trading volume, as opposed to focusing on a company's fundamentals and, as such, may not match with a report on a company's
fundamentals.
The information in this document has been printed on the basis of publicly available information, internal data and other reliable
sources believed to be true, but we do not represent that it is accurate or complete and it should not be relied on as such, as this
document is for general guidance only. Angel Broking or any of its affiliates/ group companies shall not be in any way responsible
for any loss or damage that may arise to any person from any inadvertent error in the information contained in this report. Angel
Broking Limited has not independently verified all the information contained within this document. Accordingly, we cannot testify, nor
make any representation or warranty, express or implied, to the accuracy, contents or data contained within this document. While
Angel Broking Limited endeavours to update on a reasonable basis the information discussed in this material, there may be
regulatory, compliance, or other reasons that prevent us from doing so.
This document is being supplied to you solely for your information, and its contents, information or data may not be reproduced,
redistributed or passed on, directly or indirectly.
Angel Broking Limited and its affiliates may seek to provide or have engaged in providing corporate finance, investment banking or
other advisory services in a merger or specific transaction to the companies referred to in this report, as on the date of this report or
in the past.
Neither Angel Broking Limited, nor its directors, employees or affiliates shall be liable for any loss or damage that may arise from or
in connection with the use of this information.
Note: Please refer to the important `Stock Holding Disclosure' report on the Angel website (Research Section).
Derivative Research Team derivatives.desk@angeltrade.com
For Private Circulation Only SEBI Registration No: INB 010996539 3