Download to read offline

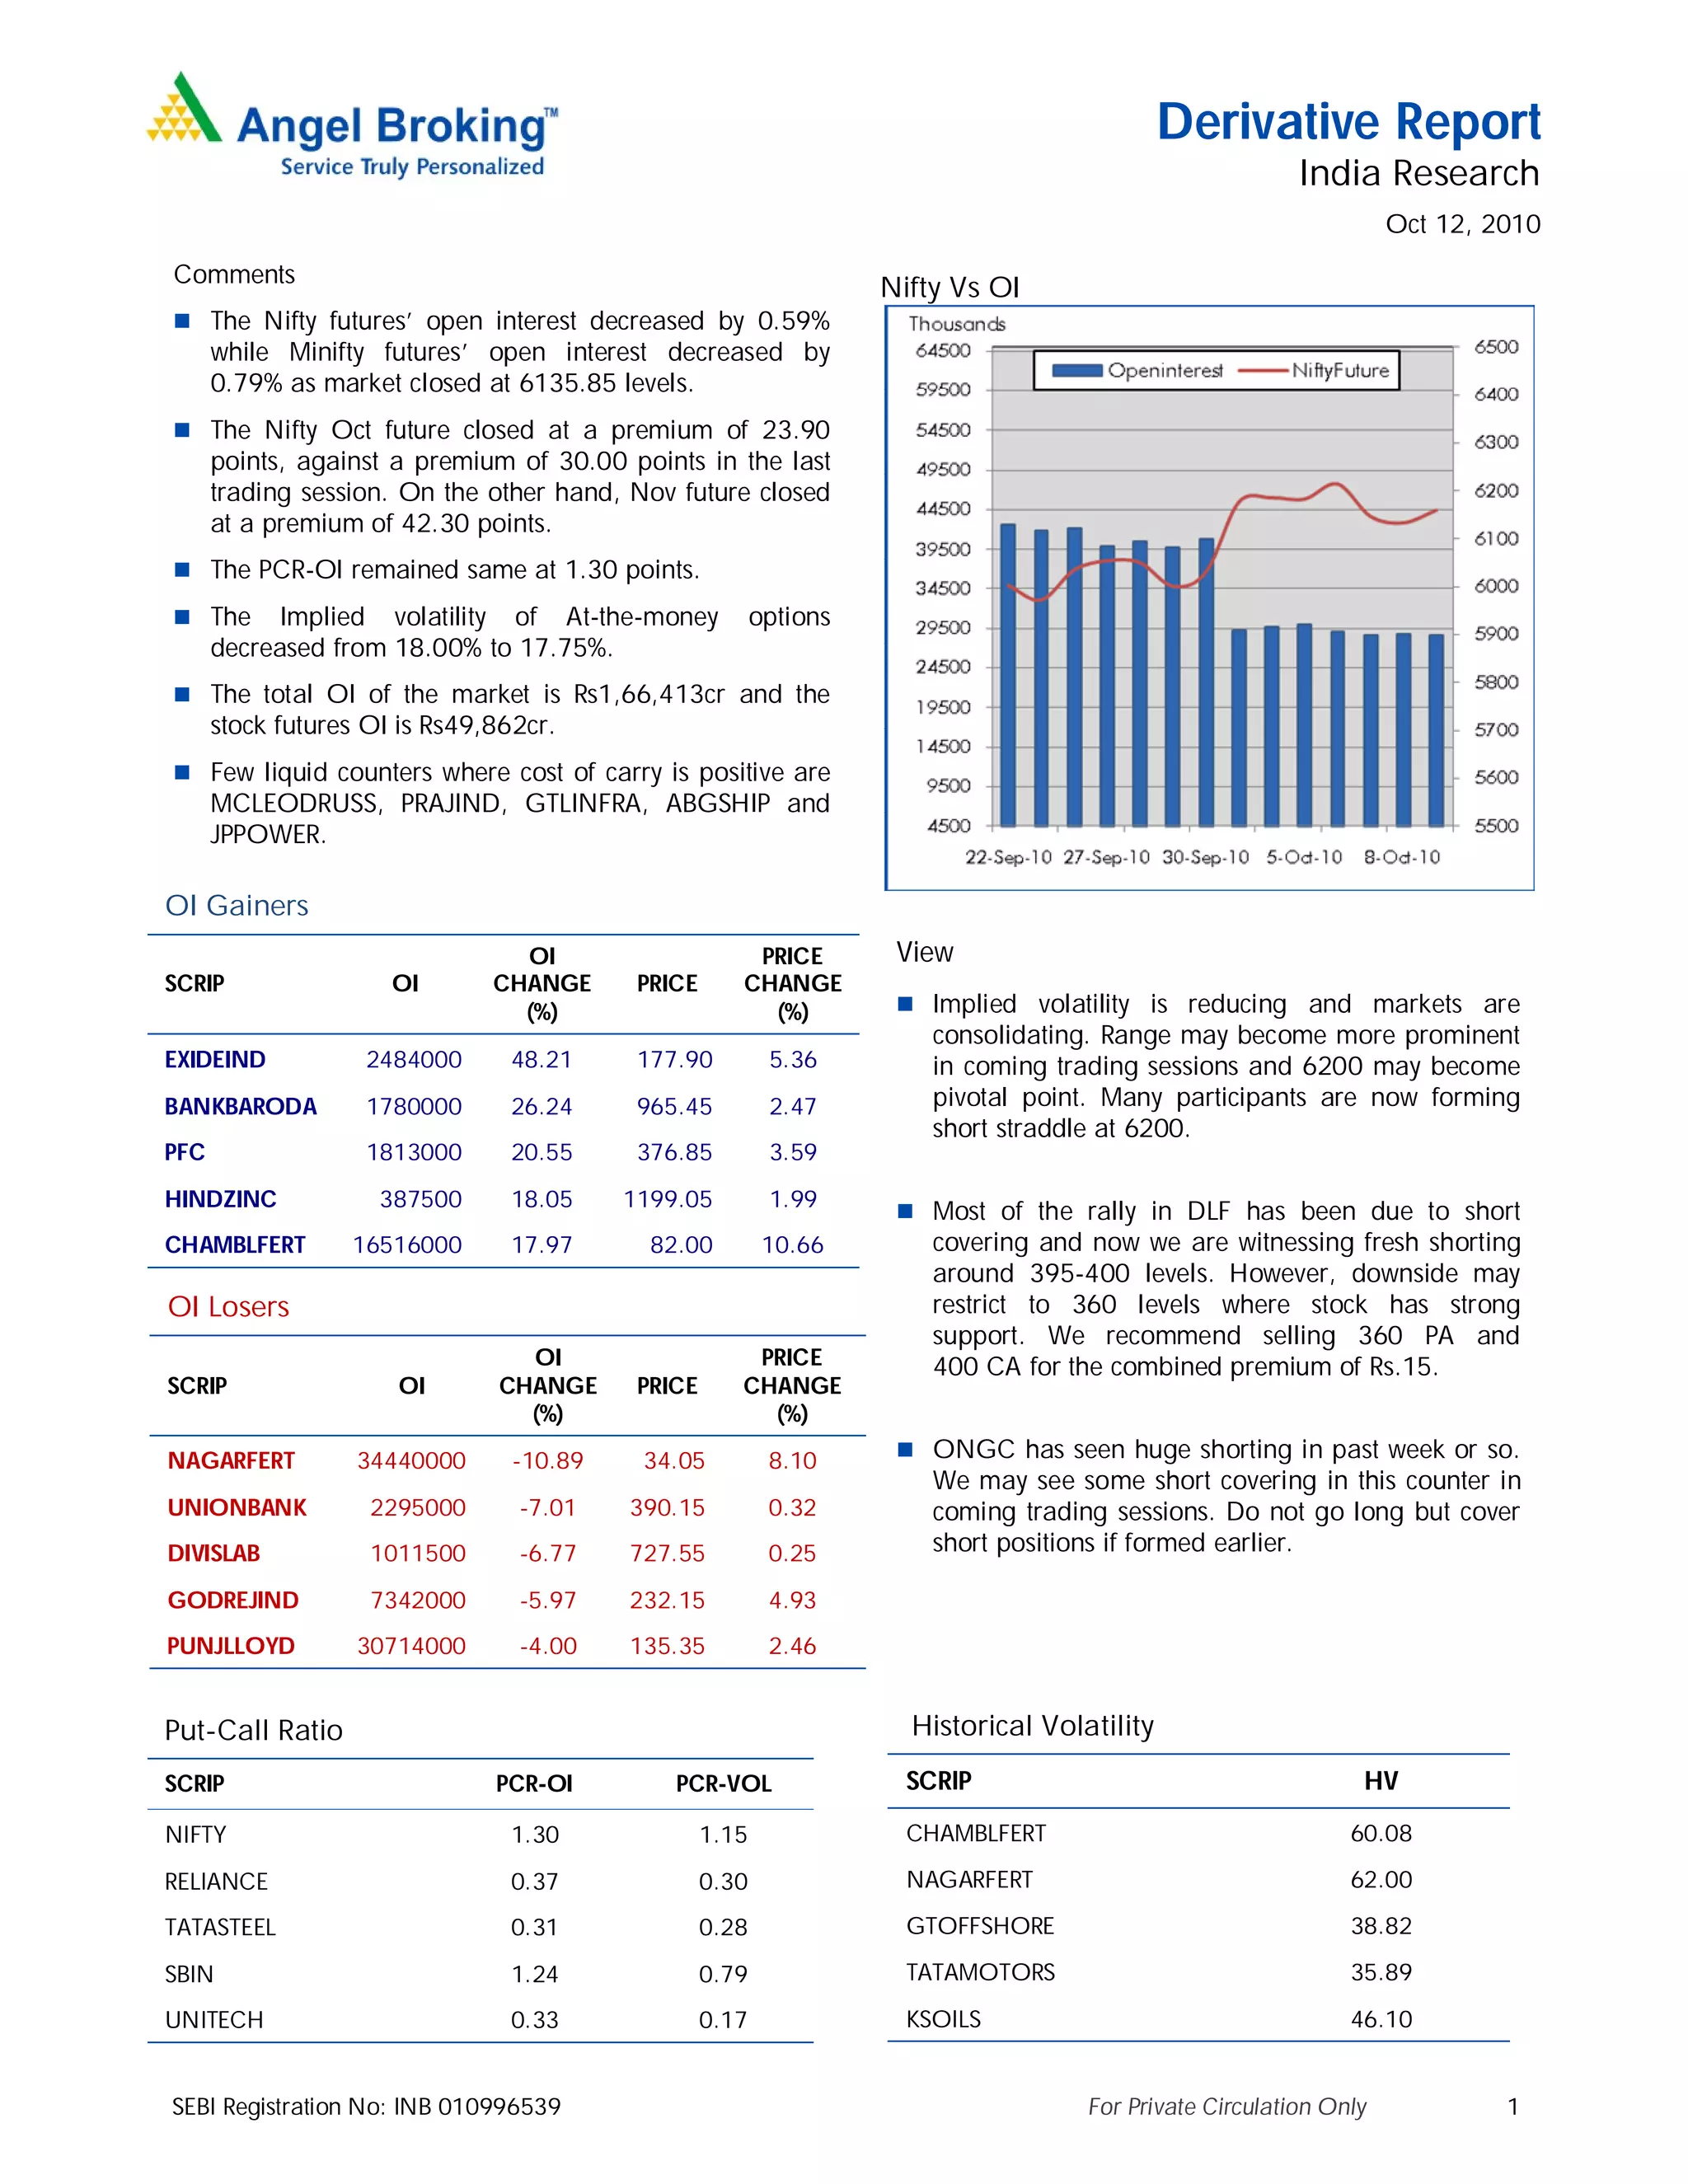
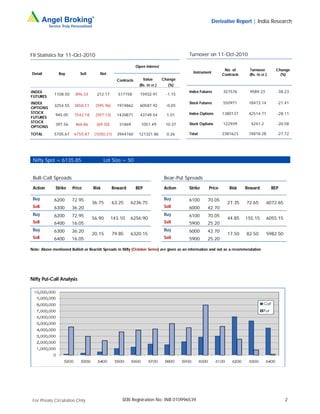

The document provides a summary of derivative trading activity in India for October 12, 2010. It notes that open interest for Nifty futures decreased slightly while implied volatility also decreased. Top gainers in open interest were Exideind, Bankbaroda, and PFC. Top losers were Nagarfirt, Unionbank, and Divislab. Put-call ratios remained low for stocks like Reliance and Tatasteel. Historical volatility was highest for Chamblfert and Nagarfirt. Bullish and bearish spread strategies are presented for the Nifty.


