1. Derivative Report
India Research
July 05, 2010
Comments
Nifty Vs OI
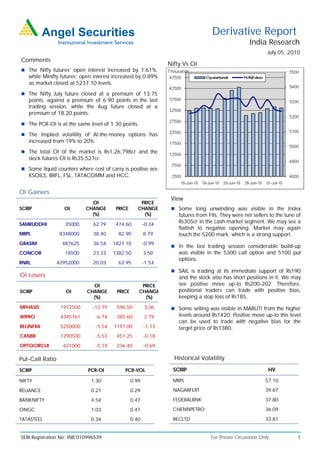
The Nifty futures’ open interest increased by 1.61%,
while Minifty futures’ open interest increased by 0.89%
as market closed at 5237.10 levels.
The Nifty July future closed at a premium of 13.75
points, against a premium of 6.90 points in the last
trading session, while the Aug future closed at a
premium of 18.20 points.
The PCR-OI is at the same level of 1.30 points.
The Implied volatility of At-the-money options has
increased from 19% to 20%.
The total OI of the market is Rs1,26,798cr and the
stock futures OI is Rs35,527cr.
Some liquid counters where cost of carry is positive are
KSOILS, BRFL, FSL, TATACOMM and HCC.
OI Gainers
View
OI PRICE
SCRIP OI CHANGE PRICE CHANGE Some long unwinding was visible in the Index
(%) (%) futures from FIIs. They were net sellers to the tune of
SAMRUDDHI 35000 62.79 474.60 -0.34
Rs305cr in the cash market segment. We may see a
flattish to negative opening. Market may again
MRPL 8348000 38.40 82.90 8.79 touch the 5200 mark, which is a strong support.
GRASIM 487625 36.54 1827.10 -0.99
In the last trading session considerable build-up
CONCOR 18500 23.33 1382.50 3.59 was visible in the 5300 call option and 5100 put
options.
RNRL 42952000 20.03 63.95 -1.54
SAIL is trading at its immediate support of Rs190
OI Losers and the stock also has short positions in it. We may
OI PRICE see positive move up-to Rs200-202. Therefore,
SCRIP OI CHANGE PRICE CHANGE positional traders can trade with positive bias,
(%) (%) keeping a stop loss of Rs185.
MPHASIS 1972500 -13.79 596.50 3.06 Some selling was visible in MARUTI from the higher
WIPRO 4345761 -6.74 385.60 2.79 levels around Rs1420. Positive move up-to this level
can be used to trade with negative bias for the
RELINFRA 5250000 -5.54 1197.00 -1.13 target price of Rs1380.
CANBK 1290500 -5.53 451.25 -0.18
OPTOCIRCUI 621000 -5.19 236.40 -0.69
Put-Call Ratio Historical Volatility
SCRIP PCR-OI PCR-VOL SCRIP HV
NIFTY 1.30 0.99 MRPL 57.10
RELIANCE 0.21 0.29 NAGARFERT 39.67
BANKNIFTY 4.54 0.47 FEDERALBNK 37.80
ONGC 1.03 0.47 CHENNPETRO 36.09
TATASTEEL 0.34 0.40 RECLTD 33.81
SEBI Registration No: INB 010996539 For Private Circulation Only 1
2. Derivative Report | India Research
FII Statistics for 02-July-2010 Turnover on 02-July-2010
Open Interest
No. of Turnover Change
Detail Buy Sell Net Instrument
Contracts (Rs. in cr.) (%)
Contracts Value Change
(Rs. in cr.) (%)
INDEX Index Futures 530003 12914.68 -21.66
1251.17 1714.09 (462.92) 697450 18184.79 -1.80
FUTURES
INDEX Stock Futures 494063 13996.70 -12.25
4572.65 4512.47 60.18 1725044 45129.44 1.84
OPTIONS
STOCK Index Options 1322800 35111.09 -13.76
773.39 891.90 (118.51) 1107532 28799.03 0.80
FUTURES
STOCK Stock Options 89049 2618.72 -9.29
111.14 104.71 6.43 43198 1198.23 4.31
OPTIONS
TOTAL 6708.35 7223.17 (514.82) 3573224 93311.48 0.82 Total 2435915 64641.19 -14.99
Nifty Spot = 5237.10 Lot Size = 50
Bull-Call Spreads Bear-Put Spreads
Action Strike Price Risk Reward BEP Action Strike Price Risk Reward BEP
Buy 5300 83.65 Buy 5200 93.10
42.40 57.60 5342.40 27.30 72.70 5172.70
Sell 5400 41.25 Sell 5100 65.80
Buy 5300 83.65 Buy 5200 93.10
67.60 132.40 5367.60 49.65 150.35 5150.35
Sell 5500 16.05 Sell 5000 43.45
Buy 5400 41.25 Buy 5100 65.80
25.20 74.80 5425.20 22.35 77.65 5077.65
Sell 5500 16.05 Sell 5000 43.45
Note: Above mentioned Bullish or Bearish Spreads in Nifty (July Series) are given as an information and not as a recommendation
Nifty Put-Call Analysis
For Private Circulation Only SEBI Registration No: INB 010996539 2
3. Derivative Report | India Research
Strategy Date Scrip Strategy Status
28-June-2010 Reliance Long Put Continue
DISCLAIMER:
This document is not for public distribution and has been furnished to you solely for your information and must not be reproduced or redistributed to any other person.
Persons into whose possession this document may come are required to observe these restrictions.
Opinion expressed is our current opinion as of the date appearing on this material only. While we endeavor to update on a reasonable basis the information discussed in
this material, there may be regulatory, compliance, or other reasons that prevent us from doing so. Prospective investors and others are cautioned that any forward-
looking statements are not predictions and may be subject to change without notice. Our proprietary trading and investment businesses may make investment decisions
that are inconsistent with the recommendations expressed herein.
The information in this document has been printed on the basis of publicly available information, internal data and other reliable sources believed to be true and are for
general guidance only. While every effort is made to ensure the accuracy and completeness of information contained, the company takes no guarantee and assumes no
liability for any errors or omissions of the information. No one can use the information as the basis for any claim, demand or cause of action.
Recipients of this material should rely on their own investigations and take their own professional advice. Each recipient of this document should make such investigations
as it deems necessary to arrive at an independent evaluation of an investment in the securities of companies referred to in this document (including the merits and risks
involved), and should consult their own advisors to determine the merits and risks of such an investment. Price and value of the investments referred to in this material may
go up or down. Past performance is not a guide for future performance.
Certain transactions - futures, options and other derivatives as well as non-investment grade securities - involve substantial risks and are not suitable for all investors.
Reports based on technical analysis centers on studying charts of a stock's price movement and trading volume, as opposed to focusing on a company's fundamentals and
as such, may not match with a report on a company's fundamentals.
We do not undertake to advise you as to any change of our views expressed in this document. While we would endeavor to update the information herein on a reasonable
basis, Angel Broking, its subsidiaries and associated companies, their directors and employees are under no obligation to update or keep the information current. Also
there may be regulatory, compliance, or other reasons that may prevent Angel Broking and affiliates from doing so. Prospective investors and others are cautioned that
any forward-looking statements are not predictions and may be subject to change without notice.
Angel Broking Limited and affiliates, including the analyst who has issued this report, may, on the date of this report, and from time to time, have long or short positions
in, and buy or sell the securities of the companies mentioned herein or engage in any other transaction involving such securities and earn brokerage or compensation or
act as advisor or have other potential conflict of interest with respect to company/ies mentioned herein or inconsistent with any recommendation and related information
and opinions.
Angel Broking Limited and affiliates may seek to provide or have engaged in providing corporate finance, investment banking or other advisory services in a merger or
specific transaction to the companies referred to in this report, as on the date of this report or in the past.
Sebi Registration No.: INB 010996539
Derivative Research Team derivatives.desk@angeltrade.com
For Private Circulation Only SEBI Registration No: INB 010996539 3