1. Derivative Report
India Research
Sep 28, 2010
Comments
Nifty Vs OI
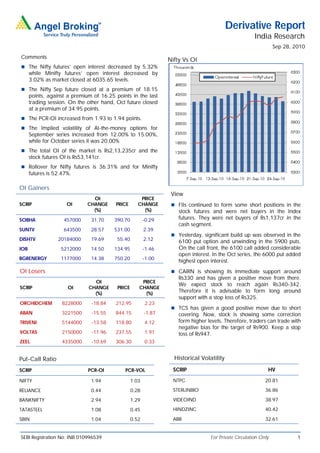
The Nifty futures’ open interest decreased by 5.32%
while Minifty futures’ open interest decreased by
3.02% as market closed at 6035.65 levels.
The Nifty Sep future closed at a premium of 18.15
points, against a premium of 16.25 points in the last
trading session. On the other hand, Oct future closed
at a premium of 34.95 points.
The PCR-OI increased from 1.93 to 1.94 points.
The Implied volatility of At-the-money options for
September series increased from 12.00% to 15.00%,
while for October series it was 20.00%
The total OI of the market is Rs2,13,235cr and the
stock futures OI is Rs53,141cr.
Rollover for Nifty futures is 36.31% and for Minifty
futures is 52.47%.
OI Gainers
View
OI PRICE
SCRIP OI CHANGE PRICE CHANGE FIIs continued to form some short positions in the
(%) (%) stock futures and were net buyers in the Index
SOBHA 457000 31.70 390.70 -0.29 futures. They were net buyers of Rs1,137cr in the
cash segment.
SUNTV 643500 28.57 531.00 2.39
Yesterday, significant build up was observed in the
DISHTV 20184000 19.69 55.40 2.12 6100 put option and unwinding in the 5900 puts.
IOB 5212000 14.50 134.95 -1.46 On the call front, the 6100 call added considerable
open interest. In the Oct series, the 6000 put added
BGRENERGY 1177000 14.38 750.20 -1.00
highest open interest.
OI Losers CAIRN is showing its immediate support around
Rs330 and has given a positive move from there.
OI PRICE
We expect stock to reach again Rs340-342.
SCRIP OI CHANGE PRICE CHANGE
(%) (%)
Therefore it is advisable to form long around
support with a stop loss of Rs325.
ORCHIDCHEM 8228000 -18.84 212.95 2.23
TCS has given a good positive move due to short
ABAN 3221500 -15.55 844.15 -1.87 covering. Now, stock is showing some correction
TRIVENI 5144000 -13.58 118.80 4.12 form higher levels. Therefore, traders can trade with
negative bias for the target of Rs900. Keep a stop
VOLTAS 2150000 -11.96 237.55 1.91 loss of Rs947.
ZEEL 4335000 -10.69 306.30 0.33
Put-Call Ratio Historical Volatility
SCRIP PCR-OI PCR-VOL SCRIP HV
NIFTY 1.94 1.03 NTPC 20.81
RELIANCE 0.44 0.28 STERLINBIO 36.86
BANKNIFTY 2.94 1.29 VIDEOIND 38.97
TATASTEEL 1.08 0.45 HINDZINC 40.42
SBIN 1.04 0.52 ABB 32.61
SEBI Registration No: INB 010996539 For Private Circulation Only 1
2. Derivative Report | India Research
FII Statistics for 27-Sep-2010 Turnover on 27-Sep-2010
Open Interest
No. of Turnover Change
Detail Buy Sell Net Instrument
Contracts (Rs. in cr.) (%)
Contracts Value Change
(Rs. in cr.) (%)
INDEX Index Futures 654233 19136.24 -1.54
6151.58 5883.34 268.24 736716 22307.25 -8.68
FUTURES
INDEX Stock Futures 1116145 35232.01 13.95
5657.16 5975.05 (317.89) 2964024 89454.26 0.10
OPTIONS
STOCK Index Options 2669137 80382.35 -10.42
6657.88 6920.07 (262.18) 1419151 42568.94 1.01
FUTURES
STOCK Stock Options 162435 5500.02 9.31
676.64 710.90 (34.27) 52239 1644.86 -0.94
OPTIONS
TOTAL 19143.26 19489.36 (346.10) 5172130 155975.31 -1.02 Total 4601950 140250.62 -3.36
Nifty Spot = 6035.65 Lot Size = 50
Bull-Call Spreads Bear-Put Spreads
Action Strike Price Risk Reward BEP Action Strike Price Risk Reward BEP
Buy 6100 16.50 Buy 6000 14.85
13.35 86.65 6113.35 10.25 89.75 5989.75
Sell 6200 3.15 Sell 5900 4.60
Buy 6100 16.50 Buy 6000 14.85
15.45 184.55 6115.45 12.65 187.35 5987.35
Sell 6300 1.05 Sell 5800 2.20
Buy 6200 3.15 Buy 5900 4.60
2.10 97.90 6202.10 2.40 97.60 5897.60
Sell 6300 1.05 Sell 5800 2.20
Note: Above mentioned Bullish or Bearish Spreads in Nifty (September Series) are given as an information and not as a recommendation
Nifty Put-Call Analysis
For Private Circulation Only SEBI Registration No: INB 010996539 2
3. Derivative Report | India Research
Strategy Date Scrip Strategy Status
30-Aug-10 RELINFRA Long Call Ladder Continue
06-Sep-10 BHARTIARTL Ratio Put Spread Continue
13-Sep-10 HINDUNILVR Call Hedge Continue
13-Sep-10 NIFTY Long Put Continue
20-Sep-10 RPOWER Ratio Bull Call Spread Continue
20-Sep-10 IFCI Ratio Bull Call Spread Continue
27-Sep-10 RELIANCE Long Call Continue
DISCLAIMER
This document is solely for the personal information of the recipient, and must not be singularly used as the basis of any investment
decision. Nothing in this document should be construed as investment or financial advice. Each recipient of this document should
make such investigations as they deem necessary to arrive at an independent evaluation of an investment in the securities of the
companies referred to in this document (including the merits and risks involved), and should consult their own advisors to determine
the merits and risks of such an investment.
Angel Broking Limited, its affiliates, directors, its proprietary trading and investment businesses may, from time to time, make
investment decisions that are inconsistent with or contradictory to the recommendations expressed herein. The views contained in this
document are those of the analyst, and the company may or may not subscribe to all the views expressed within.
Reports based on technical and derivative analysis center on studying charts of a stock's price movement, outstanding positions and
trading volume, as opposed to focusing on a company's fundamentals and, as such, may not match with a report on a company's
fundamentals.
The information in this document has been printed on the basis of publicly available information, internal data and other reliable
sources believed to be true, but we do not represent that it is accurate or complete and it should not be relied on as such, as this
document is for general guidance only. Angel Broking or any of its affiliates/ group companies shall not be in any way responsible
for any loss or damage that may arise to any person from any inadvertent error in the information contained in this report. Angel
Broking Limited has not independently verified all the information contained within this document. Accordingly, we cannot testify, nor
make any representation or warranty, express or implied, to the accuracy, contents or data contained within this document. While
Angel Broking Limited endeavours to update on a reasonable basis the information discussed in this material, there may be
regulatory, compliance, or other reasons that prevent us from doing so.
This document is being supplied to you solely for your information, and its contents, information or data may not be reproduced,
redistributed or passed on, directly or indirectly.
Angel Broking Limited and its affiliates may seek to provide or have engaged in providing corporate finance, investment banking or
other advisory services in a merger or specific transaction to the companies referred to in this report, as on the date of this report or
in the past.
Neither Angel Broking Limited, nor its directors, employees or affiliates shall be liable for any loss or damage that may arise from or
in connection with the use of this information.
Note: Please refer to the important `Stock Holding Disclosure' report on the Angel website (Research Section).
Derivative Research Team derivatives.desk@angeltrade.com
For Private Circulation Only SEBI Registration No: INB 010996539 3