India Derivative Report March 25 2010
•
0 likes•102 views

The document provides a summary of India's derivative market activity for March 25, 2010. It notes that open interest for Nifty futures increased by 9.33% while open interest for Minifity futures decreased by 0.28%. Rollover levels for Nifty futures was 52% and for Minifity futures was 44%. The total open interest in the market was Rs1,35,077cr, with stock futures open interest being Rs36,003cr. Top gainers in open interest included MCLEODRUSS, AREVAT&D, and SIEMENS, while top losers included TATACHEM, CROMPGREAV, and LICHSGFIN.

Recommended
More Related Content
What's hot
What's hot (20)
Viewers also liked
Viewers also liked (18)
Similar to India Derivative Report March 25 2010
Similar to India Derivative Report March 25 2010 (17)
More from Angel Broking
More from Angel Broking (20)
Recently uploaded
Recently uploaded (20)
India Derivative Report March 25 2010
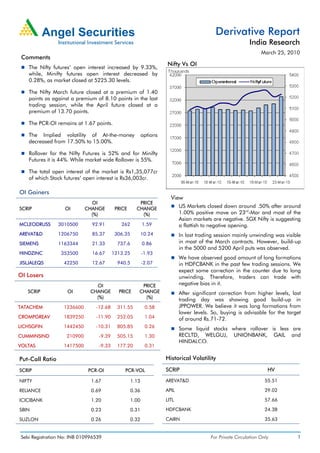
- 1. Derivative Report India Research March 25, 2010 Comments Nifty Vs OI The Nifty futures’ open interest increased by 9.33%, while, Minifty futures open interest decreased by 0.28%, as market closed at 5225.30 levels. The Nifty March future closed at a premium of 1.40 points as against a premium of 8.10 points in the last trading session, while the April future closed at a premium of 13.70 points. The PCR-OI remains at 1.67 points. The Implied volatility of At-the-money options decreased from 17.50% to 15.00%. Rollover for the Nifty Futures is 52% and for Minifty Futures it is 44%. While market wide Rollover is 55%. The total open interest of the market is Rs1,35,077cr of which Stock futures’ open interest is Rs36,003cr. OI Gainers View OI PRICE SCRIP OI CHANGE PRICE CHANGE US Markets closed down around .50% after around (%) (%) 1.00% positive move on 23rd-Mar and most of the Asian markets are negative. SGX Nifty is suggesting MCLEODRUSS 3010500 92.91 262 1.59 a flattish to negative opening. AREVAT&D 1206750 85.37 306.35 10.24 In last trading session mainly unwinding was visible SIEMENS 1163344 21.33 737.6 0.86 in most of the March contracts. However, build-up in the 5000 and 5200 April puts was observed. HINDZINC 353500 16.67 1213.25 -1.93 We have observed good amount of long formations JISLJALEQS 42250 12.67 940.5 -2.07 in HDFCBANK in the past few trading sessions. We expect some correction in the counter due to long OI Losers unwinding. Therefore, traders can trade with OI PRICE negative bias in it. SCRIP OI CHANGE PRICE CHANGE After significant correction from higher levels, last (%) (%) trading day was showing good build-up in TATACHEM 1236600 -12.68 311.55 0.58 JPPOWER. We believe it was long formations from lower levels. So, buying is advisable for the target CROMPGREAV 1839250 -11.90 252.05 1.04 of around Rs.71-72. LICHSGFIN 1442450 -10.31 805.85 0.26 Some liquid stocks where rollover is less are CUMMINSIND 210900 -9.39 505.15 1.30 RECLTD, WELGUJ, UNIONBANK, GAIL and HINDALCO. VOLTAS 1417500 -9.33 177.20 0.31 Put-Call Ratio Historical Volatility SCRIP PCR-OI PCR-VOL SCRIP HV NIFTY 1.67 1.13 AREVAT&D 55.51 RELIANCE 0.69 0.36 APIL 29.02 ICICIBANK 1.20 1.00 LITL 57.66 SBIN 0.23 0.31 HDFCBANK 24.38 SUZLON 0.26 0.32 CAIRN 35.63 Sebi Registration No: INB 010996539 For Private Circulation Only 1
- 2. Derivative Report | India Research FII Statistics for 23-March-2010 Turnover on 23-March-2010 Open Interest No. of Turnover Change Detail Buy Sell Net Instrument Contracts (Rs. in cr.) (%) Contracts Value Change (Rs. in cr.) (%) INDEX Index Futures 829532 21560.02 10.40 6869.94 6291.40 578.54 608196 16143.28 22.17 FUTURES INDEX Stock Futures 1006392 34366.89 21.12 4539.01 4617.79 (78.78) 1747044 45776.78 1.82 OPTIONS STOCK Index Options 2290054 59793.25 15.78 8290.22 8391.74 (101.53) 881511 29008.32 0.17 FUTURES STOCK Stock Options 84203 2969.94 -0.43 103.08 109.86 (6.78) 26058 900.78 0.36 OPTIONS TOTAL 19802.24 19410.80 391.45 3262809 91829.16 4.59 Total 4210181 118690.10 15.76 Nifty Spot = 5225.30 Lot Size = 50 Bull-Call Spreads Bear-Put Spreads Action Strike Price Risk Reward BEP Action Strike Price Risk Reward BEP Buy 5200 134.40 Buy 5100 28.90 52.70 47.30 5252.70 10.45 89.55 5089.55 Sell 5300 81.70 Sell 5000 18.45 Buy 5200 134.40 Buy 5100 28.90 89.45 110.55 5289.45 16.45 183.55 5083.55 Sell 5400 44.95 Sell 4900 12.45 Buy 5300 81.70 Buy 5000 18.45 36.75 63.25 5336.75 6.00 94.00 4994.00 Sell 5400 44.95 Sell 4900 12.45 Note: Above mentioned Bullish or Bearish Spreads in Nifty (April Series) are given as an information and not as a recommendation Nifty Put-Call Analysis For Private Circulation Only Sebi Registration No: INB 010996539 2
- 3. Derivative Report | India Research Strategy Tracker Strategy Date Scrip Strategy Status 02-March-2010 RELIANCE Long Put Ladder Continue 08-March-2010 NIFTY Long Put Continue 08-March-2010 TTML Bull Call Spread Continue 15-March-2010 DLF Ratio Call Spread Continue 22-March-2010 ITC Short Straddle Continue DISCLAIMER: This document is not for public distribution and has been furnished to you solely for your information and must not be reproduced or redistributed to any other person. Persons into whose possession this document may come are required to observe these restrictions. Opinion expressed is our current opinion as of the date appearing on this material only. While we endeavor to update on a reasonable basis the information discussed in this material, there may be regulatory, compliance, or other reasons that prevent us from doing so. Prospective investors and others are cautioned that any forward- looking statements are not predictions and may be subject to change without notice. Our proprietary trading and investment businesses may make investment decisions that are inconsistent with the recommendations expressed herein. The information in this document has been printed on the basis of publicly available information, internal data and other reliable sources believed to be true and are for general guidance only. While every effort is made to ensure the accuracy and completeness of information contained, the company takes no guarantee and assumes no liability for any errors or omissions of the information. No one can use the information as the basis for any claim, demand or cause of action. Recipients of this material should rely on their own investigations and take their own professional advice. Each recipient of this document should make such investigations as it deems necessary to arrive at an independent evaluation of an investment in the securities of companies referred to in this document (including the merits and risks involved), and should consult their own advisors to determine the merits and risks of such an investment. Price and value of the investments referred to in this material may go up or down. Past performance is not a guide for future performance. Certain transactions - futures, options and other derivatives as well as non-investment grade securities - involve substantial risks and are not suitable for all investors. Reports based on technical analysis centers on studying charts of a stock's price movement and trading volume, as opposed to focusing on a company's fundamentals and as such, may not match with a report on a company's fundamentals. We do not undertake to advise you as to any change of our views expressed in this document. While we would endeavor to update the information herein on a reasonable basis, Angel Broking, its subsidiaries and associated companies, their directors and employees are under no obligation to update or keep the information current. Also there may be regulatory, compliance, or other reasons that may prevent Angel Broking and affiliates from doing so. Prospective investors and others are cautioned that any forward-looking statements are not predictions and may be subject to change without notice. Angel Broking Limited and affiliates, including the analyst who has issued this report, may, on the date of this report, and from time to time, have long or short positions in, and buy or sell the securities of the companies mentioned herein or engage in any other transaction involving such securities and earn brokerage or compensation or act as advisor or have other potential conflict of interest with respect to company/ies mentioned herein or inconsistent with any recommendation and related information and opinions. Angel Broking Limited and affiliates may seek to provide or have engaged in providing corporate finance, investment banking or other advisory services in a merger or specific transaction to the companies referred to in this report, as on the date of this report or in the past. Sebi Registration No.: INB 010996539 Derivative Research Team derivatives.desk@angeltrade.com For Private Circulation Only Sebi Registration No: INB 010996539 3