Vip Female Escorts Noida 9711199171 Greater Noida Escorts Service
Derivatives report 07 june-2010
1. Derivative Report
India Research
June 07, 2010
Comments
Nifty Vs OI
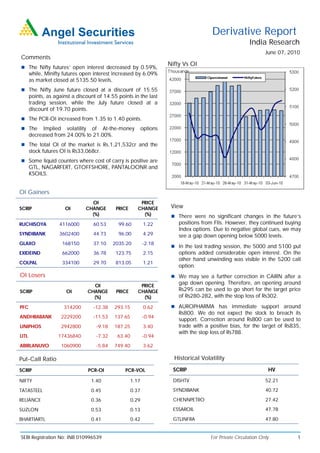
The Nifty futures’ open interest decreased by 0.59%,
while, Minifty futures open interest increased by 6.09%
as market closed at 5135.50 levels.
The Nifty June future closed at a discount of 15.55
points, as against a discount of 14.55 points in the last
trading session, while the July future closed at a
discount of 19.70 points.
The PCR-OI increased from 1.35 to 1.40 points.
The Implied volatility of At-the-money options
decreased from 24.00% to 21.00%.
The total OI of the market is Rs.1,21,532cr and the
stock futures OI is Rs33,068cr.
Some liquid counters where cost of carry is positive are
GTL, NAGARFERT, GTOFFSHORE, PANTALOONR and
KSOILS.
OI Gainers
OI PRICE
SCRIP OI CHANGE PRICE CHANGE View
(%) (%) There were no significant changes in the future’s
RUCHISOYA 4116000 60.53 99.60 1.22 positions from FIIs. However, they continued buying
Index options. Due to negative global cues, we may
SYNDIBANK 3602400 44.73 96.00 4.29 see a gap down opening below 5000 levels.
GLAXO 168150 37.10 2035.20 -2.18
In the last trading session, the 5000 and 5100 put
EXIDEIND 662000 36.78 123.75 2.15 options added considerable open interest. On the
other hand unwinding was visible in the 5200 call
COLPAL 334100 29.70 813.05 1.21
option.
OI Losers We may see a further correction in CAIRN after a
gap down opening. Therefore, an opening around
OI PRICE
SCRIP OI CHANGE PRICE CHANGE Rs295 can be used to go short for the target price
(%) (%) of Rs280-282, with the stop loss of Rs302.
PFC 314200 -12.38 293.15 0.62 AUROPHARMA has immediate support around
Rs800. We do not expect the stock to breach its
ANDHRABANK 2229200 -11.53 137.65 -0.94
support. Correction around Rs800 can be used to
UNIPHOS 2942800 -9.18 187.25 3.40 trade with a positive bias, for the target of Rs835,
with the stop loss of Rs788.
LITL 17436840 -7.32 63.40 -0.94
ABIRLANUVO 1060900 -5.84 749.40 3.62
Put-Call Ratio Historical Volatility
SCRIP PCR-OI PCR-VOL SCRIP HV
NIFTY 1.40 1.17 DISHTV 52.21
TATASTEEL 0.45 0.37 SYNDIBANK 40.72
RELIANCE 0.36 0.29 CHENNPETRO 27.42
SUZLON 0.53 0.13 ESSAROIL 47.78
BHARTIARTL 0.41 0.42 GTLINFRA 47.80
SEBI Registration No: INB 010996539 For Private Circulation Only 1
2. Derivative Report | India Research
FII Statistics for 04-June-2010 Turnover on 04-June-2010
Open Interest
No. of Turnover Change
Detail Buy Sell Net Instrument
Contracts (Rs. in cr.) (%)
Contracts Value Change
(Rs. in cr.) (%)
INDEX Index Futures 469312 11094.84 -22.56
1232.08 1095.99 136.10 510690 12996.22 -0.19
FUTURES
INDEX Stock Futures 448503 13652.13 -4.54
4950.41 3611.97 1,338.43 1762257 45236.82 1.75
OPTIONS
STOCK Index Options 1442523 36690.85 -19.85
1084.20 754.19 330.01 921935 26510.51 0.54
FUTURES
STOCK Stock Options 86630 2702.00 4.60
181.16 193.16 (12.01) 30491 966.87 8.42
OPTIONS
TOTAL 7447.85 5655.31 1,792.53 3225373 85710.41 1.15 Total 2446968 64139.82 -16.69
Nifty Spot = 5135.50 Lot Size = 50
Bull-Call Spreads Bear-Put Spreads
Action Strike Price Risk Reward BEP Action Strike Price Risk Reward BEP
Buy 5200 56.25 Buy 5100 88.75
32.60 67.40 5232.60 28.85 71.15 5071.15
Sell 5300 23.65 Sell 5000 59.90
Buy 5200 56.25 Buy 5100 88.75
47.95 152.05 5247.95 49.00 151.00 5051.00
Sell 5400 8.30 Sell 4900 39.75
Buy 5300 23.65 Buy 5000 59.90
15.35 84.65 5315.35 20.15 79.85 4979.85
Sell 5400 8.30 Sell 4900 39.75
Note: Above mentioned Bullish or Bearish Spreads in Nifty (June Series) are given as an information and not as a recommendation
Nifty Put-Call Analysis
For Private Circulation Only SEBI Registration No: INB 010996539 2
3. Derivative Report | India Research
Strategy Date Scrip Strategy Status
31-May-2010 Nifty Long Put Ladder Continue
DISCLAIMER:
This document is not for public distribution and has been furnished to you solely for your information and must not be reproduced or redistributed to any other person.
Persons into whose possession this document may come are required to observe these restrictions.
Opinion expressed is our current opinion as of the date appearing on this material only. While we endeavor to update on a reasonable basis the information discussed in
this material, there may be regulatory, compliance, or other reasons that prevent us from doing so. Prospective investors and others are cautioned that any forward-
looking statements are not predictions and may be subject to change without notice. Our proprietary trading and investment businesses may make investment decisions
that are inconsistent with the recommendations expressed herein.
The information in this document has been printed on the basis of publicly available information, internal data and other reliable sources believed to be true and are for
general guidance only. While every effort is made to ensure the accuracy and completeness of information contained, the company takes no guarantee and assumes no
liability for any errors or omissions of the information. No one can use the information as the basis for any claim, demand or cause of action.
Recipients of this material should rely on their own investigations and take their own professional advice. Each recipient of this document should make such investigations
as it deems necessary to arrive at an independent evaluation of an investment in the securities of companies referred to in this document (including the merits and risks
involved), and should consult their own advisors to determine the merits and risks of such an investment. Price and value of the investments referred to in this material may
go up or down. Past performance is not a guide for future performance.
Certain transactions - futures, options and other derivatives as well as non-investment grade securities - involve substantial risks and are not suitable for all investors.
Reports based on technical analysis centers on studying charts of a stock's price movement and trading volume, as opposed to focusing on a company's fundamentals and
as such, may not match with a report on a company's fundamentals.
We do not undertake to advise you as to any change of our views expressed in this document. While we would endeavor to update the information herein on a reasonable
basis, Angel Broking, its subsidiaries and associated companies, their directors and employees are under no obligation to update or keep the information current. Also
there may be regulatory, compliance, or other reasons that may prevent Angel Broking and affiliates from doing so. Prospective investors and others are cautioned that
any forward-looking statements are not predictions and may be subject to change without notice.
Angel Broking Limited and affiliates, including the analyst who has issued this report, may, on the date of this report, and from time to time, have long or short positions
in, and buy or sell the securities of the companies mentioned herein or engage in any other transaction involving such securities and earn brokerage or compensation or
act as advisor or have other potential conflict of interest with respect to company/ies mentioned herein or inconsistent with any recommendation and related information
and opinions.
Angel Broking Limited and affiliates may seek to provide or have engaged in providing corporate finance, investment banking or other advisory services in a merger or
specific transaction to the companies referred to in this report, as on the date of this report or in the past.
Sebi Registration No.: INB 010996539
Derivative Research Team derivatives.desk@angeltrade.com
For Private Circulation Only SEBI Registration No: INB 010996539 3