Vip Call US 📞 7738631006 ✅Call Girls In Sakinaka ( Mumbai )
Derivatives Report - August 31, 2010
1. Derivative Report
India Research
Aug 31, 2010
Comments
Nifty Vs OI
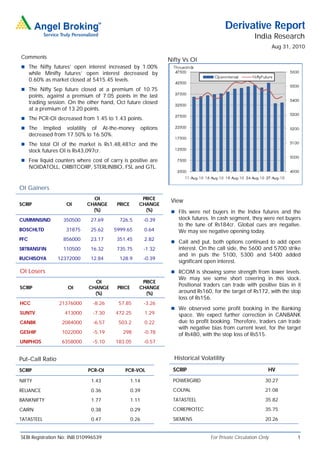
The Nifty futures’ open interest increased by 1.00%
while Minifty futures’ open interest decreased by
0.60% as market closed at 5415.45 levels.
The Nifty Sep future closed at a premium of 10.75
points, against a premium of 7.05 points in the last
trading session. On the other hand, Oct future closed
at a premium of 13.20 points.
The PCR-OI decreased from 1.45 to 1.43 points.
The Implied volatility of At-the-money options
decreased from 17.50% to 16.50%.
The total OI of the market is Rs1,48,481cr and the
stock futures OI is Rs43,097cr.
Few liquid counters where cost of carry is positive are
NOIDATOLL, ORBITCORP, STERLINBIO, FSL and GTL.
OI Gainers
OI PRICE
View
SCRIP OI CHANGE PRICE CHANGE
(%) (%) FIIs were net buyers in the Index futures and the
CUMMINSIND 350500 27.69 726.5 -0.39 stock futures. In cash segment, they were net buyers
to the tune of Rs184cr. Global cues are negative.
BOSCHLTD 31875 25.62 5999.65 0.64 We may see negative opening today.
PFC 856000 23.17 351.45 2.82
Call and put, both options continued to add open
SRTRANSFIN 110500 16.32 735.75 -1.32 interest. On the call side, the 5600 and 5700 strike
and in puts the 5100, 5300 and 5400 added
RUCHISOYA 12372000 12.84 128.9 -0.39
significant open interest.
OI Losers RCOM is showing some strength from lower levels.
We may see some short covering in this stock.
OI PRICE
Positional traders can trade with positive bias in it
SCRIP OI CHANGE PRICE CHANGE
(%) (%) around Rs160, for the target of Rs172, with the stop
loss of Rs156.
HCC 21376000 -8.26 57.85 -3.26
We observed some profit booking in the Banking
SUNTV 413000 -7.30 472.25 1.29 space. We expect further correction in CANBANK
CANBK 2084000 -6.57 503.2 0.22 due to profit booking. Therefore, traders can trade
with negative bias from current level, for the target
GESHIP 1022000 -5.19 298 -0.78 of Rs480, with the stop loss of Rs515.
UNIPHOS 6358000 -5.10 183.05 -0.57
Put-Call Ratio Historical Volatility
SCRIP PCR-OI PCR-VOL SCRIP HV
NIFTY 1.43 1.14 POWERGRID 30.27
RELIANCE 0.36 0.39 COLPAL 21.08
BANKNIFTY 1.77 1.11 TATASTEEL 35.82
CAIRN 0.38 0.29 COREPROTEC 35.75
TATASTEEL 0.47 0.26 SIEMENS 20.26
SEBI Registration No: INB 010996539 For Private Circulation Only 1
2. Derivative Report | India Research
FII Statistics for 30-Aug-2010 Turnover on 30-Aug-2010
Open Interest
No. of Turnover Change
Detail Buy Sell Net Instrument
Contracts (Rs. in cr.) (%)
Contracts Value Change
(Rs. in cr.) (%)
INDEX Index Futures 572185 14664.43 -3.61
1770.59 1350.75 419.84 558360 15104.62 -0.45
FUTURES
INDEX Stock Futures 477682 14248.92 -19.34
5434.13 4534.40 899.73 2265167 61332.04 3.63
OPTIONS
STOCK Index Options 2037221 55786.58 4.20
1083.37 776.49 306.88 1247930 33899.98 0.20
FUTURES
STOCK Stock Options 87402 2667.22 -15.86
55.46 64.89 (9.43) 15974 448.85 13.62
OPTIONS
TOTAL 8343.55 6726.53 1617.02 4087431 110785.49 2.03 Total 3174490 87367.15 -2.48
Nifty Spot = 5415.45 Lot Size = 50
Bull-Call Spreads Bear-Put Spreads
Action Strike Price Risk Reward BEP Action Strike Price Risk Reward BEP
Buy 5500 63.60 Buy 5400 97.05
37.75 62.25 5537.75 29.25 70.75 5370.75
Sell 5600 25.85 Sell 5300 67.80
Buy 5500 63.60 Buy 5400 97.05
55.50 144.50 5555.50 52.25 147.75 5347.75
Sell 5700 8.10 Sell 5200 44.80
Buy 5600 25.85 Buy 5300 67.80
17.75 82.25 5617.75 23.00 77.00 5277.00
Sell 5700 8.10 Sell 5200 44.80
Note: Above mentioned Bullish or Bearish Spreads in Nifty (September Series) are given as an information and not as a recommendation
Nifty Put-Call Analysis
For Private Circulation Only SEBI Registration No: INB 010996539 2
3. Derivative Report | India Research
Strategy Date Scrip Strategy Status
30-Aug-10 RELINFRA Long Call Ladder Continue
DISCLAIMER
This document is solely for the personal information of the recipient, and must not be singularly used as the basis of any investment
decision. Nothing in this document should be construed as investment or financial advice. Each recipient of this document should
make such investigations as they deem necessary to arrive at an independent evaluation of an investment in the securities of the
companies referred to in this document (including the merits and risks involved), and should consult their own advisors to determine
the merits and risks of such an investment.
Angel Broking Limited, its affiliates, directors, its proprietary trading and investment businesses may, from time to time, make
investment decisions that are inconsistent with or contradictory to the recommendations expressed herein. The views contained in this
document are those of the analyst, and the company may or may not subscribe to all the views expressed within.
Reports based on technical and derivative analysis center on studying charts of a stock's price movement, outstanding positions and
trading volume, as opposed to focusing on a company's fundamentals and, as such, may not match with a report on a company's
fundamentals.
The information in this document has been printed on the basis of publicly available information, internal data and other reliable
sources believed to be true, but we do not represent that it is accurate or complete and it should not be relied on as such, as this
document is for general guidance only. Angel Broking or any of its affiliates/ group companies shall not be in any way responsible
for any loss or damage that may arise to any person from any inadvertent error in the information contained in this report. Angel
Broking Limited has not independently verified all the information contained within this document. Accordingly, we cannot testify, nor
make any representation or warranty, express or implied, to the accuracy, contents or data contained within this document. While
Angel Broking Limited endeavours to update on a reasonable basis the information discussed in this material, there may be
regulatory, compliance, or other reasons that prevent us from doing so.
This document is being supplied to you solely for your information, and its contents, information or data may not be reproduced,
redistributed or passed on, directly or indirectly.
Angel Broking Limited and its affiliates may seek to provide or have engaged in providing corporate finance, investment banking or
other advisory services in a merger or specific transaction to the companies referred to in this report, as on the date of this report or
in the past.
Neither Angel Broking Limited, nor its directors, employees or affiliates shall be liable for any loss or damage that may arise from or
in connection with the use of this information.
Note: Please refer to the important `Stock Holding Disclosure' report on the Angel website (Research Section).
Derivative Research Team derivatives.desk@angeltrade.com
For Private Circulation Only SEBI Registration No: INB 010996539 3