Solution Manual for Financial Accounting, 11th Edition by Robert Libby, Patri...
Derivatives Report - July 1, 2010
1. Derivative Report
India Research
July 01, 2010
Comments
Nifty Vs OI
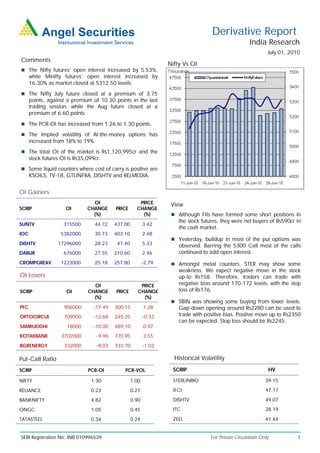
The Nifty futures’ open interest increased by 5.53%,
while Minifty futures’ open interest increased by
16.30% as market closed at 5312.50 levels.
The Nifty July future closed at a premium of 3.75
points, against a premium of 10.30 points in the last
trading session, while the Aug future closed at a
premium of 6.60 points.
The PCR-OI has increased from 1.26 to 1.30 points.
The Implied volatility of At-the-money options has
increased from 18% to 19%.
The total OI of the market is Rs1,120,995cr and the
stock futures OI is Rs35,099cr.
Some liquid counters where cost of carry is positive are
KSOILS, TV-18, GTLINFRA, DISHTV and RELMEDIA.
OI Gainers
OI PRICE View
SCRIP OI CHANGE PRICE CHANGE
(%) (%) Although FIIs have formed some short positions in
the stock futures, they were net buyers of Rs590cr in
SUNTV 315500 44.72 437.00 3.42
the cash market.
IOC 5382000 30.73 403.10 2.48
Yesterday, buildup in most of the put options was
DISHTV 17296000 28.23 47.40 5.33 observed. Barring the 5300 Call most of the calls
DABUR 676000 27.55 210.60 2.46 continued to add open interest.
CROMPGREAV 1223000 25.18 257.80 -2.79 Amongst metal counters, STER may show some
weakness. We expect negative move in the stock
OI Losers up-to Rs158. Therefore, traders can trade with
OI PRICE negative bias around 170-172 levels, with the stop
SCRIP OI CHANGE PRICE CHANGE loss of Rs176.
(%) (%)
SBIN was showing some buying from lower levels.
PFC 906000 -17.49 300.15 1.28 Gap-down opening around Rs2280 can be used to
OPTOCIRCUI 709000 -12.68 240.25 -0.33 trade with positive bias. Positive move up to Rs2350
can be expected. Stop loss should be Rs2245.
SAMRUDDHI 18000 -10.00 489.10 0.97
KOTAKBANK 3702000 -9.96 770.95 3.55
BGRENERGY 332000 -8.03 733.70 -1.03
Put-Call Ratio Historical Volatility
SCRIP PCR-OI PCR-VOL SCRIP HV
NIFTY 1.30 1.00 STERLINBIO 39.15
RELIANCE 0.23 0.27 IFCI 47.17
BANKNIFTY 4.82 0.90 DISHTV 49.07
ONGC 1.05 0.45 ITC 28.19
TATASTEEL 0.34 0.24 ZEEL 41.44
SEBI Registration No: INB 010996539 For Private Circulation Only 1
2. Derivative Report | India Research
FII Statistics for 30-June-2010 Turnover on 30-June-2010
Open Interest
No. of Turnover Change
Detail Buy Sell Net Instrument
Contracts (Rs. in cr.) (%)
Contracts Value Change
(Rs. in cr.) (%)
INDEX Index Futures 676906 16543.38 -6.24
1545.78 1449.96 95.83 676585 17844.14 1.89
FUTURES
INDEX Stock Futures 627558 18350.00 11.33
5330.33 4790.31 540.02 1647431 43716.57 3.65
OPTIONS
STOCK Index Options 1603097 42511.20 -7.30
1045.40 1322.33 (276.93) 1083149 28530.69 2.66
FUTURES
STOCK Stock Options 99717 3019.52 24.70
128.34 122.91 5.43 29774 888.31 1.54
OPTIONS
TOTAL 8049.86 7685.51 364.34 3436939 90979.70 2.97 Total 3007278 80424.10 -2.41
Nifty Spot = 5312.50 Lot Size = 50
Bull-Call Spreads Bear-Put Spreads
Action Strike Price Risk Reward BEP Action Strike Price Risk Reward BEP
Buy 5400 63.05 Buy 5300 101.85
34.45 65.55 5434.45 31.10 68.90 5268.90
Sell 5500 28.60 Sell 5200 70.75
Buy 5400 63.05 Buy 5300 101.85
51.70 148.30 5451.70 53.10 146.90 5246.90
Sell 5600 11.35 Sell 5100 48.75
Buy 5500 28.60 Buy 5200 70.75
17.25 82.75 5517.25 22.00 78.00 5178.00
Sell 5600 11.35 Sell 5100 48.75
Note: Above mentioned Bullish or Bearish Spreads in Nifty (July Series) are given as an information and not as a recommendation
Nifty Put-Call Analysis
For Private Circulation Only SEBI Registration No: INB 010996539 2
3. Derivative Report | India Research
Strategy Date Scrip Strategy Status
28-July-2010 Reliance Long Put Continue
DISCLAIMER:
This document is not for public distribution and has been furnished to you solely for your information and must not be reproduced or redistributed to any other person.
Persons into whose possession this document may come are required to observe these restrictions.
Opinion expressed is our current opinion as of the date appearing on this material only. While we endeavor to update on a reasonable basis the information discussed in
this material, there may be regulatory, compliance, or other reasons that prevent us from doing so. Prospective investors and others are cautioned that any forward-
looking statements are not predictions and may be subject to change without notice. Our proprietary trading and investment businesses may make investment decisions
that are inconsistent with the recommendations expressed herein.
The information in this document has been printed on the basis of publicly available information, internal data and other reliable sources believed to be true and are for
general guidance only. While every effort is made to ensure the accuracy and completeness of information contained, the company takes no guarantee and assumes no
liability for any errors or omissions of the information. No one can use the information as the basis for any claim, demand or cause of action.
Recipients of this material should rely on their own investigations and take their own professional advice. Each recipient of this document should make such investigations
as it deems necessary to arrive at an independent evaluation of an investment in the securities of companies referred to in this document (including the merits and risks
involved), and should consult their own advisors to determine the merits and risks of such an investment. Price and value of the investments referred to in this material may
go up or down. Past performance is not a guide for future performance.
Certain transactions - futures, options and other derivatives as well as non-investment grade securities - involve substantial risks and are not suitable for all investors.
Reports based on technical analysis centers on studying charts of a stock's price movement and trading volume, as opposed to focusing on a company's fundamentals and
as such, may not match with a report on a company's fundamentals.
We do not undertake to advise you as to any change of our views expressed in this document. While we would endeavor to update the information herein on a reasonable
basis, Angel Broking, its subsidiaries and associated companies, their directors and employees are under no obligation to update or keep the information current. Also
there may be regulatory, compliance, or other reasons that may prevent Angel Broking and affiliates from doing so. Prospective investors and others are cautioned that
any forward-looking statements are not predictions and may be subject to change without notice.
Angel Broking Limited and affiliates, including the analyst who has issued this report, may, on the date of this report, and from time to time, have long or short positions
in, and buy or sell the securities of the companies mentioned herein or engage in any other transaction involving such securities and earn brokerage or compensation or
act as advisor or have other potential conflict of interest with respect to company/ies mentioned herein or inconsistent with any recommendation and related information
and opinions.
Angel Broking Limited and affiliates may seek to provide or have engaged in providing corporate finance, investment banking or other advisory services in a merger or
specific transaction to the companies referred to in this report, as on the date of this report or in the past.
Sebi Registration No.: INB 010996539
Derivative Research Team derivatives.desk@angeltrade.com
For Private Circulation Only SEBI Registration No: INB 010996539 3