Call Girls in Mehrauli Delhi 💯Call Us 🔝8264348440🔝
Market Strategy july 2010
1. Market Strategy
July 2010
Angel Portfolio Going overweight on heavy metal
Sector Weightage(%) Stocks Ironically, having one of the largest iron-ore reserves in the world, India is
exporting iron ore at the rate of 100mn tonnes p.a. and importing steel at the
Auto & 7.0 Maruti, Fag rate of 12mn tonnes p.a. – clearly not an equilibrium state of affairs. This month’s
Ancillaries Bearings, strategy, therefore, focuses on an interesting confluence of events in the Indian
JK Tyres steel sector, which has thrown up highly profitable opportunities for some of the
Banking 28.0 SBI, Axis Bank, smaller steel companies, such as Electrosteel Castings, Godawari Power & Ispat
ICICI Bank, and Bhushan Steel.
HDFC Bank
FMCG 3.0 ITC Over the next two-three years, these companies are set to benefit from strong
volume growth and lucrative mine allocations. Operating margins are expected to
Hotels 3.0 Taj GVK
remain healthy due to favorable demand-supply dynamics, resulting from high
Infra & 16.0 L&T, Reliance Infra, domestic demand growth of over 10%, even as debt-strapped balance sheets of
Cap Goods Madhucon Projects, several larger players are acting as a deterrent to any indiscriminate expansion.
IVRCL Infra,
Jyoti Structures Integrated Indian steel players also enjoy a US $150/tonne low-cost advantage,
Media 2.0 Jagran Prakashan as compared to companies that are not iron-ore integrated, and can comfortably
Metals 9.0 Electrosteel Castings, tackle any threat of imports from countries such as China.
Hindalco, Godawari
Power, Bhushan Steel
Steel demand in India is expected to grow much faster than the
Oil & Gas 10.0 Reliance Industries
world’s average
Pharma 4.0 Dishman Pharma,
We expect steel consumption in India to grow at a 10% CAGR over the next five
Lupin years, as the country’s per-capita consumption (which is currently at 44kg) catches
Real Estate 3.0 Anant Raj Industries up with the global average of 190kg. Presently, with economic activity picking up,
Software 11.0 Infosys, TCS, steel consumption in India is rising faster than production, mainly led by robust
Tech Mahindra, demand from the housing, infrastructure and automobile sectors. In FY2010,
Mphasis Indian steel consumption grew by 7.6% to 56.3mn tonnes, and steel production
Telecom 4.0 Bharti Airtel grew only by 4.2%. In April 2010, Indian steel consumption continued to grow by
9.6% yoy to 4.14mn tonnes while steel production rose by just 5.3% yoy.
Top Picks
Company (Rs) CMP TP
High debt levels are putting a check on domestic capacity
expansion
Bharti Airtel 308 360
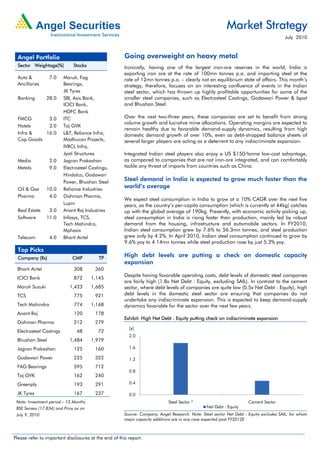
Despite having favorable operating costs, debt levels of domestic steel companies
ICICI Bank 872 1,145
are fairly high (1.8x Net Debt : Equity, excluding SAIL). In contrast to the cement
Maruti Suzuki 1,423 1,685 sector, where debt levels of companies are quite low (0.5x Net Debt : Equity), high
TCS 775 921 debt levels in the domestic steel sector are ensuring that companies do not
undertake any indiscriminate expansion. This is expected to keep demand-supply
Tech Mahindra 774 1,168 dynamics favorable for the sector over the next few years.
Anant Raj 120 178
Exhibit: High Net Debt : Equity putting check on indiscriminate expansion
Dishman Pharma 212 279
(x)
Electrosteel Castings 48 72
2.0
Bhushan Steel 1,484 1,979
Jagran Prakashan 125 160 1.6
Godawari Power 225 322 1.2
FAG Bearings 595 712
0.8
Taj GVK 162 240
Greenply 193 291 0.4
JK Tyres 167 237 0.0
Note: Investment period – 12 Months Steel Sector * Cement Sector
BSE Sensex (17,834) and Price as on Net Debt : Equity
July 9, 2010 Source: Company, Angel Research. Note: Steel sector Net Debt : Equity excludes SAIL, for whom
major capacity additions are in any case expected post FY2012E
Please refer to important disclosures at the end of this report.
2. Market Strategy
China’s competitiveness reduced, with withdrawal of export
rebates and increased cost
During April–May 2010, India’s steel imports grew by 79% yoy to 1.79mn tonnes
(mainly from China), as Chinese export prices fell by ~US $100/tonne in May
2010. However, the Chinese government withdrew the 9% rebate on HRC and
13% rebate on CRC with effect from July 15, 2010, which led to an immediate
increase of US $30 in export prices. We believe the withdrawal of rebate would
lessen the import pressure on Indian steel companies as the competitiveness of
Chinese companies is reduced by ~US $50/tonne. Further, with iron ore and
coking coal prices increasing by 12–30% for 2QFY2011E, we believe steel prices
will find support at current levels.
Lasting low-cost advantage
With rising raw material costs, steel mills across the world are focusing on
integration. India is self-sufficient in iron ore and, in fact, exported nearly 100mn
tonnes of iron ore in FY2010. Integrated domestic steel players, including Tata
Steel and SAIL, are resilient to the volatility in iron ore cost and enjoy a cost
advantage of ~US $150/tonne as compared to companies that are not iron-ore
integrated.
Overweight on Metals
The icing on the cake is that due to the recent short-term correction in steel prices,
prices of these stocks have also come down, and they are now available at
attractive valuations. As a result, we have gone overweight on metal stocks in our
model portfolio, giving a weightage of 9.0% vis-à-vis the 7.8% weightage in the
BSE-100. We rate Electrosteel Castings, Godawari Power & Ispat and Bhushan
Steel amongst our top picks in the space, with strong upsides in the range of
35–50% over the next 12 months.
Valuation Snapshot
Company CMP Target Reco P/E (x) P/BV (x) EV/EBITDA (x) RoE (%) RoCE (%)
(Rs) Price (Rs) FY11E FY12E FY11E FY12E FY11E FY12E FY11E FY12E FY11E FY12E
SAIL 194 - Neutral 12.5 11.6 2.1 1.9 8.0 7.3 18.2 17.0 17.2 16.9
Tata Steel 496 697 Buy 8.1 8.7 1.4 1.2 6.5 5.9 17.9 14.7 11.8 11.7
JSW Steel 1,082 1,360 Buy 10.0 8.4 1.8 1.5 6.7 5.3 22.1 21.3 15.0 16.7
Bhushan Steel 1,484 1,979 Buy 6.5 5.0 1.5 1.2 7.2 5.9 26.0 26.1 12.6 14.0
Electrosteel 48 72 Buy 7.3 7.1 0.9 0.8 5.6 4.9 14.2 13.1 11.9 12.3
Prakash Inds 181 232 Buy 8.2 5.5 1.3 1.0 5.7 4.3 19.7 23.2 16.6 18.7
Godawari Power 225 322 Buy 4.2 3.2 0.9 0.7 3.2 2.1 26.1 26.7 21.2 23.5
Monnet Ispat 498 534 Accumulate 11.1 7.7 1.5 1.3 9.6 7.8 14.8 17.6 11.7 12.7
Sarda Energy 268 290 Accumulate 7.6 6.1 1.4 1.1 5.5 4.1 19.4 20.2 15.1 16.5
Source: Company, Angel Research
July 2010 2
3. Market Strategy
New Investment Ideas
Polyplex Corporation (CMP: Rs.272/ TP: Rs.418/ Upside: 54%)
Polyplex Corporation (PCL) is one of the leading manufacturers of biaxially
oriented polyester (PET) films globally with manufacturing facilities in India,
Thailand and Turkey.
PCL recently forayed into the lucrative, high-growth BOPP and CPP segments with
a BOPP capacity of 35,000tpa in India as well as a new 10,000 tpa CPP plant in
Thailand. In PET films, PCL increased capacity in India by 155% in FY2010.
Overall, on the back of the company's capacity expansion moves, we expect it to
post 20% CAGR in consolidated sales over FY2010-12E.
The company is also available at inexpensive valuation of 0.6x FY2010E P/BV,
while its peers Jindal Poly and Ester Industries are trading between 0.9-1.1x
FY2010E P/BV. PCL holds 70% stake in its listed Thailand subsidiary Polyplex
Thailand (PTL), which has a market cap of Rs950cr and is available at FY2010E
P/BV. However, PCL has a market cap of Rs426cr or 0.6x FY2010E P/BV, which is
at more than 55% discount to PTL's market cap and at a discount of nearly 36% to
PCL's 70% stake in PTL, which works out to around Rs665cr.
Over the past five years, PCL has traded in the range of 0.3-0.7x one year forward
P/BV, and is currently trading at 0.5x FY2012E P/BV. Considering the 46% CAGR
in earnings over FY10-12E, we value PCL at the upper band (0.7x) FY2012E P/BV.
Y/E Sales OPM PAT EPS ROE P/E P/BV EV/EBITDA EV/Sales
March (Rs cr) (%) (Rs cr) (Rs) (%) (x) (x) (x) (x)
FY2011E 1,581 18.5 129 81.0 17.1 3.4 0.53 2.5 0.5
FY2012E 1,733 19.0 154 96.4 17.4 2.8 0.45 1.7 0.3
Alembic (CMP: Rs.56/ TP: Rs.74/ Upside: 32%)
Alembic has announced de-merger of its Pharma business (comprises its domestic
formulation, international generic and API businesses) into a separate company
named Alembic Pharma.
With this, Alembic plans to insulate its relatively high-margin Pharma business
from the loss-making Pen-G business (API facility at Vadodara). Alembic also plans
to develop its 70 acre land asset going forward.
We believe that de-merger of the company into two - Alembic and Alembic
Pharma - is a long term positive as it unlocks value for both the businesses and
paves the way to rope in future investors.
We recommend Buy on the stock valuing Alembic on a SOTP basis with a fair
value of Rs74 ascribing Rs47 per share to Alembic Pharma at 10x FY2012E EPS,
valuing Alembic’s 29.2% stake in Alembic Pharma at 20% discount to Rs11 per
share, Alembic’s API business at Rs5 per share and valuing Land bank at Rs11 per
share.
Y/E Sales OPM PAT EPS ROE P/E P/BV EV/EBITDA EV/Sales
March (Rs cr) (%) (Rs cr) (Rs) (%) (x) (x) (x) (x)
FY2011E 1,315 12.4 74.5 5.6 18.8 10.0 1.7 7.0 0.9
FY2012E 1,478 12.0 87.0 6.5 19.0 8.6 1.5 6.2 0.7
Note: Alembic estimates currently includes the demerged pharma business
July 2010 3
5. Market Strategy
Top Picks
Large Caps
Bharti Airtel (CMP: Rs.308/ TP: Rs.360/ Upside:30%)
Bharti continues to maintain its leadership status in customer and revenue market
share helped by strong subscriber addition (33.7mn in FY2010) and high ARPU of
Rs253 (Industry average of Rs164).
The competition (price war) is unlikely to further intensify as the cost of operation
for the new players is high and unsustainable. We believe that Bharti with high
EBIDTA/minute of Rs 0.16 is relatively placed better than peers.
Valuations for Zain are perceived as expensive but would still be value accretive on
account of financial leverage from the Leveraged Buy Out structuring of the deal.
Bharti bagged 3G spectrum in 13 circles with an estimated outlay of Rs12,295cr,
which would cover 65% of its subscriber base and 69% of its revenues; this would
stress the company’s Debt position and impact Earnings by 3%.
Bharti is currently trading at 12.4x FY2012E EPS, a significant discount to its
historical average of 26.0x and FY2012E Sensex P/E of 13.8x and hence we
maintain a Buy on the stock.
Y/E Sales OPM PAT EPS ROE P/E P/BV EV/EBITDA EV/Sales
March (Rs cr) (%) (Rs cr) (Rs) (%) (x) (x) (x) (x)
FY2011E 42,773 35.3 8,350 22.0 18.6 14.0 2.4 7.8 2.8
FY2012E 47,328 35.6 9,449 24.9 17.9 12.4 2.1 6.9 2.4
ICICI Bank (CMP: Rs.872/ TP: Rs.1,145/ Upside: 31%)
The Bank is well-positioned to gain market share on the back of substantial branch
expansion (substantial 1508 branches added since 3QFY2008, including entire
branch network of BoR) as well as strong Capital Adequacy at 19.4% (Tier-I at
14.2%).
Net Interest Margins of the Bank are expected to sustain on the back of increase in
CASA ratio to 42% in FY2010 from 29% in FY2009.
On the back of an improving economic environment, NPA losses are expected to
start declining. The Bank has also done lower restructuring of loans than PSU
Banks (10% of Net Worth v/s 40%+ for most PSU Banks).
The stock is trading at attractive valuations of 1.7x FY2012E P/ABV. Hence, we
maintain a Buy on the stock.
Y/E Op Inc. NIM PAT EPS ABV ROA ROE P/E P/ABV
March (Rs cr) (%) (Rs cr) (Rs) (Rs) (%) (%) (x) (x)
FY2011E 17,738 2.6 4,948.2 44.4 487 1.2 11.5 19.6 1.8
FY2012E 21,711 2.6 6,713.2 60.2 518 1.4 15.1 14.5 1.7
Maruti Suzuki (CMP: Rs.1,423/ TP: Rs.1,685/ Upside: 18%)
Given India's low car penetration (12 per 1,000 v/s 21 per 1,000 in China) and
with PPP-based per capita estimated to approach the empirically-observed
inflection point for car demand of US $5,000 over the next 4-5 years, we expect
13% CAGR in domestic volumes over FY2010-12E.
July 2010 5
6. Market Strategy
Maruti has a sizeable competitive advantage over foreign entrants due to its
widespread distribution network (2,767 service and 681 sales outlets).
Moreover, with Suzuki Japan making Maruti a manufacturing hub for small cars,
to cater to increasing global demand caused by rising fuel prices and stricter
emission standards, we estimate 18% CAGR in export volumes over FY2010-12E.
We believe attractive valuations of 13.5x FY2012E EPS, which provides an entry
point for investors looking to play the India consumer story.
Y/E Sales OPM PAT EPS ROE P/E P/BV EV/EBITDA EV/Sales
March (Rs cr) (%) (Rs cr) (Rs) (%) (x) (x) (x) (x)
FY2011E 33,519 11.2 2,674 92.5 19.2 15.4 2.8 8.8 1.0
FY2012E 39,320 11.3 3,043 105.3 17.8 13.5 2.4 7.1 0.1
TCS (CMP: Rs.775/ TP: Rs.921/ Upside: 20%)
TCS continues to maintain its strong revenue growth and out performance led by
strong deal wins on the back of improving global macro-economic scenario.
Strong client addition, deal wins, robust hiring by IT companies, positive guidance
by peers and new services expansion highlights the improved business scenario
and revival in the overall IT spending.
TCS has displayed strong margin resilience with an improvement in profitability
(EBIDTA Margin improved from 25.8% in FY2009 to 28.9% in FY2010) despite
weak demand and declining pricing realisations. We have valued TCS at 22x on
FY2012E Earnings in line with our Target multiple for Infosys. Hence, we maintain
a Buy on the stock.
Y/E Sales OPM PAT EPS ROE P/E P/BV EV/EBITDA EV/Sales
March (Rs cr) (%) (Rs cr) (Rs) (%) (x) (x) (x) (x)
FY2011E 33,351 28.7 7,413 37.9 31.9 20.4 6.0 15.2 4.3
FY2012E 38,821 28.2 8,200 41.9 29.8 18.5 5.1 12.9 3.6
Tech Mahindra (CMP: Rs.774/ TP: Rs.1,168/ Upside: 66%)
Restructuring deal with BT ensures compensatory volumes; Muted pricing terms
may enhance with an improvement in the client's financial health.
Sustained volume traction from non-BT clients (CQGR of 7.5% in last eight
quarters) continues to provide revenue growth momentum, margin improvement,
geographical diversification and reduced client concentration to the company.
Positive news flow from Satyam in the form of client retention, new deal wins and
favourable settlement with Upaid provides comfort on future business prospects.
The stock is trading at a substantial 65% discount (after deducting value of Satyam
stake) to Infosys on a 1-year forward P/E v/s a 5-year average discount of 20%
and 1x FY2012E EV/Sales (v/s Peer average of 3x). Hence, we maintain a Buy on
the stock.
Y/E Sales OPM PAT EPS ROE P/E P/BV EV/EBITDA EV/Sales
March (Rs cr) (%) (Rs cr) (Rs) (%) (x) (x) (x) (x)
FY2011E 4,989 24.0 763 58.3 24.9 13.3 2.8 5.4 1.3
FY2012E 5,704 23.0 876 67.0 22.0 11.6 2.2 4.3 1.0
July 2010 6
7. Market Strategy
Mid Caps
Anant Raj Industries (CMP: Rs.120/ TP: Rs.178/ Upside: 48%)
Almost all of ARIL's land bank (872 acres) is exclusively located in the NCR within
50km of Delhi, with approximately 525 acres in Delhi. This land bank has been
acquired at an historical average cost of Rs300/sq ft.
We expect ARIL's residential projects to drive its near-term operational visibility and
help register Rs600cr Profit over the next three years. ARIL recently launched two
residential projects in NCR; Kapashera (0.28mn sq. ft.) and Manesar (1mn sq. ft.)
for Rs5,000/sq. ft. and Rs2,500/sq. ft., respectively. Management has indicated
that it has entirely sold kapashera project and ~20% of Manesar project. Further,
ARIL has 70% pre-lease commitments at its Manesar IT Park, coupled with five
hotels getting operational by FY2011E, which will improve rental visibility.
ARIL is trading at a 43% discount to its NAV. The stock is trading at 9.2x FY2012E
EPS and 0.9x FY2012E P/BV and hence we recommend a Buy on stock.
Y/E Sales OPM PAT EPS ROE P/E P/BV EV/EBITDA EV/Sales
March (Rs cr) (%) (Rs cr) (Rs) (%) (x) (x) (x) (x)
FY2011E 342 93.5 276 8.8 7.3 13.7 1.0 8.9 8.4
FY2012E 610 90.4 411 13.1 9.9 9.2 0.9 6.2 5.6
Bhushan Steel (CMP: Rs.1484/ TP: Rs.1979/ Upside: 33%)
Bhushan Steel has extended its presence in the steel value chain with the
commissioning of its 1.9mn tonnes HR steel capacity at Orissa.
We expect BSL to register 26.2% CAGR in volumes over FY2010- 15E, on
completion of Phase-III expansion by October 2012, much higher than its peers,
who are expected to register volume growth of 10-14% CAGR.
Further EBITDA/tonne is expected to be at the higher end of the industry range (US
$325+) on account of adoption of BF-EAF technology and lower conversion costs
We recommend a BUY on the stock with a target price of Rs1,979, valuing the
stock at 6.5x FY2012E EV/EBITDA
Y/E Sales OPM PAT EPS ROE P/E P/BV EV/EBITDA EV/Sales
March (Rs cr) (%) (Rs cr) (Rs) (%) (x) (x) (x) (x)
FY2011E 6,290 37.5 968 228.0 26.0 6.5 1.5 7.2 2.7
FY2012E 7,131 41.1 1,259 296.4 26.1 5.0 1.2 5.9 2.4
Dishman Pharma (CMP: Rs.212/ TP: Rs.279/ Upside: 32%)
Dishman has incurred organic capex of Rs300cr in the last three years towards
expansion of existing facilities at its Bavla unit and building the China and HPAPI
facilities.
Post all these facilities coming on-stream FY2011E onwards, Dishman would
strengthen its ties with the Global Innovators leading to stable Revenue flow over
the long run.
July 2010 7
8. Market Strategy
Further, Revenues from the Abbott-Solvay contract, which constituted 13% of
FY2010 Sales, have also started normalizing. Also, the Carbogen Amics (41% of
FY2010 sales) is expected to witness an uptrend in FY2011. Overall, the company
has guided towards 20% growth in Top-line for FY2011E.
Dishman is currently trading at attractive valuations of 9.9x FY2012E Earnings.
Hence, we recommend a Buy on the stock.
Y/E Sales OPM PAT EPS ROE P/E P/BV EV/EBITDA EV/Sales
March (Rs cr) (%) (Rs cr) (Rs) (%) (x) (x) (x) (x)
FY2011E 1,099 24.1 142 17.4 15.8 12.2 1.8 9.2 2.2
FY2012E 1,335 25.5 174 21.4 16.8 9.9 1.5 7.2 1.8
Electrosteel Castings (CMP: Rs.48/ TP: Rs.72/ Upside: 51%)
Electrosteel Castings (ECL) is venturing into steel-making through its subsidiary
Electrosteel Integrated (EIL), which is setting up a 2.2mn tonne steel plant expected
to be commissioned by FY2012E. Further, ECL plans to list EIL to raise ~Rs300cr,
which is likely to unlock value for ECL.
ECL's backward integration initiatives through allocation of coking coal mines are
expected to result in expansion of EBITDA Margin by 1,304bp over FY2009-12E.
The company is also awaiting final environmental clearance for its iron ore mine,
which will further lower costs, but has not been factored in our estimates.
We recommend a Buy on the stock, valuing the Core business at 7x FY2012E
FDEPS and its investments in the Steel business at 1x Book Value.
Y/E Sales OPM PAT EPS ROE P/E P/BV EV/EBITDA EV/Sales
March (Rs cr) (%) (Rs cr) (Rs) (%) (x) (x) (x) (x)
FY2011E 1,706 26.2 246 6.5 14.2 7.3 0.9 5.6 1.5
FY2012E 1,818 28.0 254 6.7 13.1 7.1 0.8 4.9 1.4
Godawari Power & Ispat (CMP: Rs.225/ TP: Rs.322/ Upside: 43%)
Godawari Power commissioned 0.6mn tonne pellet plant in February 2010. We
expect GPIL to save ~Rs125cr from increasing iron ore production from its Ari
Dongri mines and its subsequent conversion into pellets. Further, the capacity of
the mine is expected to increase to 0.9mn tonne by FY2011E, not factored in our
estimates.
Currently, trial production is underway at the 0.6mn tonne pellet plant, which is
being set up in its 75% subsidiary Ardent Steel. It expects to start commercial
production by August 2010. We expect the plant to contribute Rs18cr and Rs52cr
to the company’s EBITDA in FY2011E and FY2012E, respectively.
The company has secured the necessary clearance for its Boria Tibu mine and
production is expected to start post monsoon. The mine has total reserves of
7.0mn tonne and iron ore of ~62% Fe content. The company expects to produce
~200,000 tonnes in FY2011E.
With earning expected to grow at a CAGR of 94.2% over FY2010-12E. We
maintain our Buy recommendation, valuing the stock at 3.5x FY2012E EV/EBITDA
Y/E Sales OPM PAT EPS ROE P/E P/BV EV/EBITDA EV/Sales
March (Rs cr) (%) (Rs cr) (Rs) (%) (x) (x) (x) (x)
FY2011E 1,084 25.6 150 53.6 26.1 4.2 0.9 3.2 0.8
FY2012E 1,265 26.1 198 70.9 26.7 3.2 0.7 2.1 0.5
July 2010 8
9. Market Strategy
Jagran Prakashan (CMP: Rs.125/ TP: Rs.160/ Upside: 25%)
Jagran (JPL) continues to post steady growth in revenues, primarily aided by
Advertisement revenues owing to its strong foothold in the Hindi belt and rising
color ad-inventory coupled with ad-rate hikes. Moreover, the Mid-Day deal (not
factored in our numbers) gives Jagran entry into the lucrative English markets thus,
filling the gap in its portfolio.
We expect JPL to sustain its operating margins at 30% levels for FY2011-12E, as
the company continues to benefit from benign newsprint prices (we have modeled
in ~10% rise in newsprint cost). Moreover, lower losses in JPL’s new initiatives and
higher operating leverage (as ad-rate hikes get absorbed), renders us optimism.
At the CMP of Rs125, Jagran is available at 15.8x FY2012E Earnings, which is
highly attractive given its 16% Earnings CAGR. The stock is attractive given its high
return ratios and strong leadership position. Moreover, Blackstone’s recent
investment of Rs225cr in the company’s promoter entity and strong Operating
Cash flows make Jagran well placed in terms of funding future growth. We
maintain a Buy on the stock.
Y/E Sales OPM PAT EPS ROE P/E P/BV EV/EBITDA EV/Sales
March (Rs cr) (%) (Rs cr) (Rs) (%) (x) (x) (x) (x)
FY2011E 1,088 29.8 197 6.6 31.0 19.0 5.7 11.7 3.5
FY2012E 1,260 30.6 237 7.9 34.3 15.8 5.2 9.8 3.0
Small Caps
FAG Bearings (CMP: Rs.593/ TP: Rs.712/ Upside: 20%)
With increasing mechanisation, demand for bearings is expected to exceed overall
IIP growth in India. Consequently, the Industrial Segment (which accounts for
almost 50% of the Indian Bearings market) offers immense growth opportunity for
the Bearings industry.
Moreover, the Bearings Segment has a direct correlation with Auto Sector growth,
which is expected to grow at around 10% per annum over the next 2-3 years.
The stock is currently trading below its average historical valuations at 10x
CY2011E EPS and 1.6x CY2011E BV (v/s average of 2x 1-year forward BV).
Further, we believe that FAG Bearings scores well over its peers and is a good
long-term investment pick in view of its strong financials.
Y/E Sales OPM PAT EPS ROE P/E P/BV EV/EBITDA EV/Sales
Dec (Rs cr) (%) (Rs cr) (Rs) (%) (x) (x) (x) (x)
CY2010E 959 15.0 85 51.3 17.1 11.6 1.8 5.4 0.8
CY2011E 1,084 15.4 99 59.4 17.0 10.0 1.6 4.5 0.7
Greenply Industries (CMP: Rs.193/ TP: Rs.291/ Upside: 51%)
GIL is foraying into the lucrative, high-growth MDF market, with the largest MDF
plant in India (1,80,000m3/yr capacity), while continuing its strong expansion in
laminates (88% capacity expansion), that is estimated to drive 21% CAGR in sales
over FY2010-12E.
July 2010 9
10. Market Strategy
GIL has leading plywood and laminates brands, supported by ad-spend as high as
3.3% of total sales (around 10% of laminates sales). The company also has the
largest distribution network of over 15,000 dealers in industry. These advantages
underpin the strong RoE profile of the company's brand-driven business model
(21% over FY2010-12E).
The stock is trading at attractive valuations of 5.3x FY2012E EPS (as against its
historical range of 3.3-9.3x 1-year forward EPS). Hence, we recommend a Buy on
the stock.
Y/E Sales OPM PAT EPS ROE P/E P/BV EV/EBITDA EV/Sales
March (Rs cr) (%) (Rs cr) (Rs) (%) (x) (x) (x) (x)
FY2011E 1,088 14.0 57 23.5 18.4 8.2 1.4 5.4 0.8
FY2012E 1,279 15.0 88 36.4 22.8 5.3 1.1 4.2 0.6
JK Tyre & Industries (CMP: Rs.167/ TP: Rs.237/ Upside: 42%)
Given the shortage of radial tyres in the Trucks & Buses Segment, the company is
set to fully utilise its enhanced capacity, and that too at higher realisations (70% of
India's total truck/bus radial tyre production), driving strong earnings growth and
improving RoEs.
Further, the Tornel acquisition turned profitable in FY2010, aided by the
restructuring exercise implemented by the company.
The stock is available at attractive valuations of 3.5x FY2012E EPS and hence we
recommend a Buy.
Y/E Sales OPM PAT EPS ROE P/E P/BV EV/EBITDA EV/Sales
March (Rs cr) (%) (Rs cr) (Rs) (%) (x) (x) (x) (x)
FY2011E 5,523 9.2 160 39.0 9.7 4.3 0.7 3.9 0.4
FY2012E 6,001 10.1 195 47.5 15.9 3.5 0.6 3.3 0.3
TajGVK Hotels (CMP: Rs.162/ TP: Rs.240/ Upside: 48%)
Robust growth in foreign tourist arrivals (10.8% growth during January to June
2010 v/s -9% in the corresponding period last year) and increased domestic tourist
activity is enabling hoteliers to overcome the tough phase witnessed in the recent
past.
Signs of improving demand are visible with occupancy rates staying above ~70%
since 3QFY2010 and Average Room Rates firming up in 1QFY2010.
Considering the revival in demand happening in business destinations like
Hyderabad and Chennai, where TAJGVK has presence, we expect the company to
be a significant beneficiary in the coming quarters.
Moreover, in comparison to its peers, the stock trades at attractive valuations of
Rs1cr FY2012E EV/Room and 13.3x FY2012E EPS. Hence, we recommend a Buy
on the stock.
Y/E Sales OPM PAT EPS ROE P/E P/BV EV/EBITDA EV/Sales
March (Rs cr) (%) (Rs cr) (Rs) (%) (x) (x) (x) (x)
FY2011E 298 40.6 56.2 9.0 17.7 18.1 3.0 9.6 3.9
FY2012E 342 42.8 76.3 12.2 20.3 13.3 2.5 7.5 3.2
July 2010 10
15. Disclaimer
This document is solely for the personal information of the recipient, and must not be singularly
used as the basis of any investment decision. Nothing in this document should be construed as
investment or financial advice. Each recipient of this document should make such investigations as
they deem necessary to arrive at an independent evaluation of an investment in the securities of
the companies referred to in this document (including the merits and risks involved), and should
consult their own advisors to determine the merits and risks of such an investment.
Angel Broking Limited, its affiliates, directors, its proprietary trading and investment businesses
may, from time to time, make investment decisions that are inconsistent with or contradictory to
the recommendations expressed herein. The views contained in this document are those of the
analyst, and the company may or may not subscribe to all the views expressed within.
Reports based on technical and derivative analysis center on studying charts of a stock's price
movement, outstanding positions and trading volume, as opposed to focusing on a company's
fundamentals and, as such, may not match with a report on a company's fundamentals.
The information in this document has been printed on the basis of publicly available information,
internal data and other reliable sources believed to be true, but we do not represent that it is
accurate or complete and it should not be relied on as such, as this document is for general
guidance only. Angel Broking or any of its affiliates/ group companies shall not be in any way
responsible for any loss or damage that may arise to any person from any inadvertent error in the
information contained in this report. Angel Broking Limited has not independently verified all the
information contained within this document. Accordingly, we cannot testify, nor make any
representation or warranty, express or implied, to the accuracy, contents or data contained within
this document. While Angel Broking Limited endeavours to update on a reasonable basis the
information discussed in this material, there may be regulatory, compliance, or other reasons that
prevent us from doing so.
This document is being supplied to you solely for your information, and its contents, information or
data may not be reproduced, redistributed or passed on, directly or indirectly.
Angel Broking Limited and its affiliates may seek to provide or have engaged in providing
corporate finance, investment banking or other advisory services in a merger or specific
transaction to the companies referred to in this report, as on the date of this report or in the past.
Neither Angel Broking Limited, nor its directors, employees or affiliates shall be liable for any loss
or damage that may arise from or in connection with the use of this information.
Note: Please refer to the important `Stock Holding Disclosure' report on the Angel website
(Research Section).
Ratings (Returns): Buy (> 15%) Accumulate (5% to 15%) Neutral (-5 to 5%) Reduce (-5% to -15%) Sell (< -15%)
16. Address: Acme Plaza, ‘A’ Wing, 3rd Floor, M.V. Road, Opp. Sangam Cinema, Andheri (E), Mumbai - 400 059.
Tel : (022) 3952 4568 / 4040 3800
Research Team
Fundamental:
Sarabjit Kour Nangra VP-Research, Pharmaceutical sarabjit@angeltrade.com
Vaibhav Agrawal VP-Research, Banking vaibhav.agrawal@angeltrade.com
Vaishali Jajoo Automobile vaishali.jajoo@angeltrade.com
Shailesh Kanani Infrastructure, Real Estate shailesh.kanani@angeltrade.com
Anand Shah FMCG, Media anand.shah@angeltrade.com
Deepak Pareek Oil & Gas deepak.pareek@angeltrade.com
Sushant Dalmia Pharmaceutical sushant.dalmia@angeltrade.com
Rupesh Sankhe Cement, Power rupeshd.sankhe@angeltrade.com
Param Desai Real Estate, Logistics, Shipping paramv.desai@angeltrade.com
Sageraj Bariya Fertiliser, Mid-cap sageraj.bariya@angeltrade.com
Viraj Nadkarni Retail, Hotels, Mid-cap virajm.nadkarni@angeltrade.com
Paresh Jain Metals & Mining pareshn.jain@angeltrade.com
Amit Rane Banking amitn.rane@angeltrade.com
Jai Sharda Mid-cap jai.sharda@angeltrade.com
Sharan Lillaney Mid-cap sharanb.lillaney@angeltrade.com
Amit Vora Research Associate (Oil & Gas) amit.vora@angeltrade.com
V Srinivasan Research Associate (Cement, Power) v.srinivasan@angeltrade.com
Aniruddha Mate Research Associate (Infra, Real Estate) aniruddha.mate@angeltrade.com
Mihir Salot Research Associate (Logistics, Shipping) mihirr.salot@angeltrade.com
Chitrangda Kapur Research Associate (FMCG, Media) chitrangdar.kapur@angeltrade.com
Vibha Salvi Research Associate (IT, Telecom) vibhas.salvi@angeltrade.com
Pooja Jain Research Associate (Metals & Mining) pooja.j@angeltrade.com
Technicals:
Shardul Kulkarni Sr. Technical Analyst shardul.kulkarni@angeltrade.com
Mileen Vasudeo Technical Analyst vasudeo.kamalakant@angeltrade.com
Derivatives:
Siddarth Bhamre Head - Derivatives siddarth.bhamre@angeltrade.com
Jaya Agarwal Derivative Analyst jaya.agarwal@angeltrade.com
Institutional Sales Team:
Mayuresh Joshi VP - Institutional Sales mayuresh.joshi@angeltrade.com
Abhimanyu Sofat AVP - Institutional Sales abhimanyu.sofat@angeltrade.com
Nitesh Jalan Sr. Manager niteshk.jalan@angeltrade.com
Pranav Modi Sr. Manager pranavs.modi@angeltrade.com
Sandeep Jangir Sr. Manager sandeepp.jangir@angeltrade.com
Ganesh Iyer Sr. Manager ganeshb.Iyer@angeltrade.com
Jay Harsora Sr. Dealer jayr.harsora@angeltrade.com
Meenakshi Chavan Dealer meenakshis.chavan@angeltrade.com
Gaurang Tisani Dealer gaurangp.tisani@angeltrade.com
Production Team:
Bharathi Shetty Research Editor bharathi.shetty@angeltrade.com
Bharat Patil Production bharat.patil@angeltrade.com
Dilip Patel Production dilipm.patel@angeltrade.com
For Private Circulation Only.