BEST Call Girls In BELLMONT HOTEL ✨ 9773824855 ✨ Escorts Service In Delhi Ncr,
Derivatives report 17 may-2010
1. Derivative Report
India Research
May 17, 2010
Comments
Nifty Vs OI
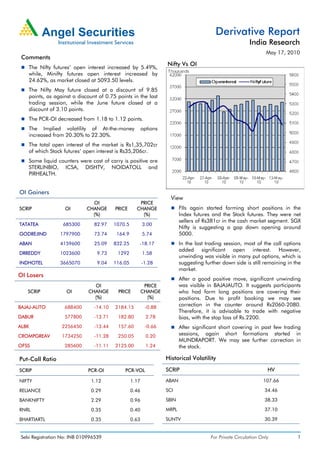
The Nifty futures’ open interest increased by 5.49%,
while, Minifty futures open interest increased by
24.62%, as market closed at 5093.50 levels.
The Nifty May future closed at a discount of 9.85
points, as against a discount of 0.75 points in the last
trading session, while the June future closed at a
discount of 3.10 points.
The PCR-OI decreased from 1.18 to 1.12 points.
The Implied volatility of At-the-money options
increased from 20.30% to 22.30%.
The total open interest of the market is Rs1,35,702cr
of which Stock futures’ open interest is Rs35,206cr.
Some liquid counters were cost of carry is positive are
STERLINBIO, ICSA, DISHTV, NOIDATOLL and
PIRHEALTH.
OI Gainers
View
OI PRICE
SCRIP OI CHANGE PRICE CHANGE FIIs again started forming short positions in the
(%) (%) Index futures and the Stock futures. They were net
sellers of Rs381cr in the cash market segment. SGX
TATATEA 685300 82.97 1070.5 3.00
Nifty is suggesting a gap down opening around
GODREJIND 1797900 73.74 164.9 5.74 5000.
ABAN 4159600 25.09 832.25 -18.17 In the last trading session, most of the call options
added significant open interest. However,
DRREDDY 1023600 9.73 1292 1.58
unwinding was visible in many put options, which is
INDHOTEL 3665070 9.04 116.05 -1.28 suggesting further down side is still remaining in the
market.
OI Losers
After a good positive move, significant unwinding
OI PRICE was visible in BAJAJAUTO. It suggests participants
SCRIP OI CHANGE PRICE CHANGE who had form long positions are covering their
(%) (%) positions. Due to profit booking we may see
BAJAJ-AUTO 688400 -14.10 2184.15 -0.88
correction in the counter around Rs2060-2080.
Therefore, it is advisable to trade with negative
DABUR 577800 -13.71 182.80 2.78 bias, with the stop loss of Rs.2200.
ALBK 2256450 -13.44 157.60 -0.66 After significant short covering in past few trading
CROMPGREAV 1734250 -11.28 250.05 0.20 sessions, again short formations started in
MUNDRAPORT. We may see further correction in
OFSS 285600 -11.11 2125.00 1.24 the stock.
Put-Call Ratio Historical Volatility
SCRIP PCR-OI PCR-VOL SCRIP HV
NIFTY 1.12 1.17 ABAN 107.66
RELIANCE 0.29 0.46 SCI 34.46
BANKNIFTY 2.29 0.96 SBIN 38.33
RNRL 0.35 0.40 MRPL 37.10
BHARTIARTL 0.35 0.63 SUNTV 30.39
Sebi Registration No: INB 010996539 For Private Circulation Only 1
2. Derivative Report | India Research
FII Statistics for 14-May-2010 Turnover on 14-May-2010
Open Interest
No. of Turnover Change
Detail Buy Sell Net Instrument
Contracts (Rs. in cr.) (%)
Contracts Value Change
(Rs. in cr.) (%)
INDEX Index Futures 733349 17444.07 31.92
1791.51 3215.85 (1,424.34) 550546 13971.12 11.91
FUTURES
INDEX Stock Futures 527496 17387.96 9.48
5938.81 6094.50 (155.69) 1898665 48330.03 4.05
OPTIONS
STOCK Index Options 2337596 60592.64 36.26
1466.10 1895.34 (429.24) 1019329 29324.33 1.38
FUTURES
STOCK Stock Options 116768 4032.74 16.66
267.76 305.88 (38.12) 41838 1272.86 -0.30
OPTIONS
TOTAL 9464.18 11511.57 (2,047.39) 3510378 92898.33 4.34 Total 3715209 99457.41 29.11
Nifty Spot = 5093.50 Lot Size = 50
Bull-Call Spreads Bear-Put Spreads
Action Strike Price Risk Reward BEP Action Strike Price Risk Reward BEP
Buy 5100 77.15 Buy 5000 60.50
41.85 58.15 5141.85 24.00 76.00 4976.00
Sell 5200 35.30 Sell 4900 36.50
Buy 5100 77.15 Buy 5000 60.50
65.00 135.00 5165.00 39.85 160.15 4960.15
Sell 5300 12.15 Sell 4800 20.65
Buy 5200 35.30 Buy 4900 36.50
23.15 76.85 5223.15 15.85 84.15 4884.15
Sell 5300 12.15 Sell 4800 20.65
Note: Above mentioned Bullish or Bearish Spreads in Nifty (May Series) are given as an information and not as a recommendation
Nifty Put-Call Analysis
For Private Circulation Only Sebi Registration No: INB 010996539 2
3. Derivative Report | India Research
Strategy Date Scrip Strategy Status
30-04-2010 RELCAPITAL Long Call Ladder Continue
30-04-2010 NAGARFERT Long Call Continue
08-05-2010 HINDUNILVR Short Strangle Continue
DISCLAIMER:
This document is not for public distribution and has been furnished to you solely for your information and must not be reproduced or redistributed to any other person.
Persons into whose possession this document may come are required to observe these restrictions.
Opinion expressed is our current opinion as of the date appearing on this material only. While we endeavor to update on a reasonable basis the information discussed in
this material, there may be regulatory, compliance, or other reasons that prevent us from doing so. Prospective investors and others are cautioned that any forward-
looking statements are not predictions and may be subject to change without notice. Our proprietary trading and investment businesses may make investment decisions
that are inconsistent with the recommendations expressed herein.
The information in this document has been printed on the basis of publicly available information, internal data and other reliable sources believed to be true and are for
general guidance only. While every effort is made to ensure the accuracy and completeness of information contained, the company takes no guarantee and assumes no
liability for any errors or omissions of the information. No one can use the information as the basis for any claim, demand or cause of action.
Recipients of this material should rely on their own investigations and take their own professional advice. Each recipient of this document should make such investigations
as it deems necessary to arrive at an independent evaluation of an investment in the securities of companies referred to in this document (including the merits and risks
involved), and should consult their own advisors to determine the merits and risks of such an investment. Price and value of the investments referred to in this material may
go up or down. Past performance is not a guide for future performance.
Certain transactions - futures, options and other derivatives as well as non-investment grade securities - involve substantial risks and are not suitable for all investors.
Reports based on technical analysis centers on studying charts of a stock's price movement and trading volume, as opposed to focusing on a company's fundamentals and
as such, may not match with a report on a company's fundamentals.
We do not undertake to advise you as to any change of our views expressed in this document. While we would endeavor to update the information herein on a reasonable
basis, Angel Broking, its subsidiaries and associated companies, their directors and employees are under no obligation to update or keep the information current. Also
there may be regulatory, compliance, or other reasons that may prevent Angel Broking and affiliates from doing so. Prospective investors and others are cautioned that
any forward-looking statements are not predictions and may be subject to change without notice.
Angel Broking Limited and affiliates, including the analyst who has issued this report, may, on the date of this report, and from time to time, have long or short positions
in, and buy or sell the securities of the companies mentioned herein or engage in any other transaction involving such securities and earn brokerage or compensation or
act as advisor or have other potential conflict of interest with respect to company/ies mentioned herein or inconsistent with any recommendation and related information
and opinions.
Angel Broking Limited and affiliates may seek to provide or have engaged in providing corporate finance, investment banking or other advisory services in a merger or
specific transaction to the companies referred to in this report, as on the date of this report or in the past.
Sebi Registration No.: INB 010996539
Derivative Research Team derivatives.desk@angeltrade.com
For Private Circulation Only Sebi Registration No: INB 010996539 3