The Path to Product Excellence: Avoiding Common Pitfalls and Enhancing Commun...
Derivatives report 01 june-2010
1. Derivative Report
India Research
June 01, 2010
Comments
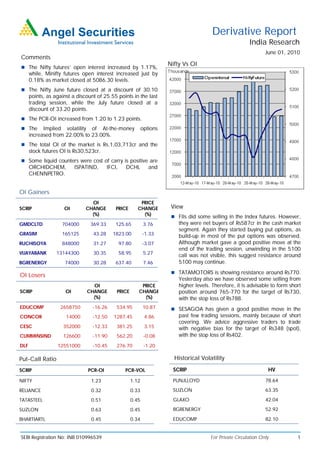
Nifty Vs OI
The Nifty futures’ open interest increased by 1.17%,
while, Minifty futures open interest increased just by
0.18% as market closed at 5086.30 levels.
The Nifty June future closed at a discount of 30.10
points, as against a discount of 25.55 points in the last
trading session, while the July future closed at a
discount of 33.20 points.
The PCR-OI increased from 1.20 to 1.23 points.
The Implied volatility of At-the-money options
increased from 22.00% to 23.00%.
The total OI of the market is Rs.1,03,713cr and the
stock futures OI is Rs30,523cr.
Some liquid counters were cost of carry is positive are
ORCHIDCHEM, ISPATIND, IFCI, DCHL and
CHENNPETRO.
OI Gainers
OI PRICE
SCRIP OI CHANGE PRICE CHANGE View
(%) (%)
FIIs did some selling in the Index futures. However,
GMDCLTD 704000 369.33 125.65 3.76 they were net buyers of Rs587cr in the cash market
segment. Again they started buying put options, as
GRASIM 165125 43.28 1823.00 -1.33 build-up in most of the put options was observed.
RUCHISOYA 848000 31.27 97.80 -3.07 Although market gave a good positive move at the
end of the trading session, unwinding in the 5100
VIJAYABANK 13144300 30.35 58.95 5.27
call was not visible, this suggest resistance around
BGRENERGY 74000 30.28 637.40 7.46 5100 may continue.
TATAMOTORS is showing resistance around Rs770.
OI Losers
Yesterday also we have observed some selling from
OI PRICE higher levels. Therefore, it is advisable to form short
SCRIP OI CHANGE PRICE CHANGE position around 765-770 for the target of Rs730,
(%) (%) with the stop loss of Rs788.
EDUCOMP 2658750 -16.26 534.95 10.87 SESAGOA has given a good positive move in the
CONCOR 14000 -12.50 1287.45 4.86 past few trading sessions, mainly because of short
covering. We advice aggressive traders to trade
CESC 352000 -12.33 381.25 3.15 with negative bias for the target of Rs348 (spot),
CUMMINSIND 126600 -11.90 562.20 -0.08 with the stop loss of Rs402.
DLF 12551000 -10.45 276.70 -1.20
Put-Call Ratio Historical Volatility
SCRIP PCR-OI PCR-VOL SCRIP HV
NIFTY 1.23 1.12 PUNJLLOYD 78.64
RELIANCE 0.32 0.33 SUZLON 63.35
TATASTEEL 0.51 0.45 GLAXO 42.04
SUZLON 0.63 0.45 BGRENERGY 52.92
BHARTIARTL 0.45 0.34 EDUCOMP 82.10
SEBI Registration No: INB 010996539 For Private Circulation Only 1
2. Derivative Report | India Research
FII Statistics for 31-May-2010 Turnover on 31-May-2010
Open Interest
No. of Turnover Change
Detail Buy Sell Net Instrument
Contracts (Rs. in cr.) (%)
Contracts Value Change
(Rs. in cr.) (%)
INDEX Index Futures 515065 12024.79 -14.41
1193.97 1580.63 (386.66) 495172 12456.88 0.12
FUTURES
INDEX Stock Futures 444469 13689.13 -15.88
4760.77 3466.40 1,294.37 1513843 38498.29 4.61
OPTIONS
STOCK Index Options 1353625 34277.95 -4.16
1016.59 834.84 181.75 891879 25268.80 1.26
FUTURES
STOCK Stock Options 74319 2514.48 0.44
191.40 249.89 (58.49) 15564 507.05 24.57
OPTIONS
TOTAL 7162.73 6131.76 1,030.97 2916458 76731.02 2.87 Total 2387478 62506.35 -8.87
Nifty Spot = 5086.30 Lot Size = 50
Bull-Call Spreads Bear-Put Spreads
Action Strike Price Risk Reward BEP Action Strike Price Risk Reward BEP
Buy 5100 98.65 Buy 5000 102.40
43.75 56.25 5143.75 28.25 71.75 4971.75
Sell 5200 54.90 Sell 4900 74.15
Buy 5100 98.65 Buy 5000 102.40
72.40 127.60 5172.40 49.00 151.00 4951.00
Sell 5300 26.25 Sell 4800 53.40
Buy 5200 54.90 Buy 4900 74.15
28.65 71.35 5228.65 20.75 79.25 4879.25
Sell 5300 26.25 Sell 4800 53.40
Note: Above mentioned Bullish or Bearish Spreads in Nifty (June Series) are given as an information and not as a recommendation
Nifty Put-Call Analysis
For Private Circulation Only SEBI Registration No: INB 010996539 2
3. Derivative Report | India Research
Strategy Date Scrip Strategy Status
31-May-2010 Nifty Long Put Ladder Continue
DISCLAIMER:
This document is not for public distribution and has been furnished to you solely for your information and must not be reproduced or redistributed to any other person.
Persons into whose possession this document may come are required to observe these restrictions.
Opinion expressed is our current opinion as of the date appearing on this material only. While we endeavor to update on a reasonable basis the information discussed in
this material, there may be regulatory, compliance, or other reasons that prevent us from doing so. Prospective investors and others are cautioned that any forward-
looking statements are not predictions and may be subject to change without notice. Our proprietary trading and investment businesses may make investment decisions
that are inconsistent with the recommendations expressed herein.
The information in this document has been printed on the basis of publicly available information, internal data and other reliable sources believed to be true and are for
general guidance only. While every effort is made to ensure the accuracy and completeness of information contained, the company takes no guarantee and assumes no
liability for any errors or omissions of the information. No one can use the information as the basis for any claim, demand or cause of action.
Recipients of this material should rely on their own investigations and take their own professional advice. Each recipient of this document should make such investigations
as it deems necessary to arrive at an independent evaluation of an investment in the securities of companies referred to in this document (including the merits and risks
involved), and should consult their own advisors to determine the merits and risks of such an investment. Price and value of the investments referred to in this material may
go up or down. Past performance is not a guide for future performance.
Certain transactions - futures, options and other derivatives as well as non-investment grade securities - involve substantial risks and are not suitable for all investors.
Reports based on technical analysis centers on studying charts of a stock's price movement and trading volume, as opposed to focusing on a company's fundamentals and
as such, may not match with a report on a company's fundamentals.
We do not undertake to advise you as to any change of our views expressed in this document. While we would endeavor to update the information herein on a reasonable
basis, Angel Broking, its subsidiaries and associated companies, their directors and employees are under no obligation to update or keep the information current. Also
there may be regulatory, compliance, or other reasons that may prevent Angel Broking and affiliates from doing so. Prospective investors and others are cautioned that
any forward-looking statements are not predictions and may be subject to change without notice.
Angel Broking Limited and affiliates, including the analyst who has issued this report, may, on the date of this report, and from time to time, have long or short positions
in, and buy or sell the securities of the companies mentioned herein or engage in any other transaction involving such securities and earn brokerage or compensation or
act as advisor or have other potential conflict of interest with respect to company/ies mentioned herein or inconsistent with any recommendation and related information
and opinions.
Angel Broking Limited and affiliates may seek to provide or have engaged in providing corporate finance, investment banking or other advisory services in a merger or
specific transaction to the companies referred to in this report, as on the date of this report or in the past.
Sebi Registration No.: INB 010996539
Derivative Research Team derivatives.desk@angeltrade.com
For Private Circulation Only SEBI Registration No: INB 010996539 3