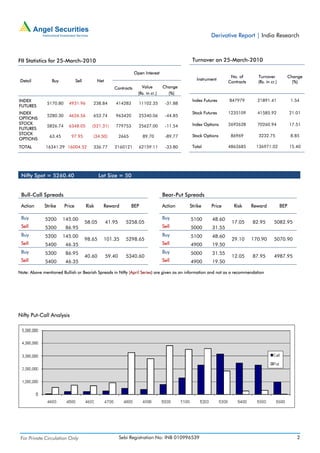
Download to read offline
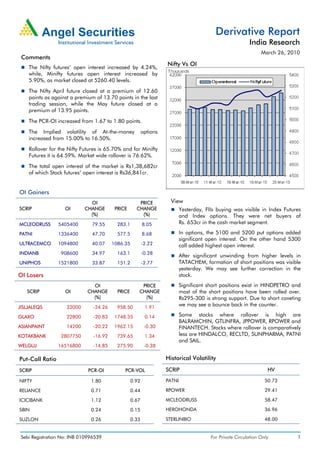
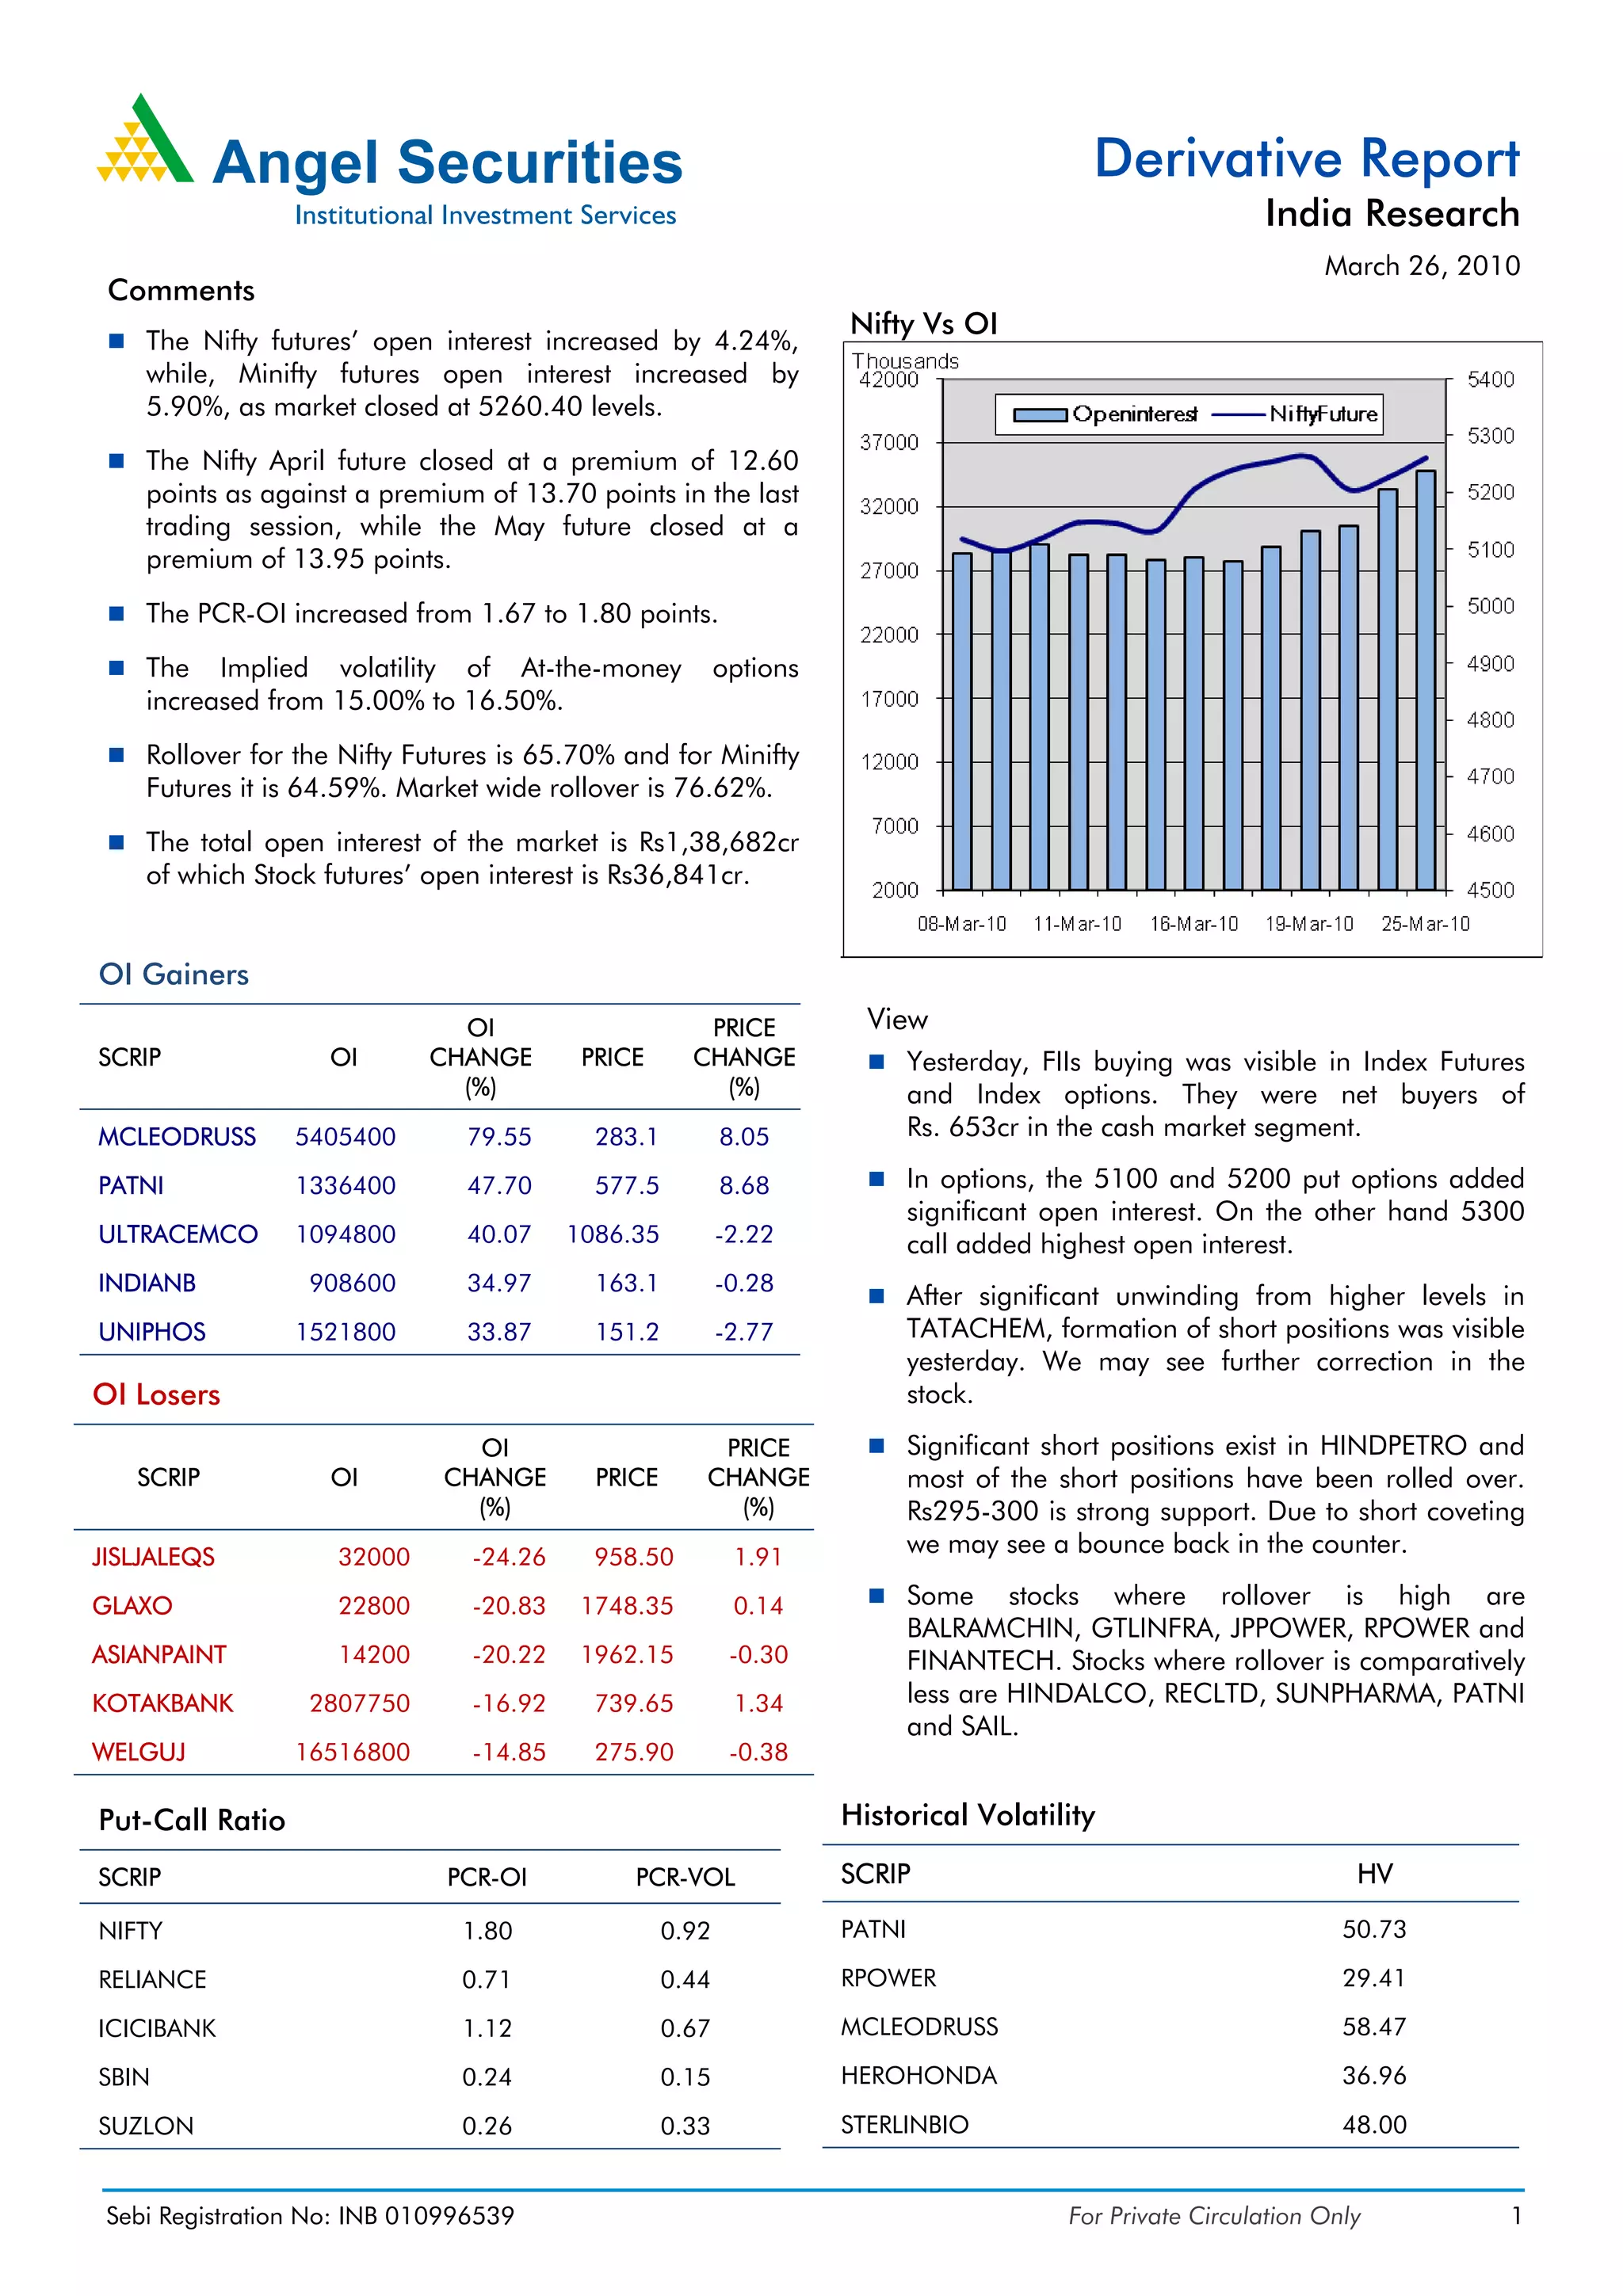

The summary provides an overview of key information from the derivative report on the Indian market from March 26, 2010: - Nifty futures open interest increased 4.24% while Minifty futures open interest rose 5.90% as the market closed at 5260.40. - The PCR-OI for Nifty increased from 1.67 to 1.80. Implied volatility of at-the-money options rose from 15% to 16.50%. - Significant short positions exist in stocks like HINDPETRO and most short positions have been rolled over. Support at Rs295-300 may lead to a bounce back. - FII were net buyers of Rs.653cr in


