1. Derivative Report
India Research
April 08, 2010
Comments
Nifty Vs OI
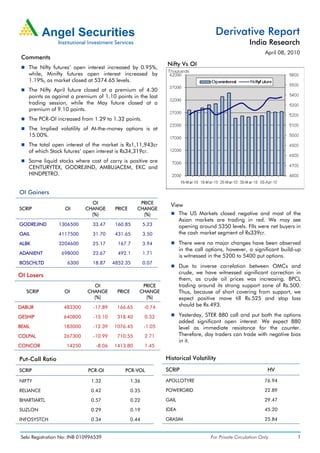
The Nifty futures’ open interest increased by 0.95%,
while, Minifty futures open interest increased by
1.19%, as market closed at 5374.65 levels.
The Nifty April future closed at a premium of 4.30
points as against a premium of 1.10 points in the last
trading session, while the May future closed at a
premium of 9.10 points.
The PCR-OI increased from 1.29 to 1.32 points.
The Implied volatility of At-the-money options is at
15.00%.
The total open interest of the market is Rs1,11,943cr
of which Stock futures’ open interest is Rs34,319cr.
Some liquid stocks where cost of carry is positive are
CENTURYTEX, GODREJIND, AMBUJACEM, EKC and
HINDPETRO.
OI Gainers
OI PRICE
View
SCRIP OI CHANGE PRICE CHANGE
(%) (%) The US Markets closed negative and most of the
Asian markets are trading in red. We may see
GODREJIND 1306500 33.47 160.85 5.23 opening around 5350 levels. FIIs were net buyers in
GAIL 4117500 31.70 431.65 3.50 the cash market segment of Rs339cr.
ALBK 3204600 25.17 167.7 3.94 There were no major changes have been observed
in the call options, however, a significant build-up
ADANIENT 698000 23.67 492.1 1.71
is witnessed in the 5200 to 5400 put options.
BOSCHLTD 6300 18.87 4852.35 0.07
Due to inverse correlation between OMCs and
crude, we have witnessed significant correction in
OI Losers
them, as crude oil prices was increasing. BPCL
OI PRICE trading around its strong support zone of Rs.500.
SCRIP OI CHANGE PRICE CHANGE Thus, because of short covering from support, we
(%) (%) expect positive move till Rs.525 and stop loss
DABUR 483300 -17.89 166.65 -0.74 should be Rs.493.
GESHIP 640800 -15.10 318.40 0.33 Yesterday, STER 880 call and put both the options
added significant open interest. We expect 880
BEML 183000 -12.39 1076.45 -1.05 level as immediate resistance for the counter.
COLPAL 267300 -10.99 710.55 2.71 Therefore, day traders can trade with negative bias
in it.
CONCOR 14250 -8.06 1413.80 1.45
Put-Call Ratio Historical Volatility
SCRIP PCR-OI PCR-VOL SCRIP HV
NIFTY 1.32 1.36 APOLLOTYRE 76.94
RELIANCE 0.42 0.35 POWERGRID 22.89
BHARTIARTL 0.57 0.22 GAIL 29.47
SUZLON 0.29 0.19 IDEA 45.20
INFOSYSTCH 0.34 0.44 GRASIM 25.84
Sebi Registration No: INB 010996539 For Private Circulation Only 1
2. Derivative Report | India Research
FII Statistics for 07-April-2010 Turnover on 07-April-2010
Open Interest
No. of Turnover Change
Detail Buy Sell Net Instrument
Contracts (Rs. in cr.) (%)
Contracts Value Change
(Rs. in cr.) (%)
INDEX Index Futures 389460 10266.59 30.75
628.59 749.37 (120.78) 512594 13941.97 -0.23
FUTURES
INDEX Stock Futures 466559 16765.50 2.21
4106.22 2846.40 1,259.82 1325803 35654.67 -0.15
OPTIONS
STOCK Index Options 1235166 32948.48 23.69
1104.33 1143.12 (38.80) 861993 29177.80 0.29
FUTURES
STOCK Stock Options 87255 3190.85 17.21
187.90 110.08 77.82 16761 533.71 18.03
OPTIONS
TOTAL 6027.03 4848.97 1,178.06 2717151 79308.16 0.07 Total 2178440 63171.42 17.82
Nifty Spot = 5374.65 Lot Size = 50
Bull-Call Spreads Bear-Put Spreads
Action Strike Price Risk Reward BEP Action Strike Price Risk Reward BEP
Buy 5400 64.50 Buy 5300 49.90
38.75 61.25 5438.75 22.10 77.90 5277.90
Sell 5500 25.75 Sell 5200 27.80
Buy 5400 64.50 Buy 5300 49.90
56.95 143.05 5456.95 34.45 165.55 5265.55
Sell 5600 7.55 Sell 5100 15.45
Buy 5500 25.75 Buy 5200 27.80
18.20 81.80 5518.20 12.35 87.65 5187.65
Sell 5600 7.55 Sell 5100 15.45
Note: Above mentioned Bullish or Bearish Spreads in Nifty (April Series) are given as an information and not as a recommendation
Nifty Put-Call Analysis
For Private Circulation Only Sebi Registration No: INB 010996539 2
3. Derivative Report | India Research
Strategy Date Scrip Strategy Status
29-March-2010 SUZLON Long Call Continue
29-March-2010 IDBI Long Call Profit Booked on 06-Apr-2010
05-April-2010 RNRL Long Call Continue
05-April-2010 HUL Long Put Continue
DISCLAIMER:
This document is not for public distribution and has been furnished to you solely for your information and must not be reproduced or redistributed to any other person.
Persons into whose possession this document may come are required to observe these restrictions.
Opinion expressed is our current opinion as of the date appearing on this material only. While we endeavor to update on a reasonable basis the information discussed in
this material, there may be regulatory, compliance, or other reasons that prevent us from doing so. Prospective investors and others are cautioned that any forward-
looking statements are not predictions and may be subject to change without notice. Our proprietary trading and investment businesses may make investment decisions
that are inconsistent with the recommendations expressed herein.
The information in this document has been printed on the basis of publicly available information, internal data and other reliable sources believed to be true and are for
general guidance only. While every effort is made to ensure the accuracy and completeness of information contained, the company takes no guarantee and assumes no
liability for any errors or omissions of the information. No one can use the information as the basis for any claim, demand or cause of action.
Recipients of this material should rely on their own investigations and take their own professional advice. Each recipient of this document should make such investigations
as it deems necessary to arrive at an independent evaluation of an investment in the securities of companies referred to in this document (including the merits and risks
involved), and should consult their own advisors to determine the merits and risks of such an investment. Price and value of the investments referred to in this material may
go up or down. Past performance is not a guide for future performance.
Certain transactions - futures, options and other derivatives as well as non-investment grade securities - involve substantial risks and are not suitable for all investors.
Reports based on technical analysis centers on studying charts of a stock's price movement and trading volume, as opposed to focusing on a company's fundamentals and
as such, may not match with a report on a company's fundamentals.
We do not undertake to advise you as to any change of our views expressed in this document. While we would endeavor to update the information herein on a reasonable
basis, Angel Broking, its subsidiaries and associated companies, their directors and employees are under no obligation to update or keep the information current. Also
there may be regulatory, compliance, or other reasons that may prevent Angel Broking and affiliates from doing so. Prospective investors and others are cautioned that
any forward-looking statements are not predictions and may be subject to change without notice.
Angel Broking Limited and affiliates, including the analyst who has issued this report, may, on the date of this report, and from time to time, have long or short positions
in, and buy or sell the securities of the companies mentioned herein or engage in any other transaction involving such securities and earn brokerage or compensation or
act as advisor or have other potential conflict of interest with respect to company/ies mentioned herein or inconsistent with any recommendation and related information
and opinions.
Angel Broking Limited and affiliates may seek to provide or have engaged in providing corporate finance, investment banking or other advisory services in a merger or
specific transaction to the companies referred to in this report, as on the date of this report or in the past.
Sebi Registration No.: INB 010996539
Derivative Research Team derivatives.desk@angeltrade.com
For Private Circulation Only Sebi Registration No: INB 010996539 3