1. Derivative Report
India Research
Comments June 22, 2010
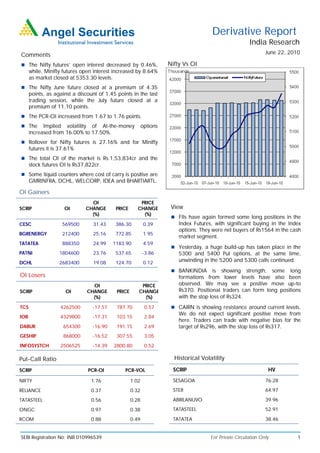
The Nifty futures’ open interest decreased by 0.46%, Nifty Vs OI
while, Minifty futures open interest increased by 8.64%
as market closed at 5353.30 levels.
The Nifty June future closed at a premium of 4.35
points, as against a discount of 1.45 points in the last
trading session, while the July future closed at a
premium of 11.10 points.
The PCR-OI increased from 1.67 to 1.76 points.
The Implied volatility of At-the-money options
increased from 16.00% to 17.50%.
Rollover for Nifty futures is 27.16% and for Minifty
futures it is 37.61%
The total OI of the market is Rs.1,53,834cr and the
stock futures OI is Rs37,822cr.
Some liquid counters where cost of carry is positive are
GMRINFRA, DCHL, WELCORP, IDEA and BHARTIARTL.
OI Gainers
OI PRICE
SCRIP OI CHANGE PRICE CHANGE View
(%) (%)
FIIs have again formed some long positions in the
CESC 569500 31.43 386.30 0.39 Index Futures, with significant buying in the Index
options. They were net buyers of Rs1564 in the cash
BGRENERGY 212400 25.16 772.85 1.95
market segment.
TATATEA 888350 24.99 1183.90 4.59
Yesterday, a huge build-up has taken place in the
PATNI 1804600 23.76 537.65 -3.86 5300 and 5400 Put options, at the same time,
DCHL 2683400 19.08 124.70 0.12
unwinding in the 5200 and 5300 calls continued.
BANKINDIA is showing strength, some long
OI Losers formations from lower levels have also been
OI PRICE observed. We may see a positive move up-to
SCRIP OI CHANGE PRICE CHANGE Rs370. Positional traders can form long positions
(%) (%) with the stop loss of Rs324.
TCS 4262500 -17.51 787.70 0.57 CAIRN is showing resistance around current levels.
We do not expect significant positive move from
IOB 4329800 -17.31 103.15 2.84
here. Traders can trade with negative bias for the
DABUR 654300 -16.90 191.15 2.69 target of Rs296, with the stop loss of Rs317.
GESHIP 868000 -16.52 307.55 3.05
INFOSYSTCH 2506525 -14.39 2800.80 0.52
Put-Call Ratio Historical Volatility
SCRIP PCR-OI PCR-VOL SCRIP HV
NIFTY 1.76 1.02 SESAGOA 76.28
RELIANCE 0.37 0.32 STER 64.97
TATASTEEL 0.56 0.28 ABIRLANUVO 39.96
ONGC 0.97 0.38 TATASTEEL 52.91
RCOM 0.88 0.49 TATATEA 38.46
SEBI Registration No: INB 010996539 For Private Circulation Only 1
2. Derivative Report | India Research
FII Statistics for 21-June-2010 Turnover on 21-June-2010
Open Interest
No. of Turnover Change
Detail Buy Sell Net Instrument
Contracts (Rs. in cr.) (%)
Contracts Value Change
(Rs. in cr.) (%)
INDEX Index Futures 720715 18146.68 21.86
3587.25 3161.73 425.52 592670 15782.40 3.99
FUTURES
INDEX Stock Futures 871065 25841.14 17.93
7541.99 6450.49 1,091.50 2206206 59016.39 4.35
OPTIONS
STOCK Index Options 2725795 72042.41 25.36
5577.81 5773.31 (195.50) 1084981 30812.40 0.18
FUTURES
STOCK Stock Options 114074 3738.96 -14.65
245.11 245.96 (0.85) 47701 1587.75 0.01
OPTIONS
TOTAL 16952.16 15631.49 1,320.67 3931558 107198.94 3.06 Total 4431649 119769.19 21.40
Nifty Spot = 5353.30 Lot Size = 50
Bull-Call Spreads Bear-Put Spreads
Action Strike Price Risk Reward BEP Action Strike Price Risk Reward BEP
Buy 5400 19.65 Buy 5300 16.55
17.45 82.55 5417.45 11.75 88.25 5288.25
Sell 5500 2.20 Sell 5200 4.80
Buy 5400 19.65 Buy 5300 16.55
19.25 180.75 5419.25 14.10 185.90 5285.90
Sell 5600 0.40 Sell 5100 2.45
Buy 5500 2.20 Buy 5200 4.80
1.80 98.20 5501.80 2.35 97.65 5197.65
Sell 5600 0.40 Sell 5100 2.45
Note: Above mentioned Bullish or Bearish Spreads in Nifty (June Series) are given as an information and not as a recommendation
Nifty Put-Call Analysis
For Private Circulation Only SEBI Registration No: INB 010996539 2
3. Derivative Report | India Research
Strategy Date Scrip Strategy Status
31-May-2010 Nifty Long Put Ladder Continue
07-Jun-2010 HINDUNILVR Ratio Put Spread Continue
07-Jun-2010 RCOM Ratio Put Spread Continue
14-Jun-2010 HINDALCO Ratio Call Spread Continue
14-Jun-2010 LT Short Straddle Loss Booked on 17-Jun-2010
21-Jun-2010 ICICIBANK Long Put Did not trigger
21-Jun-2010 ASHOKLEY Long Call Continue
DISCLAIMER:
This document is not for public distribution and has been furnished to you solely for your information and must not be reproduced or redistributed to any other person.
Persons into whose possession this document may come are required to observe these restrictions.
Opinion expressed is our current opinion as of the date appearing on this material only. While we endeavor to update on a reasonable basis the information discussed in
this material, there may be regulatory, compliance, or other reasons that prevent us from doing so. Prospective investors and others are cautioned that any forward-
looking statements are not predictions and may be subject to change without notice. Our proprietary trading and investment businesses may make investment decisions
that are inconsistent with the recommendations expressed herein.
The information in this document has been printed on the basis of publicly available information, internal data and other reliable sources believed to be true and are for
general guidance only. While every effort is made to ensure the accuracy and completeness of information contained, the company takes no guarantee and assumes no
liability for any errors or omissions of the information. No one can use the information as the basis for any claim, demand or cause of action.
Recipients of this material should rely on their own investigations and take their own professional advice. Each recipient of this document should make such investigations
as it deems necessary to arrive at an independent evaluation of an investment in the securities of companies referred to in this document (including the merits and risks
involved), and should consult their own advisors to determine the merits and risks of such an investment. Price and value of the investments referred to in this material may
go up or down. Past performance is not a guide for future performance.
Certain transactions - futures, options and other derivatives as well as non-investment grade securities - involve substantial risks and are not suitable for all investors.
Reports based on technical analysis centers on studying charts of a stock's price movement and trading volume, as opposed to focusing on a company's fundamentals and
as such, may not match with a report on a company's fundamentals.
We do not undertake to advise you as to any change of our views expressed in this document. While we would endeavor to update the information herein on a reasonable
basis, Angel Broking, its subsidiaries and associated companies, their directors and employees are under no obligation to update or keep the information current. Also
there may be regulatory, compliance, or other reasons that may prevent Angel Broking and affiliates from doing so. Prospective investors and others are cautioned that
any forward-looking statements are not predictions and may be subject to change without notice.
Angel Broking Limited and affiliates, including the analyst who has issued this report, may, on the date of this report, and from time to time, have long or short positions
in, and buy or sell the securities of the companies mentioned herein or engage in any other transaction involving such securities and earn brokerage or compensation or
act as advisor or have other potential conflict of interest with respect to company/ies mentioned herein or inconsistent with any recommendation and related information
and opinions.
Angel Broking Limited and affiliates may seek to provide or have engaged in providing corporate finance, investment banking or other advisory services in a merger or
specific transaction to the companies referred to in this report, as on the date of this report or in the past.
Sebi Registration No.: INB 010996539
Derivative Research Team derivatives.desk@angeltrade.com
For Private Circulation Only SEBI Registration No: INB 010996539 3