BPPG response - Options for Defined Benefit schemes - 19Apr24.pdf
Derivatives Report - September 2, 2010
1. Derivative Report
India Research
Sep 02, 2010
Comments
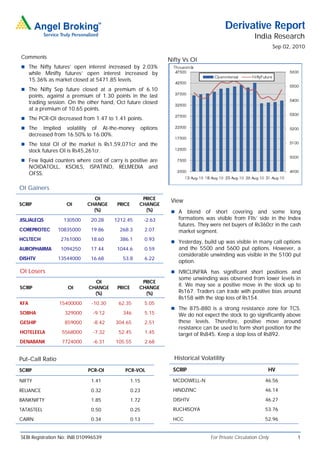
Nifty Vs OI
The Nifty futures’ open interest increased by 2.03%
while Minifty futures’ open interest increased by
15.36% as market closed at 5471.85 levels.
The Nifty Sep future closed at a premium of 6.10
points, against a premium of 1.30 points in the last
trading session. On the other hand, Oct future closed
at a premium of 10.65 points.
The PCR-OI decreased from 1.47 to 1.41 points.
The Implied volatility of At-the-money options
decreased from 16.50% to 16.00%.
The total OI of the market is Rs1,59,071cr and the
stock futures OI is Rs45,261cr.
Few liquid counters where cost of carry is positive are
NOIDATOLL, KSOILS, ISPATIND, RELMEDIA and
OFSS.
OI Gainers
OI PRICE
View
SCRIP OI CHANGE PRICE CHANGE
(%) (%) A blend of short covering and some long
JISLJALEQS 130500 20.28 1212.45 -2.63 formations was visible from FIIs’ side in the Index
futures. They were net buyers of Rs360cr in the cash
COREPROTEC 10835000 19.86 268.3 2.07 market segment.
HCLTECH 2761000 18.60 386.1 0.93
Yesterday, build up was visible in many call options
AUROPHARMA 1094250 17.44 1044.6 0.59 and the 5500 and 5600 put options. However, a
considerable unwinding was visible in the 5100 put
DISHTV 13544000 16.68 53.8 6.22
option.
OI Losers IVRCLINFRA has significant short positions and
some unwinding was observed from lower levels in
OI PRICE
it. We may see a positive move in the stock up to
SCRIP OI CHANGE PRICE CHANGE
(%) (%) Rs167. Traders can trade with positive bias around
Rs158 with the stop loss of Rs154.
KFA 15400000 -10.30 62.35 5.05
The 875-880 is a strong resistance zone for TCS.
SOBHA 329000 -9.12 346 5.15 We do not expect the stock to go significantly above
GESHIP 859000 -8.42 304.65 2.51 these levels. Therefore, positive move around
resistance can be used to form short position for the
HOTELEELA 5568000 -7.32 52.45 1.45 target of Rs845. Keep a stop loss of Rs892.
DENABANK 7724000 -6.31 105.55 2.68
Put-Call Ratio Historical Volatility
SCRIP PCR-OI PCR-VOL SCRIP HV
NIFTY 1.41 1.15 MCDOWELL-N 46.56
RELIANCE 0.32 0.23 HINDZINC 46.14
BANKNIFTY 1.85 1.72 DISHTV 46.27
TATASTEEL 0.50 0.25 RUCHISOYA 53.76
CAIRN 0.34 0.13 HCC 52.96
SEBI Registration No: INB 010996539 For Private Circulation Only 1
2. Derivative Report | India Research
FII Statistics for 01-Sep-2010 Turnover on 01-Sep-2010
Open Interest
No. of Turnover Change
Detail Buy Sell Net Instrument
Contracts (Rs. in cr.) (%)
Contracts Value Change
(Rs. in cr.) (%)
INDEX Index Futures 557777 14208.87 -18.98
1843.15 1175.67 667.48 578359 15794.99 0.02
FUTURES
INDEX Stock Futures 596177 17894.35 2.06
4295.44 4534.61 (239.17) 2368987 64811.65 0.74
OPTIONS
STOCK Index Options 2076961 56513.32 -16.28
1395.74 1135.53 260.21 1279170 35338.57 1.42
FUTURES
STOCK Stock Options 113499 3549.34 -0.48
153.03 158.83 (5.81) 23402 648.23 7.18
OPTIONS
TOTAL 7687.35 7004.64 682.71 4249918 116593.45 0.88 Total 3344414 92165.88 -13.17
Nifty Spot = 5471.85 Lot Size = 50
Bull-Call Spreads Bear-Put Spreads
Action Strike Price Risk Reward BEP Action Strike Price Risk Reward BEP
Buy 5500 74.25 Buy 5400 63.90
42.65 57.35 5542.65 22.25 77.75 5377.75
Sell 5600 31.60 Sell 5300 41.65
Buy 5500 74.25 Buy 5400 63.90
64.00 136.00 5564.00 37.55 162.45 5362.45
Sell 5700 10.25 Sell 5200 26.35
Buy 5600 31.60 Buy 5300 41.65
21.35 78.65 5621.35 15.30 84.70 5284.70
Sell 5700 10.25 Sell 5200 26.35
Note: Above mentioned Bullish or Bearish Spreads in Nifty (September Series) are given as an information and not as a recommendation
Nifty Put-Call Analysis
For Private Circulation Only SEBI Registration No: INB 010996539 2
3. Derivative Report | India Research
Strategy Date Scrip Strategy Status
30-Aug-10 RELINFRA Long Call Ladder Continue
DISCLAIMER
This document is solely for the personal information of the recipient, and must not be singularly used as the basis of any investment
decision. Nothing in this document should be construed as investment or financial advice. Each recipient of this document should
make such investigations as they deem necessary to arrive at an independent evaluation of an investment in the securities of the
companies referred to in this document (including the merits and risks involved), and should consult their own advisors to determine
the merits and risks of such an investment.
Angel Broking Limited, its affiliates, directors, its proprietary trading and investment businesses may, from time to time, make
investment decisions that are inconsistent with or contradictory to the recommendations expressed herein. The views contained in this
document are those of the analyst, and the company may or may not subscribe to all the views expressed within.
Reports based on technical and derivative analysis center on studying charts of a stock's price movement, outstanding positions and
trading volume, as opposed to focusing on a company's fundamentals and, as such, may not match with a report on a company's
fundamentals.
The information in this document has been printed on the basis of publicly available information, internal data and other reliable
sources believed to be true, but we do not represent that it is accurate or complete and it should not be relied on as such, as this
document is for general guidance only. Angel Broking or any of its affiliates/ group companies shall not be in any way responsible
for any loss or damage that may arise to any person from any inadvertent error in the information contained in this report. Angel
Broking Limited has not independently verified all the information contained within this document. Accordingly, we cannot testify, nor
make any representation or warranty, express or implied, to the accuracy, contents or data contained within this document. While
Angel Broking Limited endeavours to update on a reasonable basis the information discussed in this material, there may be
regulatory, compliance, or other reasons that prevent us from doing so.
This document is being supplied to you solely for your information, and its contents, information or data may not be reproduced,
redistributed or passed on, directly or indirectly.
Angel Broking Limited and its affiliates may seek to provide or have engaged in providing corporate finance, investment banking or
other advisory services in a merger or specific transaction to the companies referred to in this report, as on the date of this report or
in the past.
Neither Angel Broking Limited, nor its directors, employees or affiliates shall be liable for any loss or damage that may arise from or
in connection with the use of this information.
Note: Please refer to the important `Stock Holding Disclosure' report on the Angel website (Research Section).
Derivative Research Team derivatives.desk@angeltrade.com
For Private Circulation Only SEBI Registration No: INB 010996539 3