Q3 2024 Earnings Conference Call and Webcast Slides
Derivatives report 06 oct-2010
1. Derivative Report
India Research
Oct 06, 2010
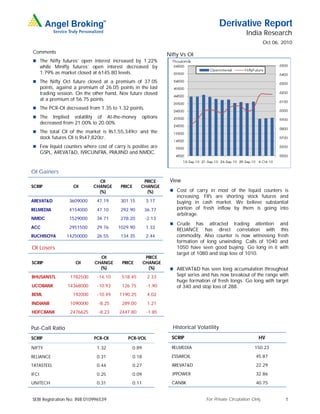
Comments
Nifty Vs OI
The Nifty futures’ open interest increased by 1.22%
while Minifty futures’ open interest decreased by
1.79% as market closed at 6145.80 levels.
The Nifty Oct future closed at a premium of 37.05
points, against a premium of 26.05 points in the last
trading session. On the other hand, Nov future closed
at a premium of 56.75 points.
The PCR-OI decreased from 1.35 to 1.32 points.
The Implied volatility of At-the-money options
decreased from 21.00% to 20.00%.
The total OI of the market is Rs1,55,349cr and the
stock futures OI is Rs47,820cr.
Few liquid counters where cost of carry is positive are
GSPL, AREVAT&D, IVRCLINFRA, PRAJIND and NMDC.
OI Gainers
OI PRICE View
SCRIP OI CHANGE PRICE CHANGE
(%) (%) Cost of carry in most of the liquid counters is
increasing. FII's are shorting stock futures and
AREVAT&D 3609000 47.19 301.15 3.17 buying in cash market. We believe substantial
RELMEDIA 4154000 47.10 292.90 36.77 portion of fresh inflow by them is going into
arbitrage.
NMDC 1529000 34.71 278.20 -2.13
Crude has attracted trading attention and
ACC 2951500 29.76 1029.90 1.33
RELIANCE has direct correlation with this
RUCHISOYA 14250000 26.55 134.35 2.44 commodity. Also counter is now witnessing fresh
formation of long unwinding. Calls of 1040 and
OI Losers 1050 have seen good buying. Go long in it with
target of 1080 and stop loss of 1010.
OI PRICE
SCRIP OI CHANGE PRICE CHANGE
(%) (%) AREVAT&D has seen long accumulation throughout
BHUSANSTL 1782500 -14.10 518.45 2.33 Sept series and has now breakout of the range with
huge formation of fresh longs. Go long with target
UCOBANK 14368000 -10.93 126.75 -1.90 of 340 and stop loss of 288.
BEML 192000 -10.49 1190.25 4.02
INDIANB 1090000 -8.25 289.00 1.21
HDFCBANK 2476625 -8.23 2447.80 -1.85
Put-Call Ratio Historical Volatility
SCRIP PCR-OI PCR-VOL SCRIP HV
NIFTY 1.32 0.89 RELMEDIA 150.23
RELIANCE 0.31 0.18 ESSAROIL 45.87
TATASTEEL 0.44 0.27 AREVAT&D 22.29
IFCI 0.25 0.09 JPPOWER 32.86
UNITECH 0.31 0.11 CANBK 40.75
SEBI Registration No: INB 010996539 For Private Circulation Only 1
2. Derivative Report | India Research
FII Statistics for 05-Oct-2010 Turnover on 05-Oct-2010
Open Interest
No. of Turnover Change
Detail Buy Sell Net Instrument
Contracts (Rs. in cr.) (%)
Contracts Value Change
(Rs. in cr.) (%)
INDEX Index Futures 432430 12722.35 -22.58
975.44 1700.45 (725.01) 527346 16312.03 1.55
FUTURES
INDEX Stock Futures 796597 26076.18 -2.42
2651.89 2430.43 221.46 1879591 57758.75 0.98
OPTIONS
STOCK Index Options 1436887 44505.01 -30.58
1211.08 2387.54 (1176.45) 1342167 41249.53 1.57
FUTURES
STOCK Stock Options 128751 4343.36 -6.77
448.29 472.60 (24.30) 21415 706.87 15.28
OPTIONS
TOTAL 5286.71 6991.01 (1704.30) 3770519 116027.18 1.34 Total 2794665 87646.9 -21.69
Nifty Spot = 6145.80 Lot Size = 50
Bull-Call Spreads Bear-Put Spreads
Action Strike Price Risk Reward BEP Action Strike Price Risk Reward BEP
Buy 6200 116.05 Buy 6100 91.00
45.75 54.25 6245.75 29.30 70.70 6070.70
Sell 6300 70.30 Sell 6000 61.70
Buy 6200 116.05 Buy 6100 91.00
76.15 123.85 6276.15 49.95 150.05 6050.05
Sell 6400 39.90 Sell 5900 41.05
Buy 6300 70.30 Buy 6000 61.70
30.40 69.60 6330.40 20.65 79.35 5979.35
Sell 6400 39.90 Sell 5900 41.05
Note: Above mentioned Bullish or Bearish Spreads in Nifty (October Series) are given as an information and not as a recommendation
Nifty Put-Call Analysis
For Private Circulation Only SEBI Registration No: INB 010996539 2
3. Derivative Report | India Research
Strategy Date Scrip Strategy Status
04-Oct-10 JPASSOCIAT Bull Call Spread Continue
DISCLAIMER
This document is solely for the personal information of the recipient, and must not be singularly used as the basis of any investment
decision. Nothing in this document should be construed as investment or financial advice. Each recipient of this document should
make such investigations as they deem necessary to arrive at an independent evaluation of an investment in the securities of the
companies referred to in this document (including the merits and risks involved), and should consult their own advisors to determine
the merits and risks of such an investment.
Angel Broking Limited, its affiliates, directors, its proprietary trading and investment businesses may, from time to time, make
investment decisions that are inconsistent with or contradictory to the recommendations expressed herein. The views contained in this
document are those of the analyst, and the company may or may not subscribe to all the views expressed within.
Reports based on technical and derivative analysis center on studying charts of a stock's price movement, outstanding positions and
trading volume, as opposed to focusing on a company's fundamentals and, as such, may not match with a report on a company's
fundamentals.
The information in this document has been printed on the basis of publicly available information, internal data and other reliable
sources believed to be true, but we do not represent that it is accurate or complete and it should not be relied on as such, as this
document is for general guidance only. Angel Broking or any of its affiliates/ group companies shall not be in any way responsible
for any loss or damage that may arise to any person from any inadvertent error in the information contained in this report. Angel
Broking Limited has not independently verified all the information contained within this document. Accordingly, we cannot testify, nor
make any representation or warranty, express or implied, to the accuracy, contents or data contained within this document. While
Angel Broking Limited endeavours to update on a reasonable basis the information discussed in this material, there may be
regulatory, compliance, or other reasons that prevent us from doing so.
This document is being supplied to you solely for your information, and its contents, information or data may not be reproduced,
redistributed or passed on, directly or indirectly.
Angel Broking Limited and its affiliates may seek to provide or have engaged in providing corporate finance, investment banking or
other advisory services in a merger or specific transaction to the companies referred to in this report, as on the date of this report or
in the past.
Neither Angel Broking Limited, nor its directors, employees or affiliates shall be liable for any loss or damage that may arise from or
in connection with the use of this information.
Note: Please refer to the important `Stock Holding Disclosure' report on the Angel website (Research Section).
Derivative Research Team derivatives.desk@angeltrade.com
For Private Circulation Only SEBI Registration No: INB 010996539 3