Uneak White's Personal Brand Exploration Presentation
Sun pharma ru4 qfy2010-240510
1. 4QFY2010 Result Update I Pharmaceutical
May 24, 2010
Sun Pharmaceuticals NEUTRAL
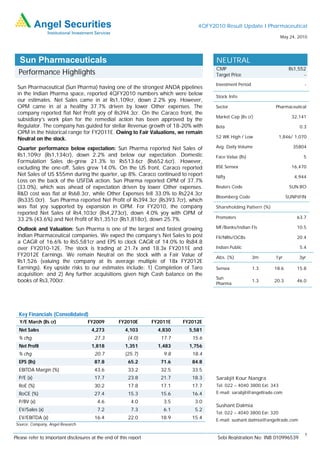
CMP Rs1,552
Performance Highlights Target Price -
Investment Period -
Sun Pharmaceutical (Sun Pharma) having one of the strongest ANDA pipelines
in the Indian Pharma space, reported 4QFY2010 numbers which were below
Stock Info
our estimates. Net Sales came in at Rs1,109cr, down 2.2% yoy. However,
OPM came in at a healthy 37.7% driven by lower Other expenses. The Sector Pharmaceutical
company reported flat Net Profit yoy of Rs394.3cr. On the Caraco front, the
Market Cap (Rs cr) 32,141
subsidiary’s work plan for the remedial action has been approved by the
Regulator. The company has guided for stellar Revenue growth of 18-20% with Beta 0.3
OPM in the historical range for FY2011E. Owing to Fair Valuations, we remain
Neutral on the stock. 52 WK High / Low 1,846/ 1,070
Quarter performance below expectation: Sun Pharma reported Net Sales of Avg. Daily Volume 35804
Rs1,109cr (Rs1,134cr), down 2.2% and below our expectation. Domestic Face Value (Rs) 5
Formulation Sales de-grew 21.3% to Rs513.6cr (Rs652.6cr). However,
excluding the one-off, Sales grew 14.0%. On the US front, Caraco reported BSE Sensex 16,470
Net Sales of US $55mn during the quarter, up 8%. Caraco continued to report Nifty 4,944
Loss on the back of the USFDA action. Sun Pharma reported OPM of 37.7%
(33.0%), which was ahead of expectation driven by lower Other expenses. Reuters Code SUN.BO
R&D cost was flat at Rs68.3cr, while Other Expenses fell 33.0% to Rs224.3cr
Bloomberg Code SUNP@IN
(Rs335.0cr). Sun Pharma reported Net Profit of Rs394.3cr (Rs393.7cr), which
was flat yoy supported by expansion in OPM. For FY2010, the company Shareholding Pattern (%)
reported Net Sales of Rs4,103cr (Rs4,273cr), down 4.0% yoy with OPM of
33.2% (43.6%) and Net Profit of Rs1,351cr (Rs1,818cr), down 25.7%. Promoters 63.7
Outlook and Valuation: Sun Pharma is one of the largest and fastest growing MF/Banks/Indian FIs 10.5
Indian Pharmaceutical companies. We expect the company’s Net Sales to post FII/NRIs/OCBs 20.4
a CAGR of 16.6% to Rs5,581cr and EPS to clock CAGR of 14.0% to Rs84.8
over FY2010-12E. The stock is trading at 21.7x and 18.3x FY2011E and Indian Public 5.4
FY2012E Earnings. We remain Neutral on the stock with a Fair Value of Abs. (%) 3m 1yr 3yr
Rs1,526 (valuing the company at its average multiple of 18x FY2012E
Earnings). Key upside risks to our estimates include: 1) Completion of Taro Sensex 1.3 18.6 15.8
acquisition; and 2) Any further acquisitions given high Cash balance on the
Sun
books of Rs3,700cr. Pharma
1.3 20.3 46.0
Key Financials (Consolidated)
Y/E March (Rs cr) FY2009 FY2010E FY2011E FY2012E
Net Sales 4,273 4,103 4,830 5,581
% chg 27.3 (4.0) 17.7 15.6
Net Profit 1,818 1,351 1,483 1,756
% chg 20.7 (25.7) 9.8 18.4
EPS (Rs) 87.8 65.2 71.6 84.8
EBITDA Margin (%) 43.6 33.2 32.5 33.5
P/E (x) 17.7 23.8 21.7 18.3 Sarabjit Kour Nangra
RoE (%) 30.2 17.8 17.1 17.7 Tel: 022 – 4040 3800 Ext: 343
RoCE (%) 27.4 15.3 15.6 16.4 E-mail: sarabjit@angeltrade.com
P/BV (x) 4.6 4.0 3.5 3.0
Sushant Dalmia
EV/Sales (x) 7.2 7.3 6.1 5.2
Tel: 022 – 4040 3800 Ext: 320
EV/EBITDA (x) 16.4 22.0 18.9 15.4 E-mail: sushant.dalmia@angeltrade.com
Source: Company, Angel Research
1
Please refer to important disclosures at the end of this report Sebi Registration No: INB 010996539
2. Sun Pharma I 4QFY2010 Result Update
Exhibit 1: 4QFY2010 Performance
Y/E March (Rs cr) 4QFY10 4QFY09 % chg FY10 FY09 % chg
Net Sales 1,109 1,134 (2.2) 4,103 4,273 (4.0)
Other Income 13.7 62.7 (78.1) 212.3 214.5 (1.0)
Total Income 1,123 1,197 (6.2) 4,315 4,487 (3.8)
PBIDT 418.5 374.4 11.8 1,362.8 1,864.3 (26.9)
Operating Margin (%) 37.7 33.0 33.2 43.6
Interest 0.0 0.0 0.0 0.0
Depreciation 41.9 35.9 16.8 153.3 123.3 24.3
PBT 390.3 401.1 (2.7) 1,414.8 1,949.5 (27.4)
Provision for Taxation (1.3) (4.5) (71.9) 67.9 71.2 (4.6)
PAT before Extra-ordinary
391.6 405.6 (3.5) 1,346.9 1,878.4 (28.3)
item
Minority Interest(MI) 2.7 (10.9) (4.1) 60.3
PAT after Extra-ordinary
394.3 393.7 0.2 1,351.0 1,818.1 (25.7)
item & MI
EPS (Rs) 19.0 19.0 65.2 87.8
Source: Company, Angel Research
Key Highlights
Revenue below expectation: Sun Pharma reported Net Sales of Rs1,109cr
(Rs1,134cr) down 2.2% and below our expectation. For FY2010, the company
reported Net Sales of Rs4,103cr (Rs4,273cr), down 4.0% yoy. Domestic Formulation
Sales de-grew 21.3% to Rs513.6cr (Rs652.6cr) for the quarter. However, excluding
the one-off, Sales grew 14.0%. The company now holds 3.7% market share. Sun
launched 11 new products during the quarter and a cumulative 49 products in
FY2010. The company has one of highest field force productivity in the industry. As
of FY2010, the company had a field force of 2,500 MRs.
On the US front, during the quarter Caraco reported Net Sales of US $55mn, up
8%. Caraco continued to report Losses following the USFDA action. On the USFDA
issue, Caraco’s remedial action work plan submitted earlier has now been approved
by the Regulator. Sun Pharma along with Caraco now has 123 ANDAs pending
USFDA approval. During the quarter, Sun Pharma filed for 15 ANDAs.
OPM ahead of estimates: Sun Pharma reported OPM of 37.7% (33.0%), which was
ahead of expectation driven by lower Other expenses. R&D cost was flat at Rs68.3cr,
while Other Expenses fell 33.0% to Rs224.3cr (Rs335.0cr). Staff costs for the quarter
stood at Rs116.0cr (119.3cr), down 2.8% yoy. For FY2010, the company reported
OPM of 33.2% (43.6%).
Net Profit flat for the quarter: Sun Pharma reported flat yoy Net Profit of Rs394.3cr
(Rs393.7cr) for the quarter supported by expansion in OPM. The company reported
Other Income of Rs13.7cr (Rs62.7cr), while Depreciation increased 16.8% to
Rs41.9cr (Rs35.9cr). For FY2010, the company reported Net Profit of Rs1,351cr
(Rs1,818cr), down 25.7%.
Takeaways from Analyst Meet
Sun Pharma has guided for a stellar 18-20% growth in Top-line for FY2010 with
OPM in the historic range. Further, the company expects R&D expenses to be in
range of 7-8% of Net Sales and Capex at Rs200cr for FY2011.
The company plans to file 30 ANDAs in FY2011.
On Protonix, the company has stopped shipment of the product in 4QFY2010,
while on Eloxatin the company awaits more clarity from the court regards the
settlement terms.
May 24, 2010 2
3. Sun Pharma I 4QFY2010 Result Update
Outlook and Valuation
Sun Pharma is one of the largest and fastest growing Indian Pharmaceutical
companies. On the Domestic front, it has grown at higher pace by focusing on the
high-Growth and high-Margin Therapeutic Segments of Psychiatry, CNS, CVS,
Ophthalmic and Orthopedic. Sun has a market share of 3.7% and is amongst the
Top-5 players in the Indian market. On the Export front, it has presence in the US
through its subsidiary, Caraco. Sun has one of the strongest ANDA pipelines in the
sector with 123 ANDAs pending approval.
We expect Sun Pharma’s Net Sales to post a CAGR of 16.6% to Rs5,581cr and its
EPS to clock a CAGR of 14.0% to Rs84.8 over FY2010-12E. The stock is trading at
21.7x and 18.3x FY2011E and FY2012E Earnings, respectively. We remain Neutral
on the stock with a Fair Value of Rs1,526 (valuing the company at its average
multiple of 18x FY2012E Earnings).
Key upside risks to our estimates include: 1) Completion of Taro acquisition; and 2)
Any further acquisitions given high Cash balance on the books of Rs3,700cr.
Exhibit 2: One-year forward PE Band
2,500
2,000
25x
1,500 20x
15x
1,000
10x
500
-
Apr-05
Jul-05
Jan-06
Apr-06
Jul-06
Jan-07
Apr-07
Jul-07
Jan-08
Apr-08
Jul-08
Jan-09
Apr-09
Jul-09
Jan-10
Apr-10
Oct-05
Oct-06
Oct-07
Oct-08
Oct-09
Source: C-line, Angel Research
Exhibit 3: Premium/(Discount) of Sun Pharma (PE) to Sensex (PE)
80.0
60.0
40.0
20.0
(%)
0.0
(20.0)
(40.0)
(60.0)
Jul-05
Jan-06
Jul-06
Jan-07
Jul-07
Jan-08
Jul-08
Jan-09
Jul-09
Jan-10
Apr-05
Apr-06
Apr-07
Apr-08
Apr-09
Apr-10
Oct-05
Oct-06
Oct-07
Oct-08
Oct-09
Premium/Disc Avg
Source: C-line, Angel Research
May 24, 2010 3
4. Sun Pharma I 4QFY2010 Result Update
Profit & Loss Statement (Indian GAAP, Consolidated) (Rs cr)
Y/E March FY2007 FY2008 FY2009 FY2010E FY2011E FY2012E
Net Sales 2,079 3,357 4,273 4,103 4,830 5,581
Other operating income 1 2 4 - 3 3
Total operating income 2,080 3,359 4,276 4,103 4,832 5,584
% chg 30.3 61.5 27.3 (4.1) 17.8 15.6
Total Expenditure 1,407 1,805 2,408 2,740 3,261 3,713
Net Raw Materials 577 722 856 1,098 1,261 1,401
Other Mfg costs 106 132 202 - 228 263
Personnel 199 233 340 482 386 447
Other 525 718 1,011 1,160 1,386 1,602
EBITDA 672 1,551 1,864 1,363 1,569 1,869
% chg 37.0 130.7 20.2 (26.9) 15.1 19.1
(% of Net Sales) 32.3 46.2 43.6 33.2 32.5 33.5
Depreciation& Amortisation 81 97 123 153 151 163
EBIT 591 1,454 1,741 1,209 1,418 1,706
% chg 37.7 146.1 19.7 (30.5) 17.2 20.3
(% of Net Sales) 28.4 43.3 40.7 29.5 29.4 30.6
Other Income 242 143 205 205 240 270
(% of PBT) 29.0 8.9 10.5 14.5 14.4 13.6
Recurring PBT 833 1,599 1,950 1,415 1,660 1,979
% chg 39.9 91.9 21.9 (27.4) 17.3 19.2
Extraordinary Expense/(Inc.) - - - - - -
PBT (reported) 833 1,599 1,950 1,415 1,660 1,979
Tax (6.7) 48.5 71.2 67.9 131.6 168.3
(% of PBT) (0.8) 3.0 3.7 4.8 7.9 8.5
PAT (reported) 840 1,551 1,878 1,347 1,529 1,810
Less: Minority interest (MI) 56 64 60 (4) 46 54
PAT after MI (reported) 784 1,487 1,818 1,351 1,483 1,756
ADJ. PAT 784 1,487 1,818 1,351 1,483 1,756
% chg 37.1 89.6 22.3 (25.7) 9.8 18.4
(% of Net Sales) 37.7 44.3 42.6 32.9 30.7 31.5
Basic EPS (Rs) 40.5 71.8 87.8 65.2 71.6 84.8
Fully Diluted EPS (Rs) 40.5 71.8 87.8 65.2 71.6 84.8
% chg 112.3 77.0 22.3 (25.7) 9.8 18.4
May 24, 2010 4
7. Sun Pharma I 4QFY2010 Result Update
Research Team Tel: 022- 4040 3800 E-mail: research@angeltrade.com Website: www.angeltrade.com
DISCLAIMER
This document is solely for the personal information of the recipient, and must not be singularly used as the basis of any investment decision. Nothing in this
document should be construed as investment or financial advice. Each recipient of this document should make such investigations as they deem necessary to
arrive at an independent evaluation of an investment in the securities of the companies referred to in this document (including the merits and risks involved),
and should consult their own advisors to determine the merits and risks of such an investment.
Angel Securities Limited, its affiliates, directors, its proprietary trading and investment businesses may, from time to time, make investment decisions that are
inconsistent with or contradictory to the recommendations expressed herein. The views contained in this document are those of the analyst, and the company
may or may not subscribe to all the views expressed within.
Reports based on technical and derivative analysis center on studying charts of a stock's price movement, outstanding positions and trading volume, as
opposed to focusing on a company's fundamentals and, as such, may not match with a report on a company's fundamentals.
The information in this document has been printed on the basis of publicly available information, internal data and other reliable sources believed to be true,
and is for general guidance only. Angel Securities Limited has not independently verified all the information contained within this document. Accordingly, we
cannot testify, nor make any representation or warranty, express or implied, to the accuracy, contents or data contained within this document. While Angel
Securities Limited endeavours to update on a reasonable basis the information discussed in this material, there may be regulatory, compliance, or other
reasons that prevent us from doing so.
This document is being supplied to you solely for your information, and its contents, information or data may not be reproduced, redistributed or passed on,
directly or indirectly.
Angel Securities Limited and its affiliates may seek to provide or have engaged in providing corporate finance, investment banking or other advisory services
in a merger or specific transaction to the companies referred to in this report, as on the date of this report or in the past.
Neither Angel Securities Limited, nor its directors, employees or affiliates shall be liable for any loss or damage that may arise from or in connection with the
use of this information.
Note: Please refer to the important `Stock Holding Disclosure' report on the Angel website (Research Section).
Disclosure of Interest Statement Sun Pharma
1. Analyst ownership of the stock No
2. Angel and its Group companies ownership of the stock No
3. Angel and its Group companies’ Directors ownership of the stock No
4. Broking relationship with company covered No
Note: We have not considered any Exposure below Rs 1 lakh for Angel and its Group companies.
Address: Acme Plaza, ‘A’ Wing, 3rd Floor, M.V. Road, Opp. Sangam Cinema, Andheri (E), Mumbai - 400 059.
Tel : (022) 3952 4568 / 4040 3800
Angel Broking Ltd: BSE Sebi Regn No : INB 010996539 / CDSL Regn No: IN - DP - CDSL - 234 - 2004 / PMS Regn Code: PM/INP000001546 Angel Securities Ltd:BSE: INB010994639/INF010994639 NSE:
INB230994635/INF230994635 Membership numbers: BSE 028/NSE:09946
Angel Capital & Debt Market Ltd: INB 231279838 / NSE FNO: INF 231279838 / NSE Member code -12798 Angel Commodities Broking (P) Ltd: MCX Member ID: 12685 / FMC Regn No: MCX / TCM /
CORP / 0037 NCDEX : Member ID 00220 / FMC Regn No: NCDEX / TCM / CORP / 0302
May 24, 2010 7