fundamentals of corporate finance 11th canadian edition test bank.docx
Cccl ru2 qfy2011-281010
1. Please refer to important disclosures at the end of this report 1
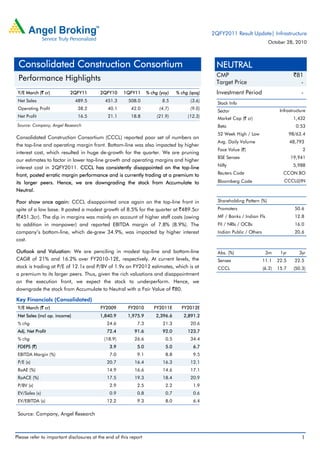
Y/E March (` cr) 2QFY11 2QFY10 1QFY11 % chg (yoy) % chg (qoq)
Net Sales 489.5 451.3 508.0 8.5 (3.6)
Operating Profit 38.2 40.1 42.0 (4.7) (9.0)
Net Profit 16.5 21.1 18.8 (21.9) (12.3)
Source: Company, Angel Research
Consolidated Construction Consortium (CCCL) reported poor set of numbers on
the top-line and operating margin front. Bottom-line was also impacted by higher
interest cost, which resulted in huge de-growth for the quarter. We are pruning
our estimates to factor in lower top-line growth and operating margins and higher
interest cost in 2QFY2011. CCCL has consistently disappointed on the top-line
front, posted erratic margin performance and is currently trading at a premium to
its larger peers. Hence, we are downgrading the stock from Accumulate to
Neutral.
Poor show once again: CCCL disappointed once again on the top-line front in
spite of a low base. It posted a modest growth of 8.5% for the quarter at `489.5cr
(`451.3cr). The dip in margins was mainly on account of higher staff costs (owing
to addition in manpower) and reported EBITDA margin of 7.8% (8.9%). The
company’s bottom-line, which de-grew 34.9%, was impacted by higher interest
cost.
Outlook and Valuation: We are penciling in modest top-line and bottom-line
CAGR of 21% and 16.2% over FY2010-12E, respectively. At current levels, the
stock is trading at P/E of 12.1x and P/BV of 1.9x on FY2012 estimates, which is at
a premium to its larger peers. Thus, given the rich valuations and disappointment
on the execution front, we expect the stock to underperform. Hence, we
downgrade the stock from Accumulate to Neutral with a Fair Value of `80.
Key Financials (Consolidated)
Y/E March (` cr) FY2009 FY2010 FY2011E FY2012E
Net Sales (incl op. income) 1,840.9 1,975.9 2,396.6 2,891.2
% chg 24.6 7.3 21.3 20.6
Adj. Net Profit 72.4 91.6 92.0 123.7
% chg (18.9) 26.6 0.5 34.4
FDEPS (`) 3.9 5.0 5.0 6.7
EBITDA Margin (%) 7.0 9.1 8.8 9.5
P/E (x) 20.7 16.4 16.3 12.1
RoAE (%) 14.9 16.6 14.6 17.1
RoACE (%) 17.5 19.3 18.4 20.9
P/BV (x) 2.9 2.5 2.2 1.9
EV/Sales (x) 0.9 0.8 0.7 0.6
EV/EBITDA (x) 12.2 9.3 8.0 6.4
Source: Company, Angel Research
NEUTRAL
CMP `81
Target Price -
Investment Period -
Stock Info
Sector
Bloomberg Code
Shareholding Pattern (%)
Promoters 50.6
MF / Banks / Indian Fls 12.8
FII / NRIs / OCBs 16.0
Indian Public / Others 20.6
Abs. (%) 3m 1yr 3yr
Sensex 11.1 22.5 22.5
CCCL (6.2) 15.7 (50.3)
2
19,941
5,988
CCON.BO
CCCL@IN
1,432
0.53
98/63.4
48,793
Infrastructure
Avg. Daily Volume
Market Cap (` cr)
Beta
52 Week High / Low
Face Value (`)
BSE Sensex
Nifty
Reuters Code
Consolidated Construction Consortium
Performance Highlights
2QFY2011 Result Update| Infrastructure
October 28, 2010
2. CCCL | 2QFY2011 Result Update
October 28, 2010 2
Exhibit 1: Quarterly performance (Standalone)
Y/E March (` cr) 2QFY11 2QFY10 1QFY11 % chg (yoy) % chg (qoq) 1HFY11 1HFY10 % chg
Net Sales 489.5 451.3 508.0 8.5 (3.6) 997.5 862.9 15.6
Total Expenditure 451.3 411.2 466.0 9.8 (3.1) 917.2 792.6 15.7
Operating Profit 38.2 40.1 42.0 (4.7) (9.0) 80.2 70.3 14.1
OPM (%) 7.8 8.9 8.3 (110bp) (50bp) 8.0 8.1 (10bp)
Interest 12.1 6.3 10.5 91.0 14.8 22.7 10.0 127.3
Depreciation 3.1 2.3 2.9 35.3 9.4 6.0 4.5 34.3
Non Operating Income 1.3 0.5 1.4 161.2 (2.9) 2.7 2.8 (3.7)
Nonrecurring items 0.7 0.0 0.9 - - 1.6 0.0 -
Profit Before Tax 25.0 31.9 29.1 (21.7) (13.9) 55.9 58.7 (4.7)
Tax 8.5 10.9 10.3 (21.3) (16.9) 18.8 20.0 (5.7)
Reported Net Profit 16.5 21.1 18.8 (21.9) (12.3) 37.1 38.7 (4.2)
Share of pfts to JV partner 2.7 0.0 0.9 0.0 0.0 3.7 0.0 0.0
Net Profit 13.7 21.1 17.9 (34.9) (23.1) 33.4 38.7 (13.7)
PAT (%) 3.4 4.7 3.7 - - 3.7 4.5 -
Reported EPS (`) 0.7 1.1 1.0 (34.9) (27.1) 1.8 2.1 (13.7)
Source: Company, Angel Research
Top-line disappoints in spite of low base
CCCL disappointed again on the top-line front in spite of a low base. The
company posted a modest growth of 8.5% for the quarter at `489.5cr (`451.3cr).
First quarter numbers depicted the signs of revival in top-line and management
also guided the same. However, the second quarter numbers came in below street
expectations. For 1HFY2011, company posted a top-line growth of 15.6%
primarily due to growth in 1QFY2011.
Order booking during the quarter was decent at `553.3cr albeit recording a yoy
decline of ~20%, taking the tally for the first half to `2,259cr, up ~65%. The
average execution period for the company’s order book is 18 months.
Exhibit 2: Dismal performance on top-line front
Source: Company, Angel Research
Exhibit 3: Order booking trend
Source: Company, Angel Research
2.7
8.5
(3.4)
4.5
6.3
23.4
8.5
(5.0)
-
5.0
10.0
15.0
20.0
25.0
0
100
200
300
400
500
600
4QFY09
1QFY10
2QFY10
3QFY10
4QFY10
1QFY11
2QFY11
Sales (Rs cr, LHS) Growth (yoy %, RHS)
678 693
443
352
1,706
553
(100.0)
(50.0)
-
50.0
100.0
150.0
200.0
-
200
400
600
800
1,000
1,200
1,400
1,600
1,800
1QFY10 2QFY10 3QFY10 4QFY10 1QFY11 2QFY11
Order Booking (Rs cr, LHS) Growth (yoy %, RHS)
3. CCCL | 2QFY2011 Result Update
October 28, 2010 3
EBITDA margins dip by 110bp and bottom-line posts de-growth
CCCL posted a 7.8% (8.9%) dip in reported EBITDA margins mainly due to higher
staff costs (owing to addition in manpower). Also, management informed that
while executing the multi-level car parking at Delhi due to the soil substrata the
design parameters underwent certain changes, which resulted in the wall thickness
being increased apart from other design alterations. As a result of these changes,
EBIDTA was impacted by `8.2cr. There was a substantial jump in interest cost of
91% yoy and 15% qoq due to the higher loan raised to meet the working capital
requirements. Thus, bottom-line posted de-growth of 34.9%.
Exhibit 4: Quarterly EBITDA trend
Source: Company, Angel Research
Exhibit 5: Quarterly PAT trend
Source: Company, Angel Research
Order Book Analysis
CCCL’s order book, as on 2QFY2011, stood at `4,491cr (1.9x FY2011E
revenues), up 20.6% yoy and dominated by the infrastructure (50.6%) and
commercial (37.0) segments. The balance was contributed by the industrial and
residential segments. The order book is spread across price protected (~51%),
fixed price (~27%) and without material (22%) contracts. There has been a jump in
the fixed price contracts indicating that the margins face downside risks in view of
the increasing commodity prices.
Exhibit 6: 2QFY11 Order booking- Sector-wise (` cr)
Source: Company, Angel Research
Exhibit 7: 2QFY11 Order backlog- Sector wise (` cr)
Source: Company, Angel Research
6.8
5.4
7.1 7.3
8.9 9.0 8.3
8.3
7.8
-
1.0
2.0
3.0
4.0
5.0
6.0
7.0
8.0
9.0
10.0
-
5.0
10.0
15.0
20.0
25.0
30.0
35.0
40.0
45.0
2QFY09
3QFY09
4QFY09
1QFY10
2QFY10
3QFY10
4QFY10
1QFY11
2QFY11
EBITDA (Rs cr, LHS) EBITDAM (%, RHS)
4.1
3.0
4.3
4.3
4.7
4.7 3.7
3.7
3.4
-
0.5
1.0
1.5
2.0
2.5
3.0
3.5
4.0
4.5
5.0
-
5.0
10.0
15.0
20.0
25.0
2QFY09
3QFY09
4QFY09
1QFY10
2QFY10
3QFY10
4QFY10
1QFY11
2QFY11
PAT (Rs cr, LHS) PATM (%, RHS)
96
291
167
Industrial
Commercial
Infrastructure
430
1,661 2,270
129
Industrial
Commercial
Infrastructure
Residential
4. CCCL | 2QFY2011 Result Update
October 28, 2010 4
Outlook and Valuation
We are pruning our estimates to factor in lower top-line growth and operating
margins and higher interest cost. Pertinently, the company has consistently
disappointed on the top-line front and posted erratic margins since the last few
quarters. Nonetheless, we expect some revival in the 2HFY2011 performance due
to the low base effect (recorded dismal performance in 2HFY2010).
Exhibit 8: Change in estimates
FY2011 FY2012
Earlier Estimates Revised Estimates Variation Earlier Estimates Revised Estimates Variation
Revenues 2,461.3 2,396.6 (2.6) 2,891.0 2,891.2 0.0
EBITDA Margin 8.9 8.8 (1.5) 9.5 9.5 0.0
PAT 109.0 92.0 (15.6) 137.7 123.7 (10.1)
Source: Company, Angel Research
We are penciling in top-line and bottom-line CAGR of 21% and 16.2% over
FY2010-12E, respectively. At current levels, the stock is trading at P/E of 12.1x and
P/BV of 1.9x on FY2012 estimates, which is at a premium to its larger peers. Thus,
given the rich valuations and disappointment on the execution front, we expect the
stock to underperform. Hence, we downgrade the stock from Accumulate to
Neutral with a Fair Value of `80.
Exhibit 9: Key assumptions
FY2007 FY2008 FY2009 FY2010 FY2011E FY2012E
Order Inflow 2,044 2,138 2,512 2,166 4,000 5,000
Revenues 868 1,477 1,841 1,976 2,397 2,891
Order Backlog (Y/E) 1,769 2,652 3,323 3,392 4,995 7,104
Order Book to Sales ratio (x) 2.0 1.8 1.8 1.7 2.1 2.5
Source: Company, Angel Research
10. CCCL | 2QFY2011 Result Update
October 28, 2010 10
Research Team Tel: 022 - 4040 3800 E-mail: research@angeltrade.com Website: www.angeltrade.com
DISCLAIMER
This document is solely for the personal information of the recipient, and must not be singularly used as the basis of any investment
decision. Nothing in this document should be construed as investment or financial advice. Each recipient of this document should make
such investigations as they deem necessary to arrive at an independent evaluation of an investment in the securities of the companies
referred to in this document (including the merits and risks involved), and should consult their own advisors to determine the merits and
risks of such an investment.
Angel Broking Limited, its affiliates, directors, its proprietary trading and investment businesses may, from time to time, make
investment decisions that are inconsistent with or contradictory to the recommendations expressed herein. The views contained in this
document are those of the analyst, and the company may or may not subscribe to all the views expressed within.
Reports based on technical and derivative analysis center on studying charts of a stock's price movement, outstanding positions and
trading volume, as opposed to focusing on a company's fundamentals and, as such, may not match with a report on a company's
fundamentals.
The information in this document has been printed on the basis of publicly available information, internal data and other reliable
sources believed to be true, but we do not represent that it is accurate or complete and it should not be relied on as such, as this
document is for general guidance only. Angel Broking Limited or any of its affiliates/ group companies shall not be in any way
responsible for any loss or damage that may arise to any person from any inadvertent error in the information contained in this report.
Angel Broking Limited has not independently verified all the information contained within this document. Accordingly, we cannot testify,
nor make any representation or warranty, express or implied, to the accuracy, contents or data contained within this document. While
Angel Broking Limited endeavours to update on a reasonable basis the information discussed in this material, there may be regulatory,
compliance, or other reasons that prevent us from doing so.
This document is being supplied to you solely for your information, and its contents, information or data may not be reproduced,
redistributed or passed on, directly or indirectly.
Angel Broking Limited and its affiliates may seek to provide or have engaged in providing corporate finance, investment banking or
other advisory services in a merger or specific transaction to the companies referred to in this report, as on the date of this report or in
the past.
Neither Angel Broking Limited, nor its directors, employees or affiliates shall be liable for any loss or damage that may arise from or in
connection with the use of this information.
Note: Please refer to the important `Stock Holding Disclosure' report on the Angel website (Research Section). Also, please
refer to the latest update on respective stocks for the disclosure status in respect of those stocks. Angel Broking Limited and
its affiliates may have investment positions in the stocks recommended in this report.
Disclosure of Interest Statement CCCL
1. Analyst ownership of the stock No
2. Angel and its Group companies ownership of the stock No
3. Angel and its Group companies' Directors ownership of the stock No
4. Broking relationship with company covered No
Note: We have not considered any Exposure below ` 1 lakh for Angel, its Group companies and Directors.
Ratings (Returns): Buy (> 15%) Accumulate (5% to 15%) Neutral (-5 to 5%)
Reduce (-5% to 15%) Sell (< -15%)