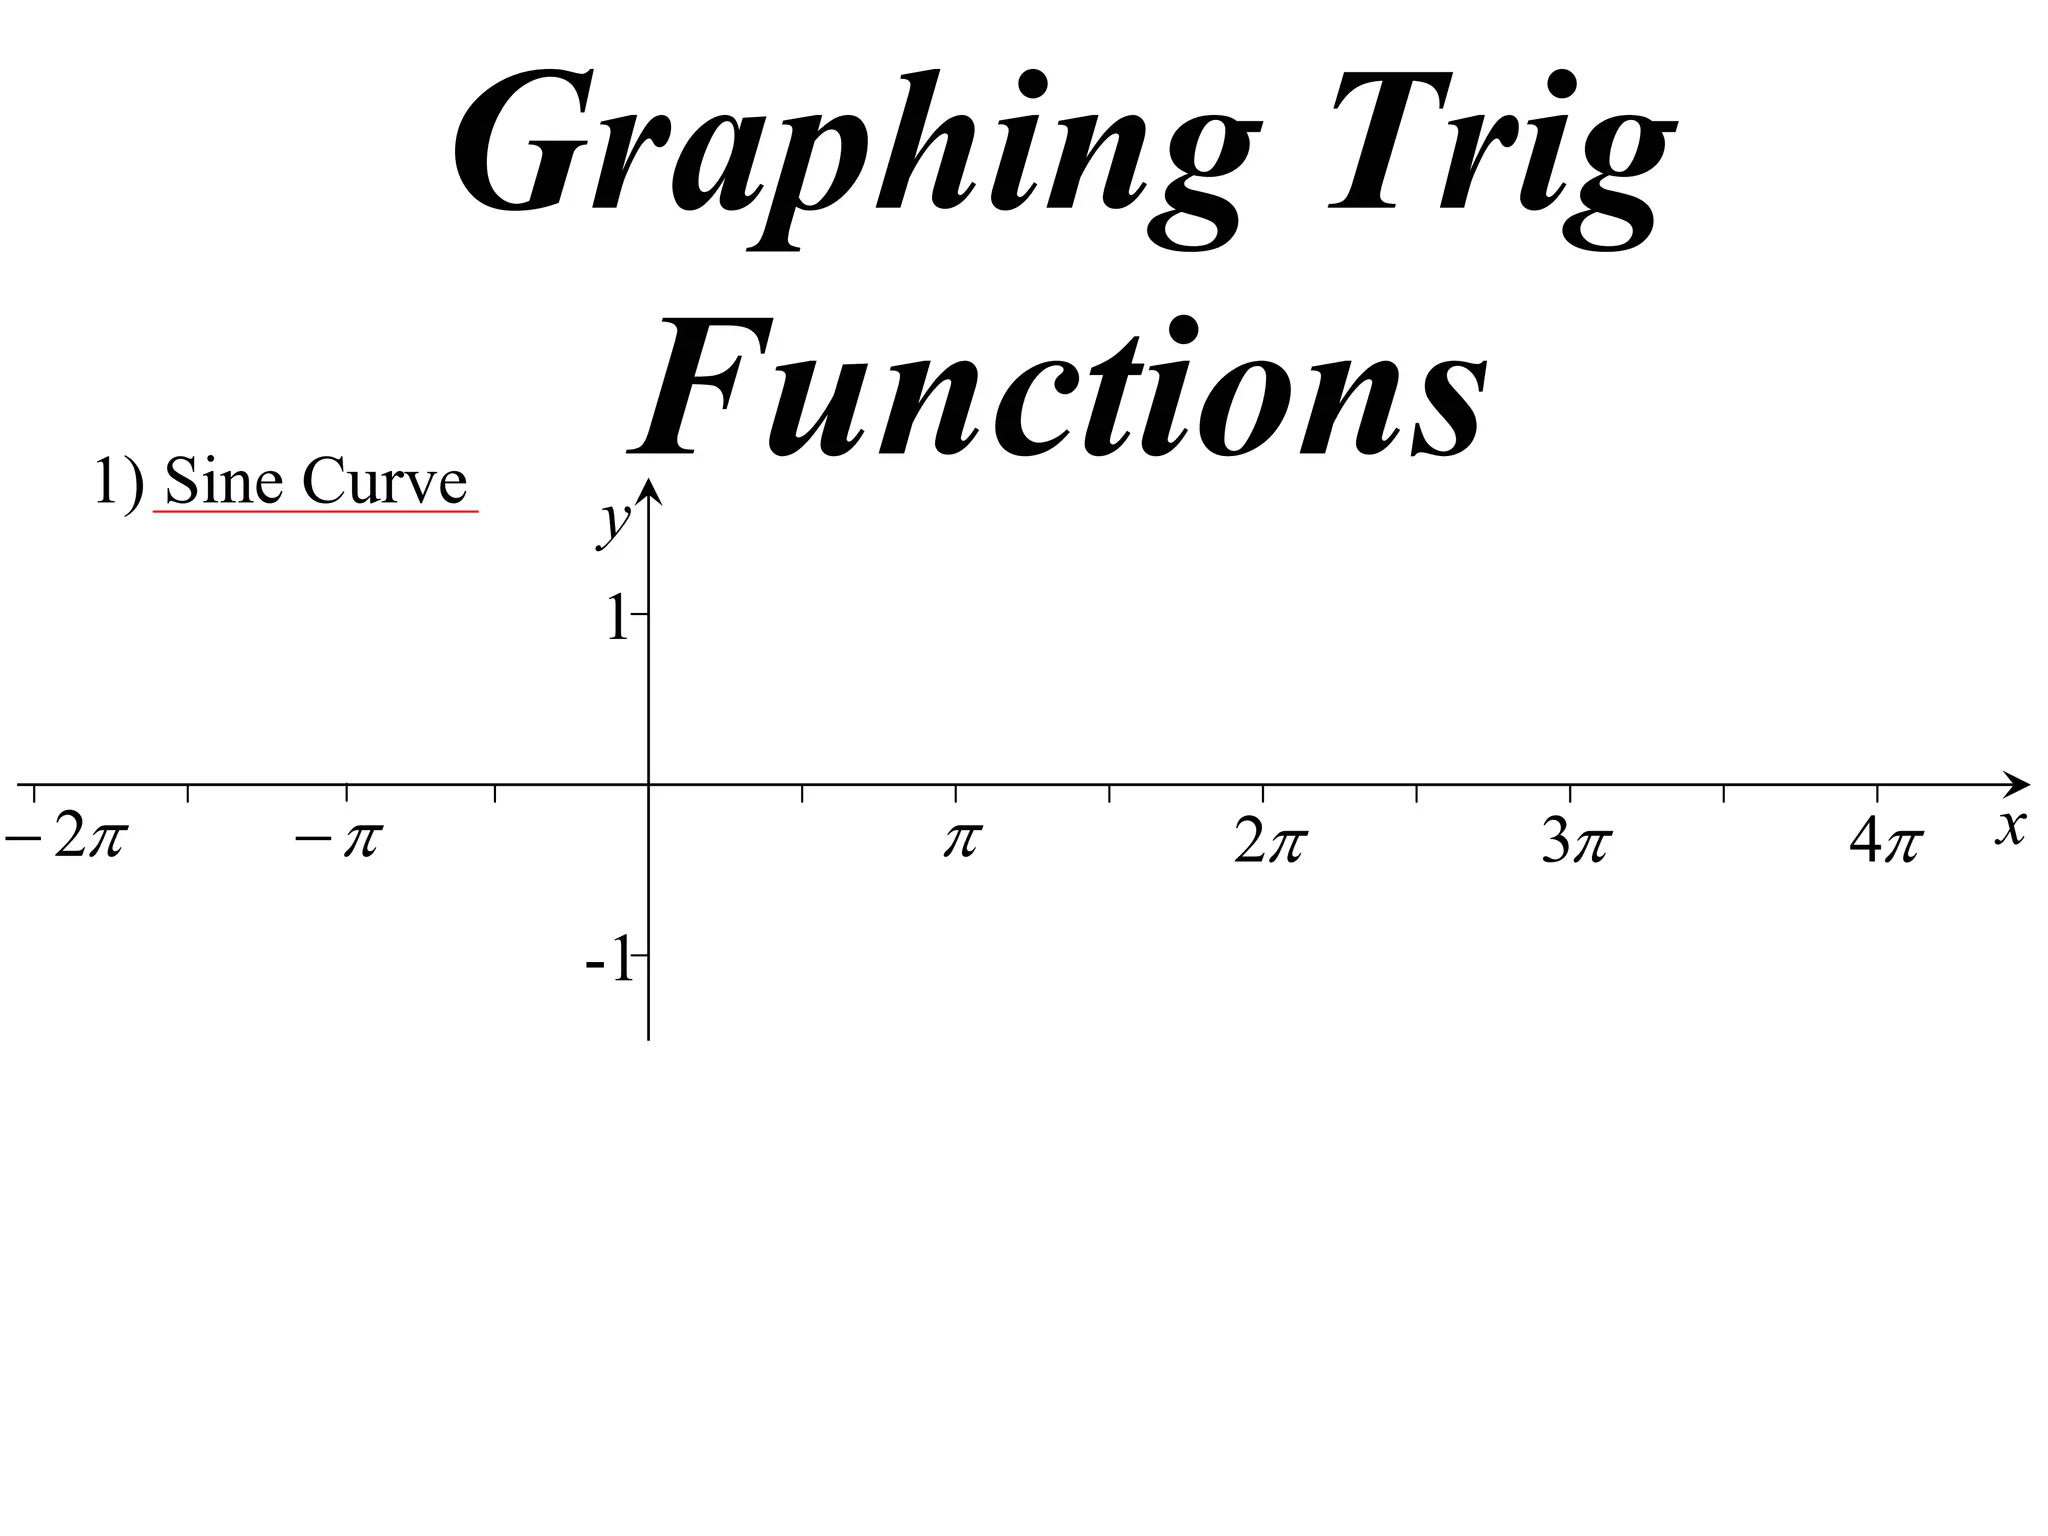
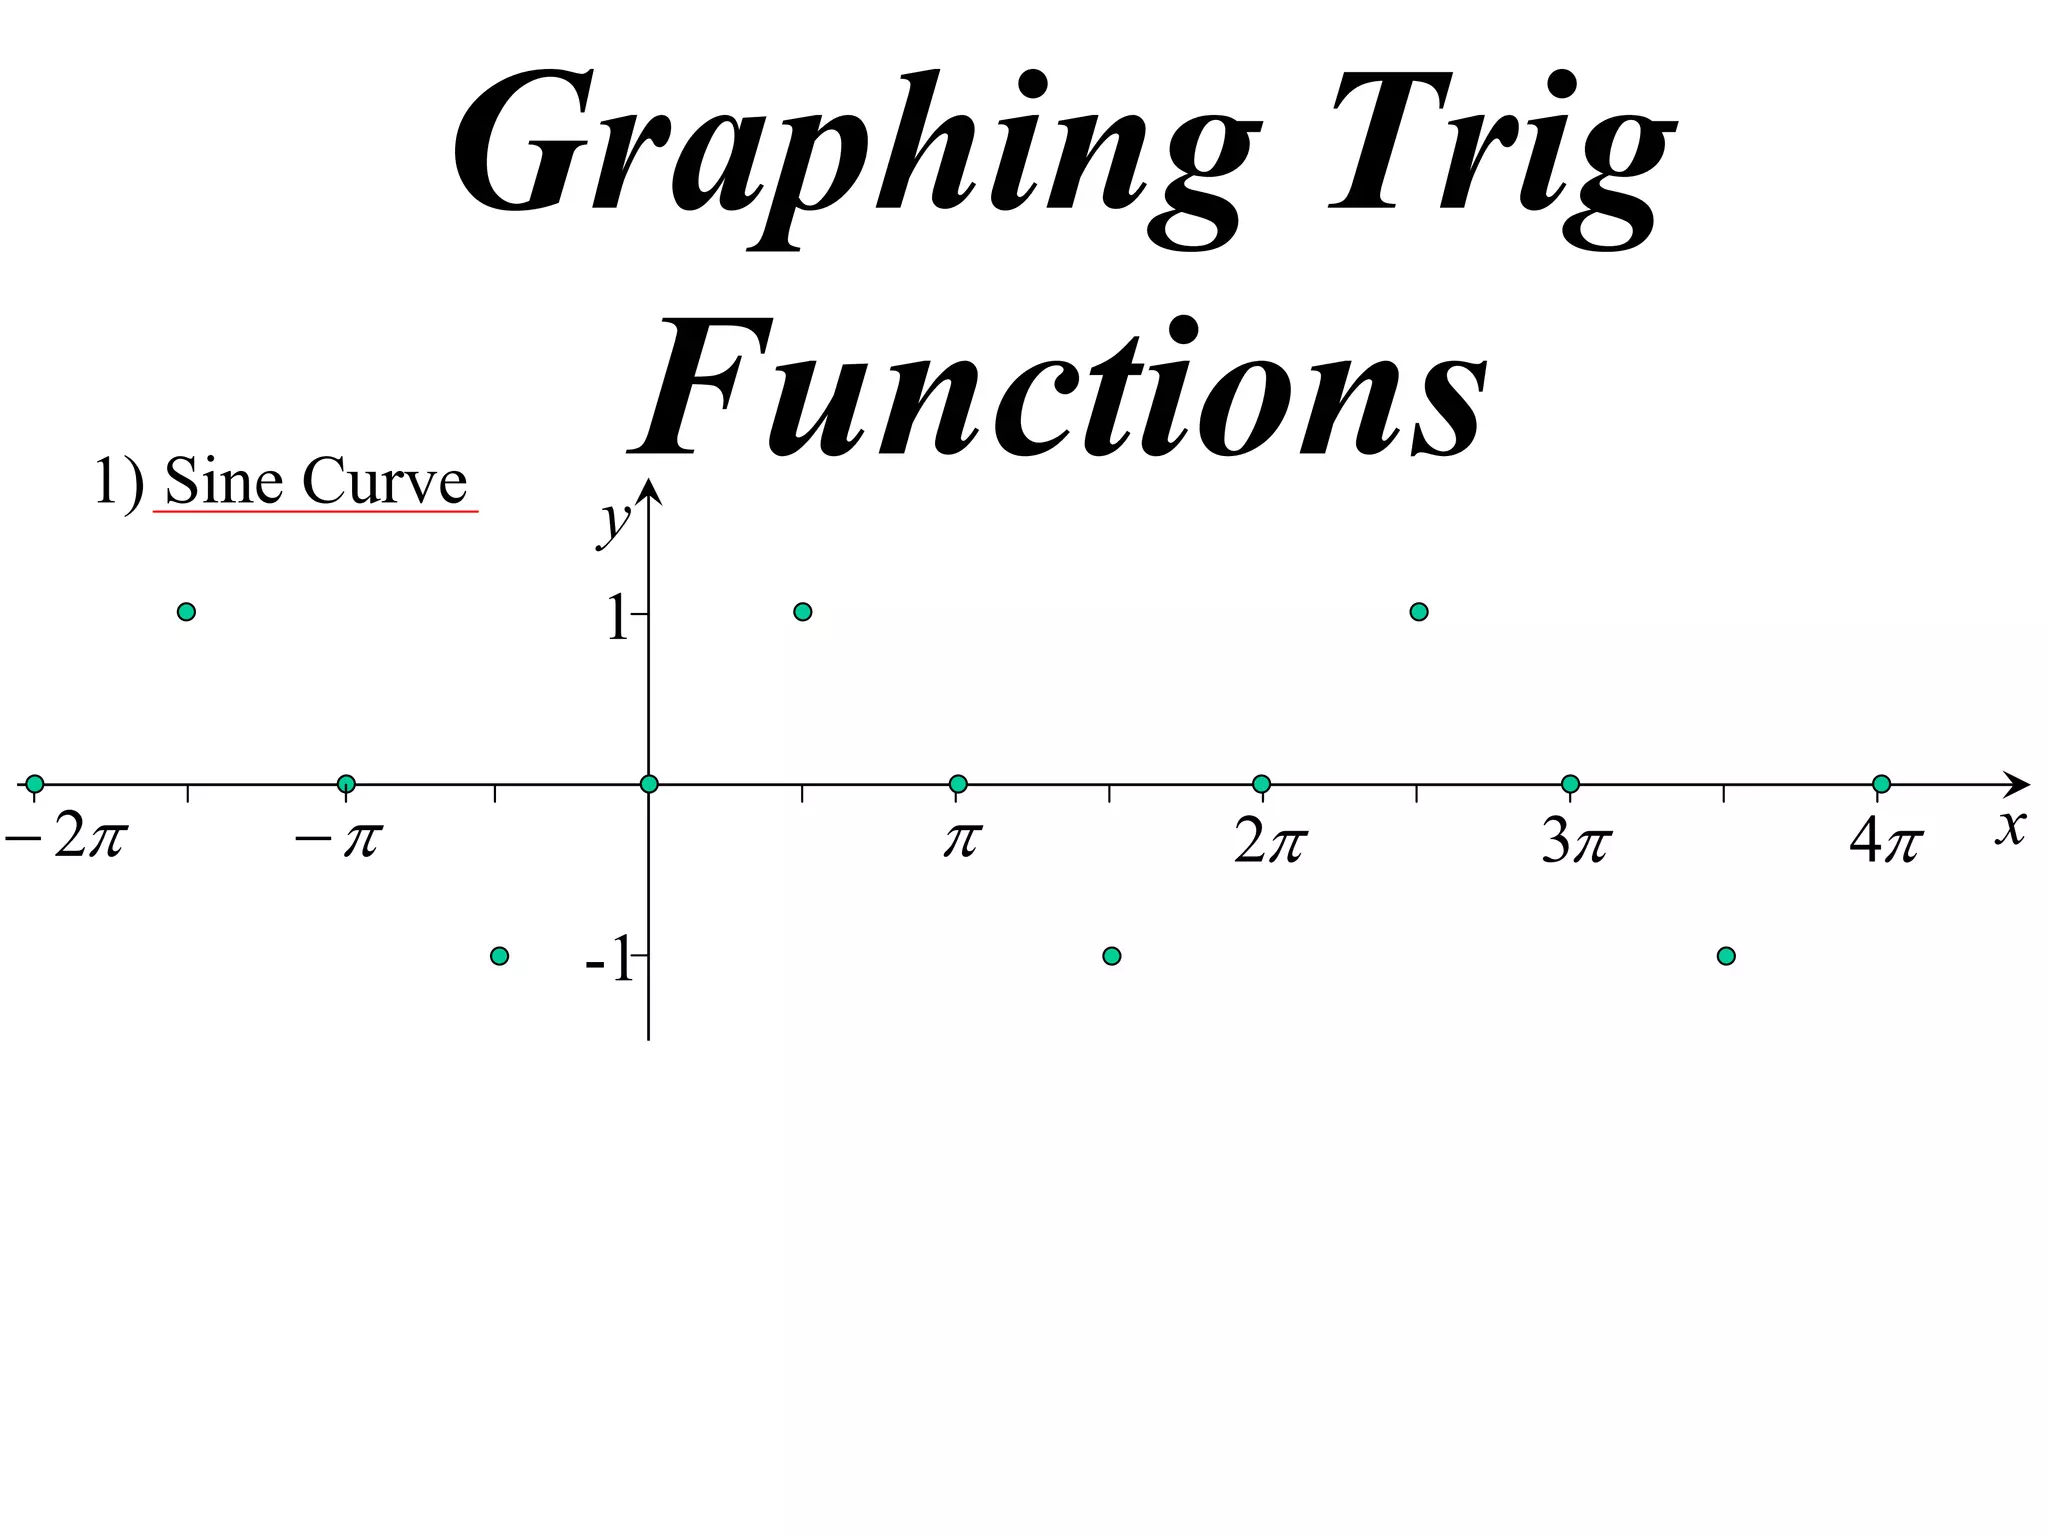
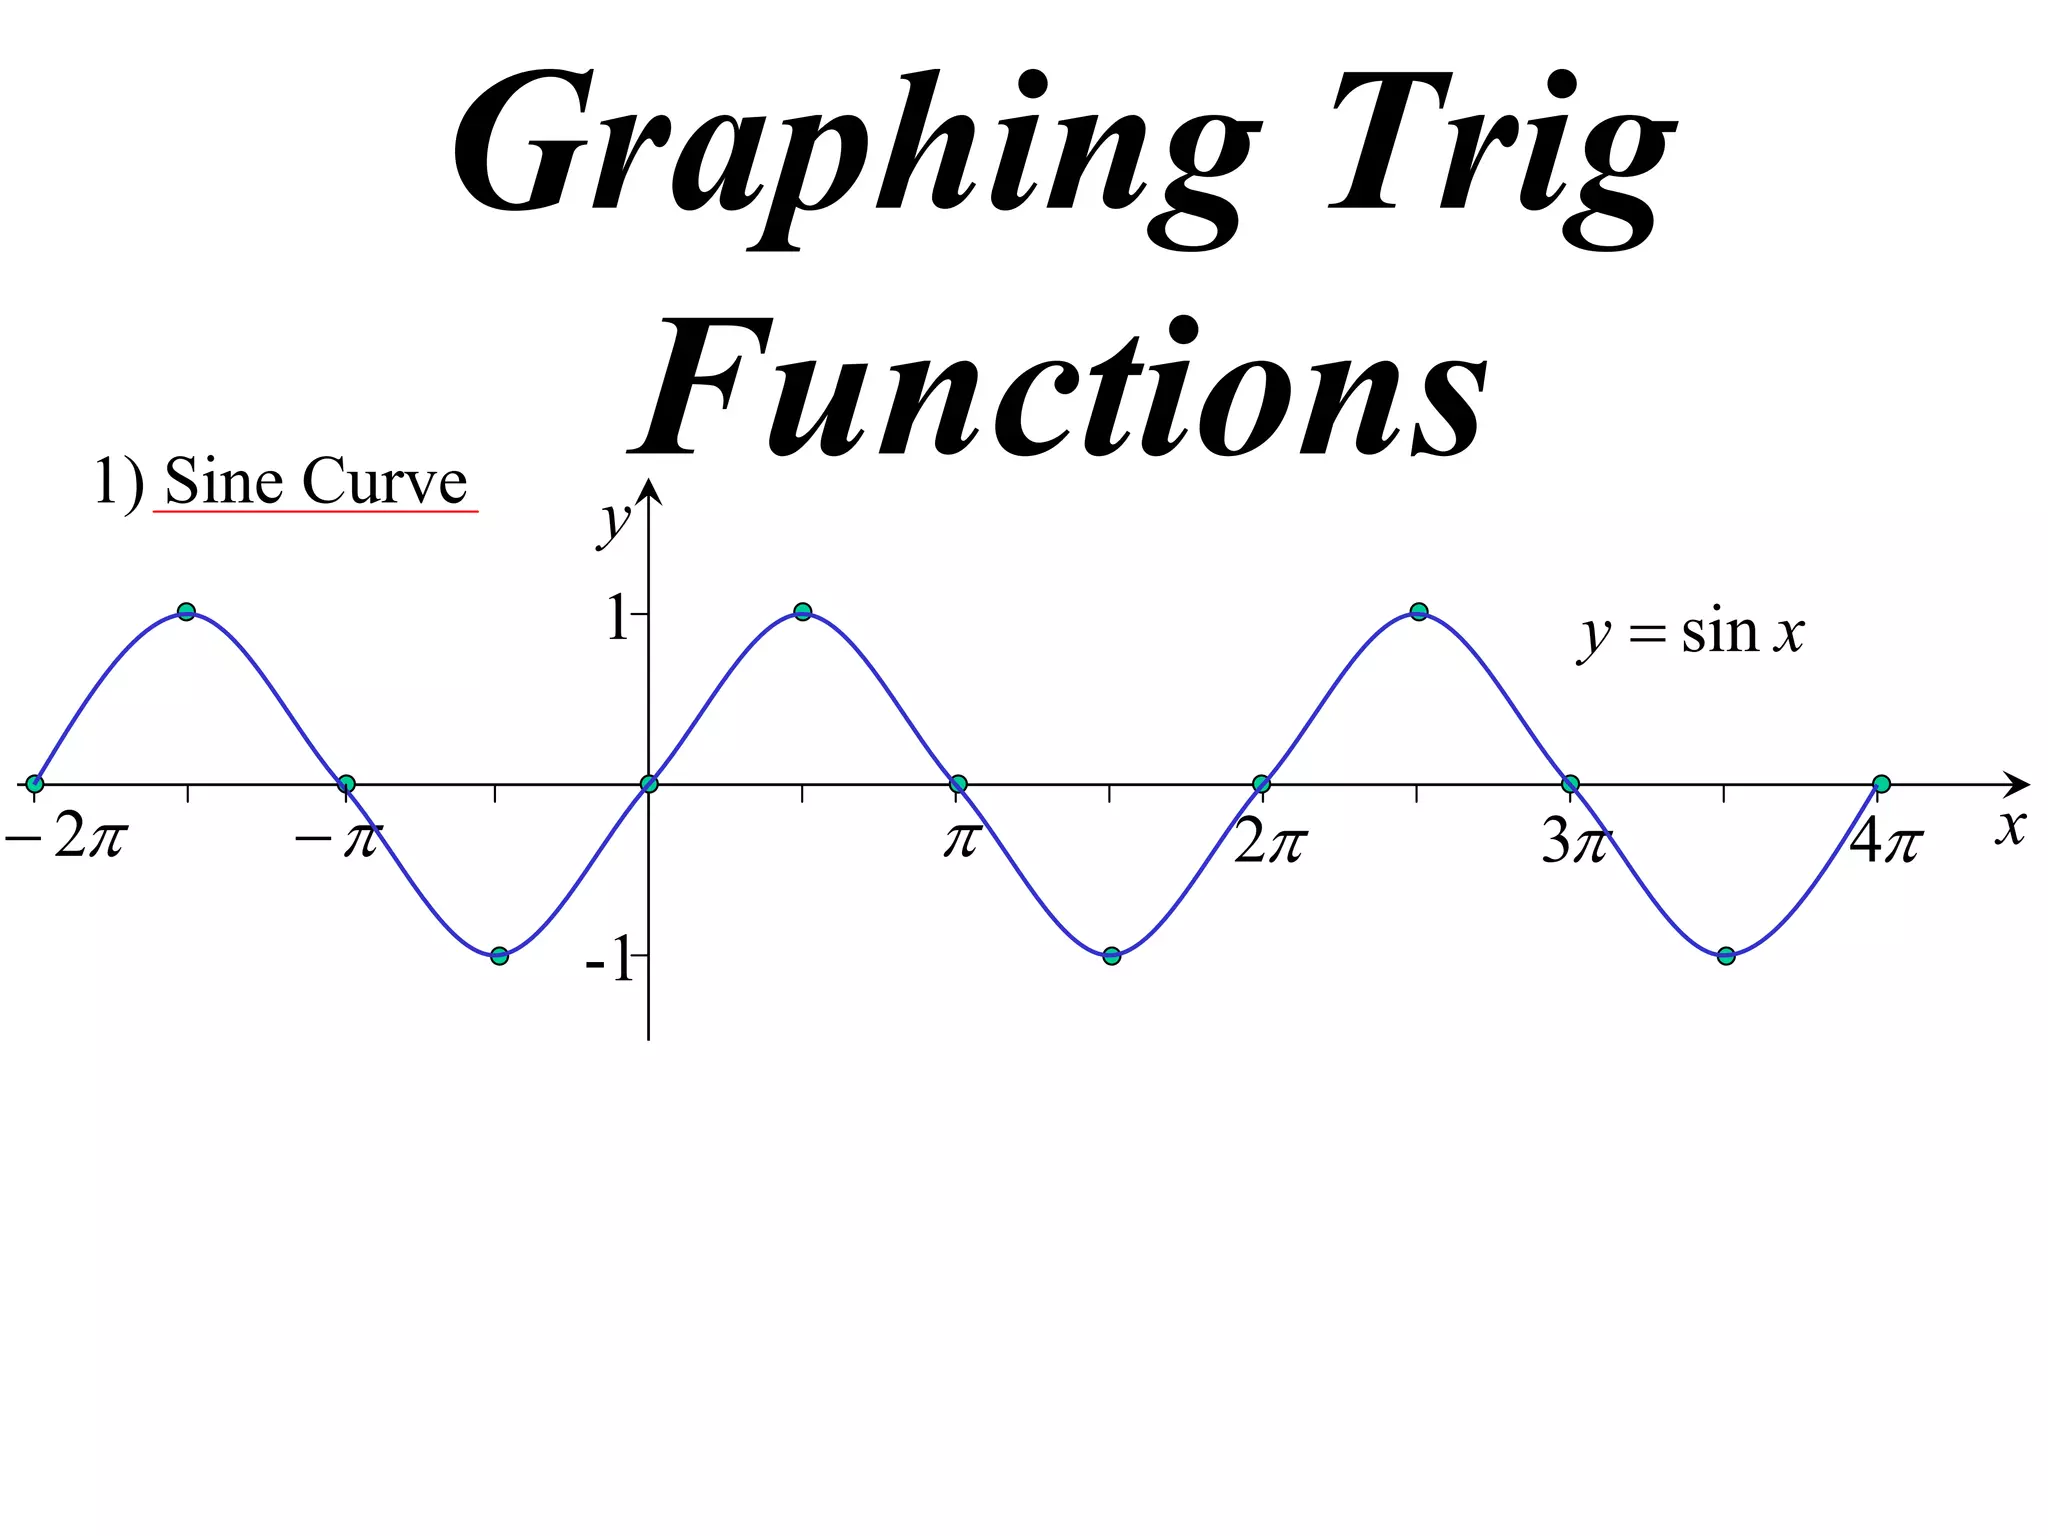
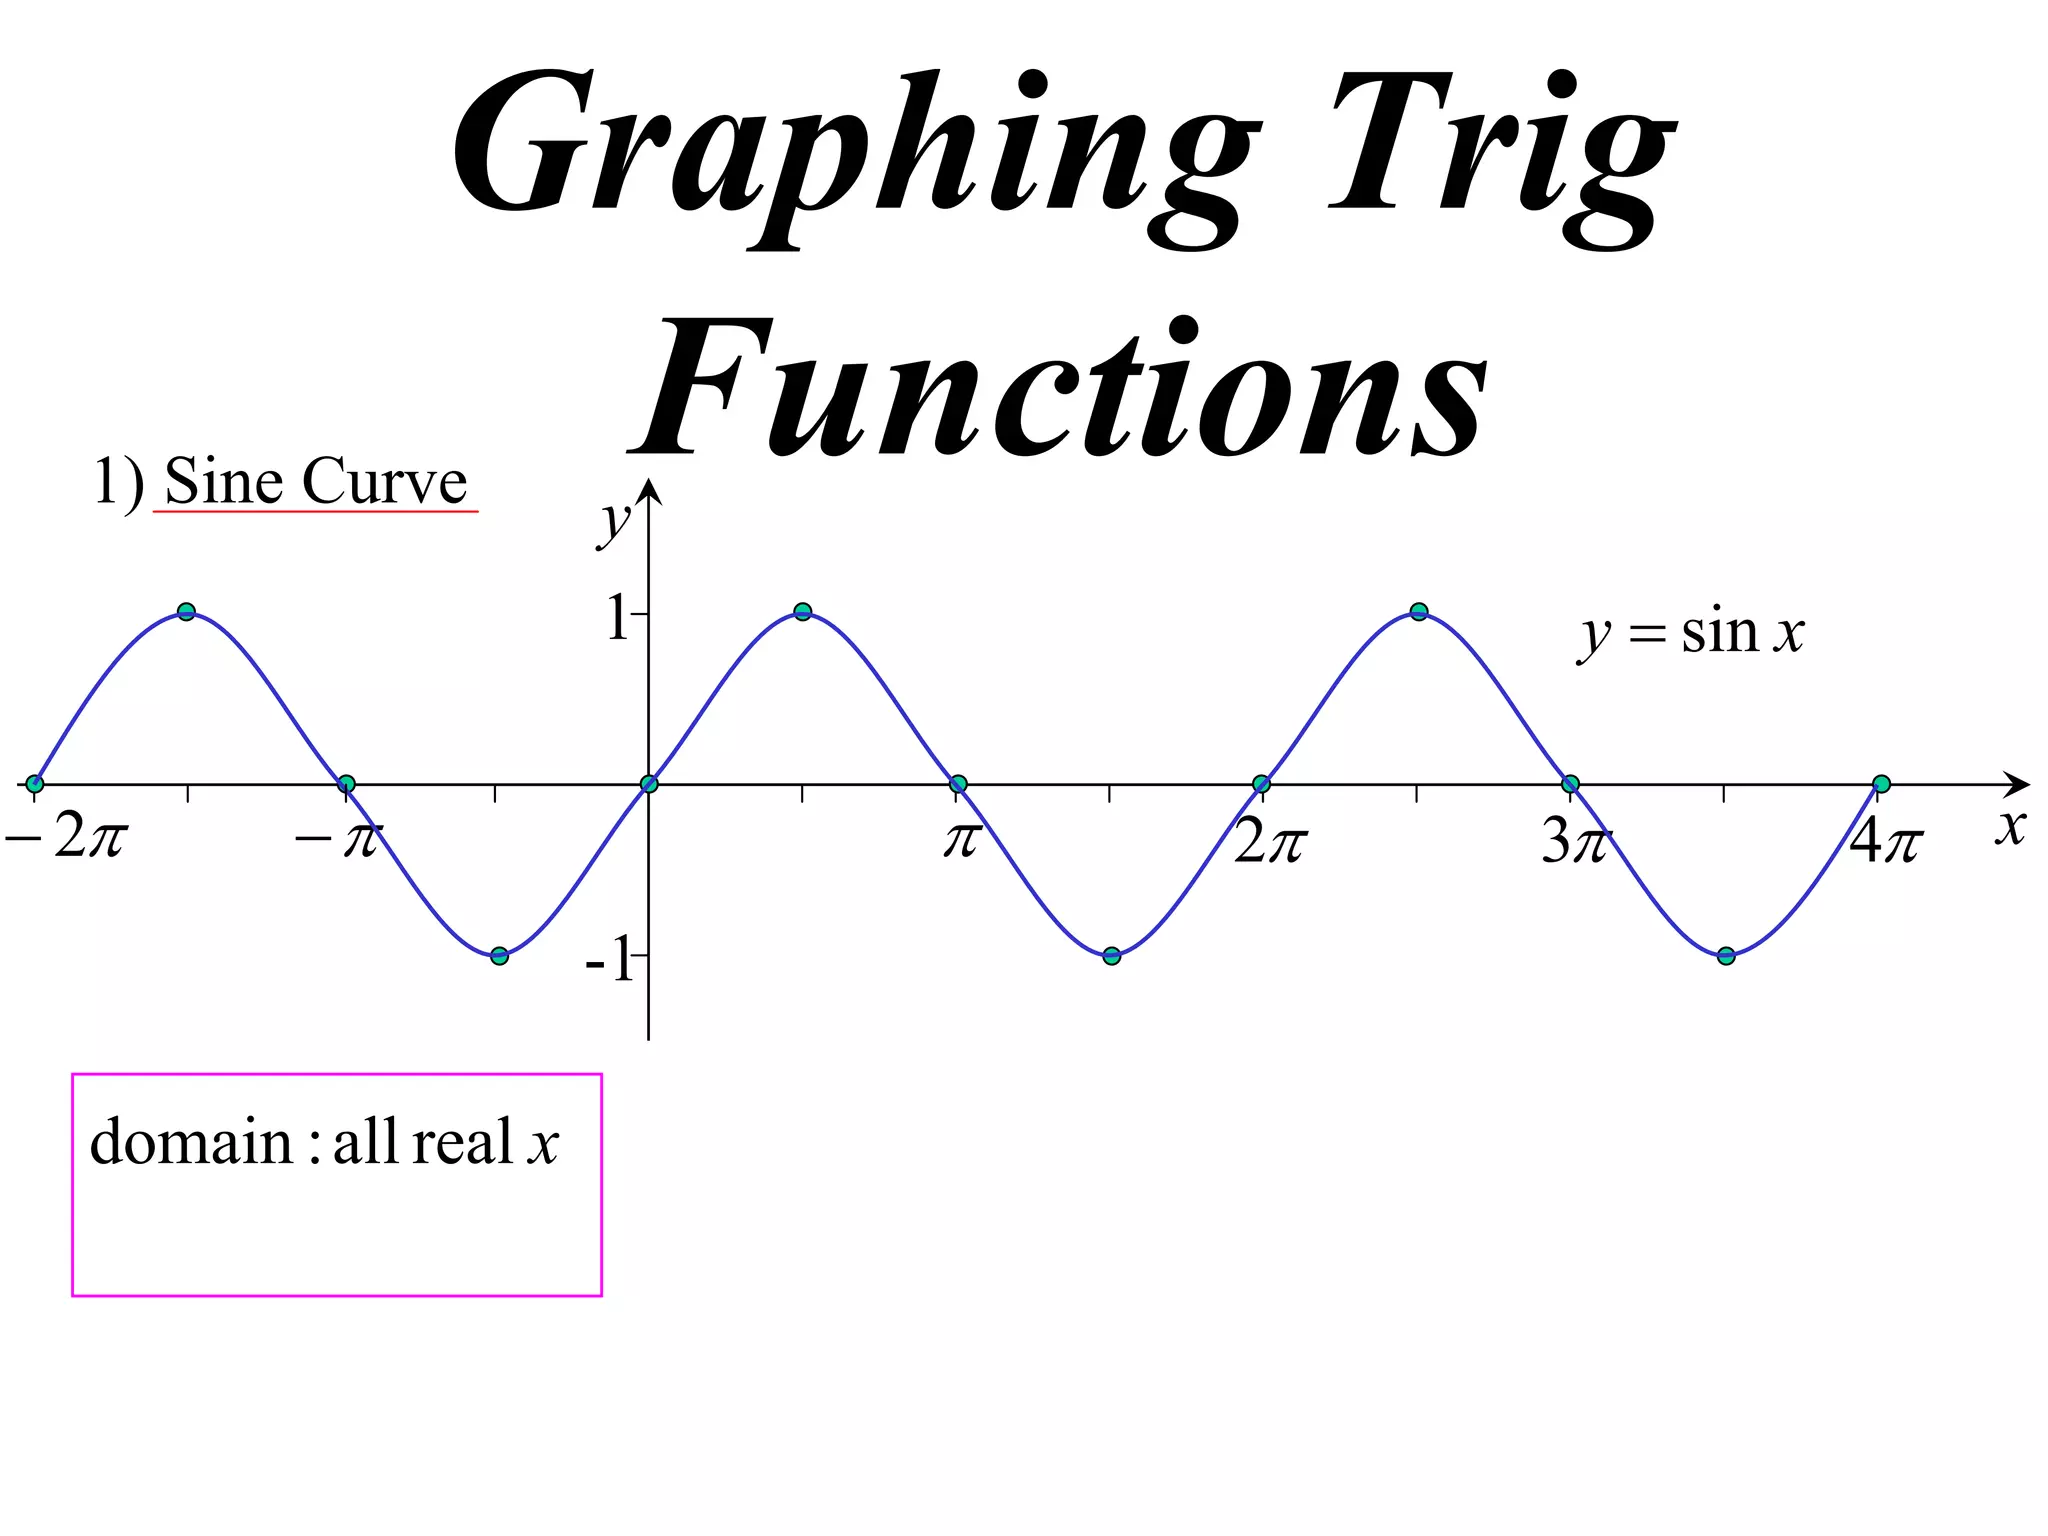
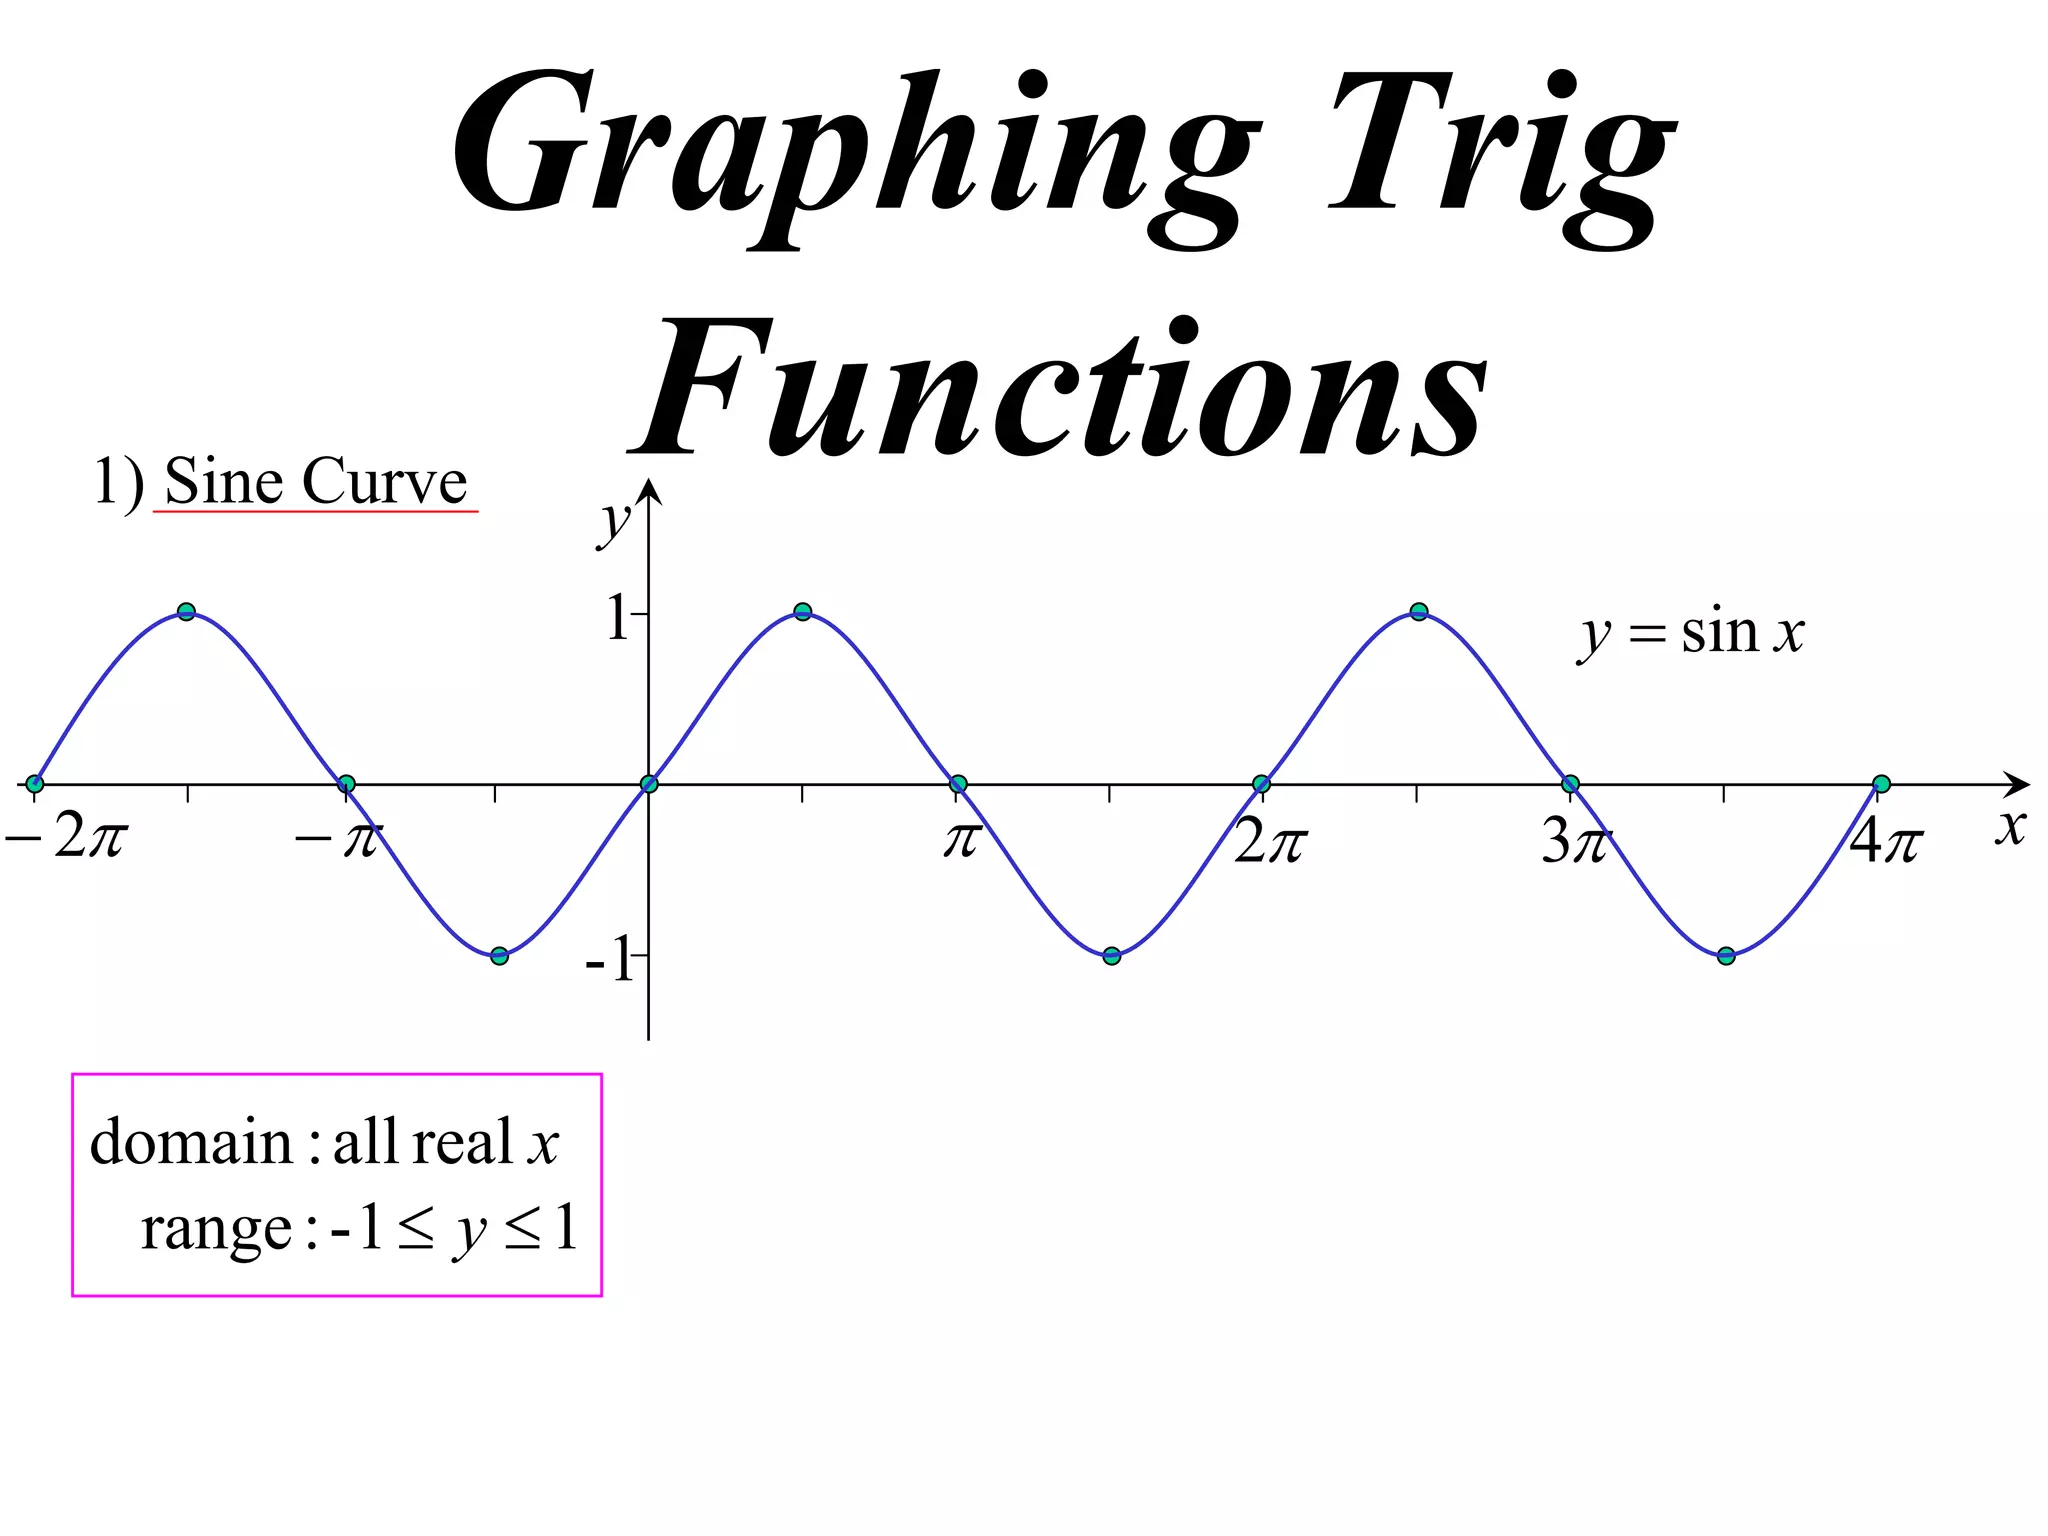
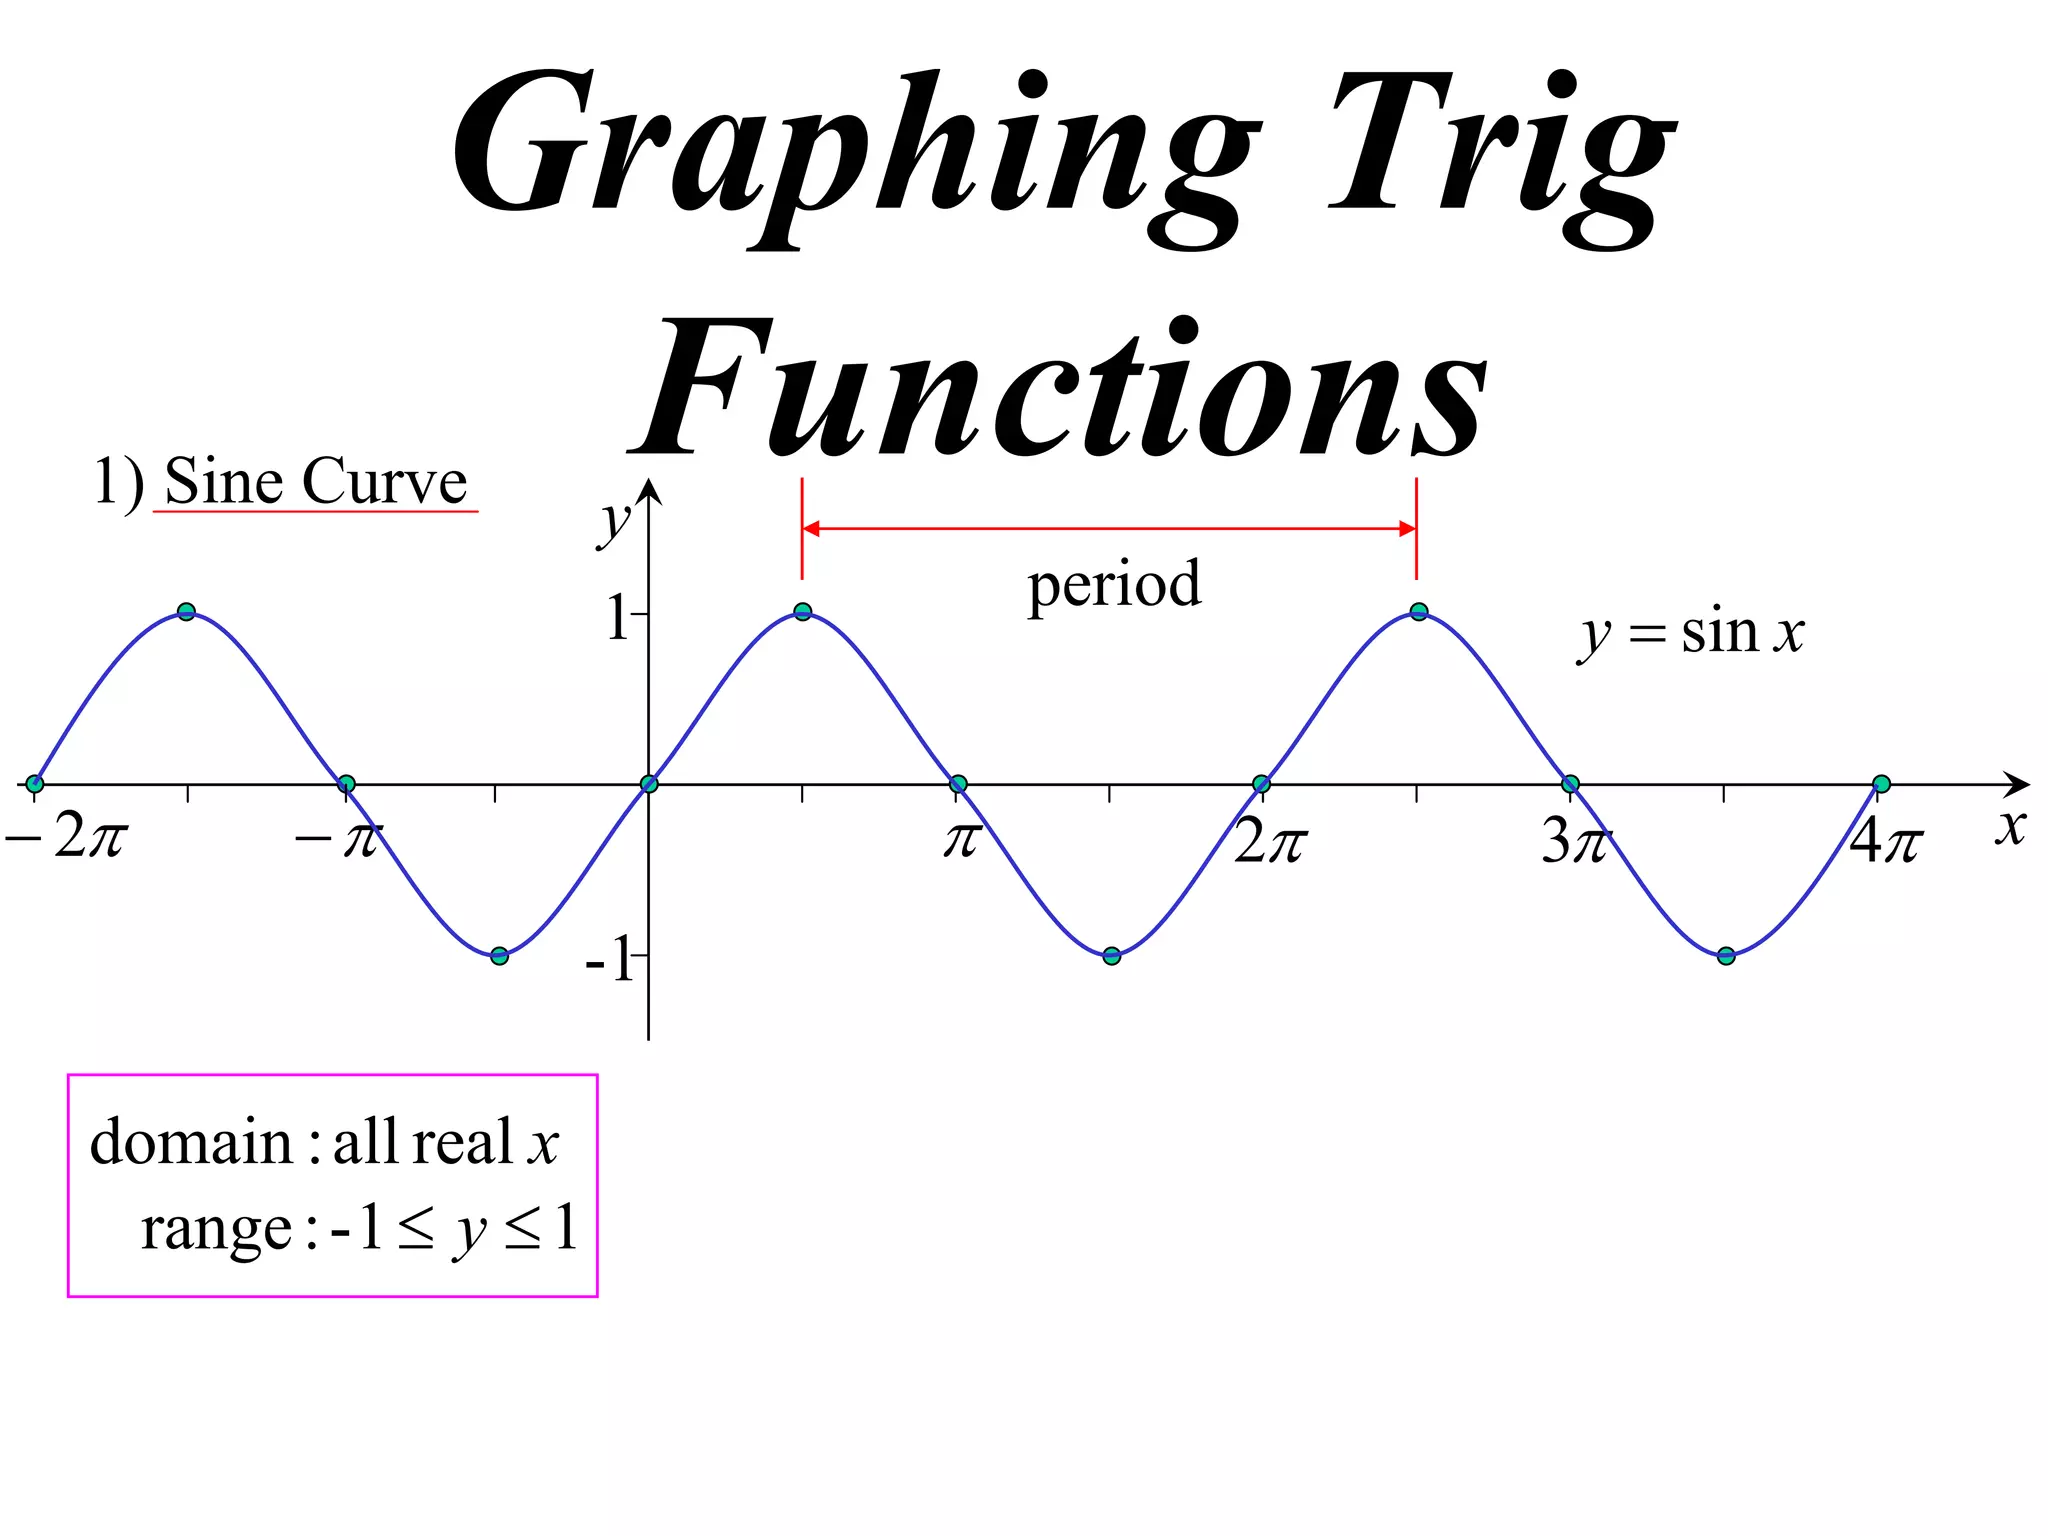
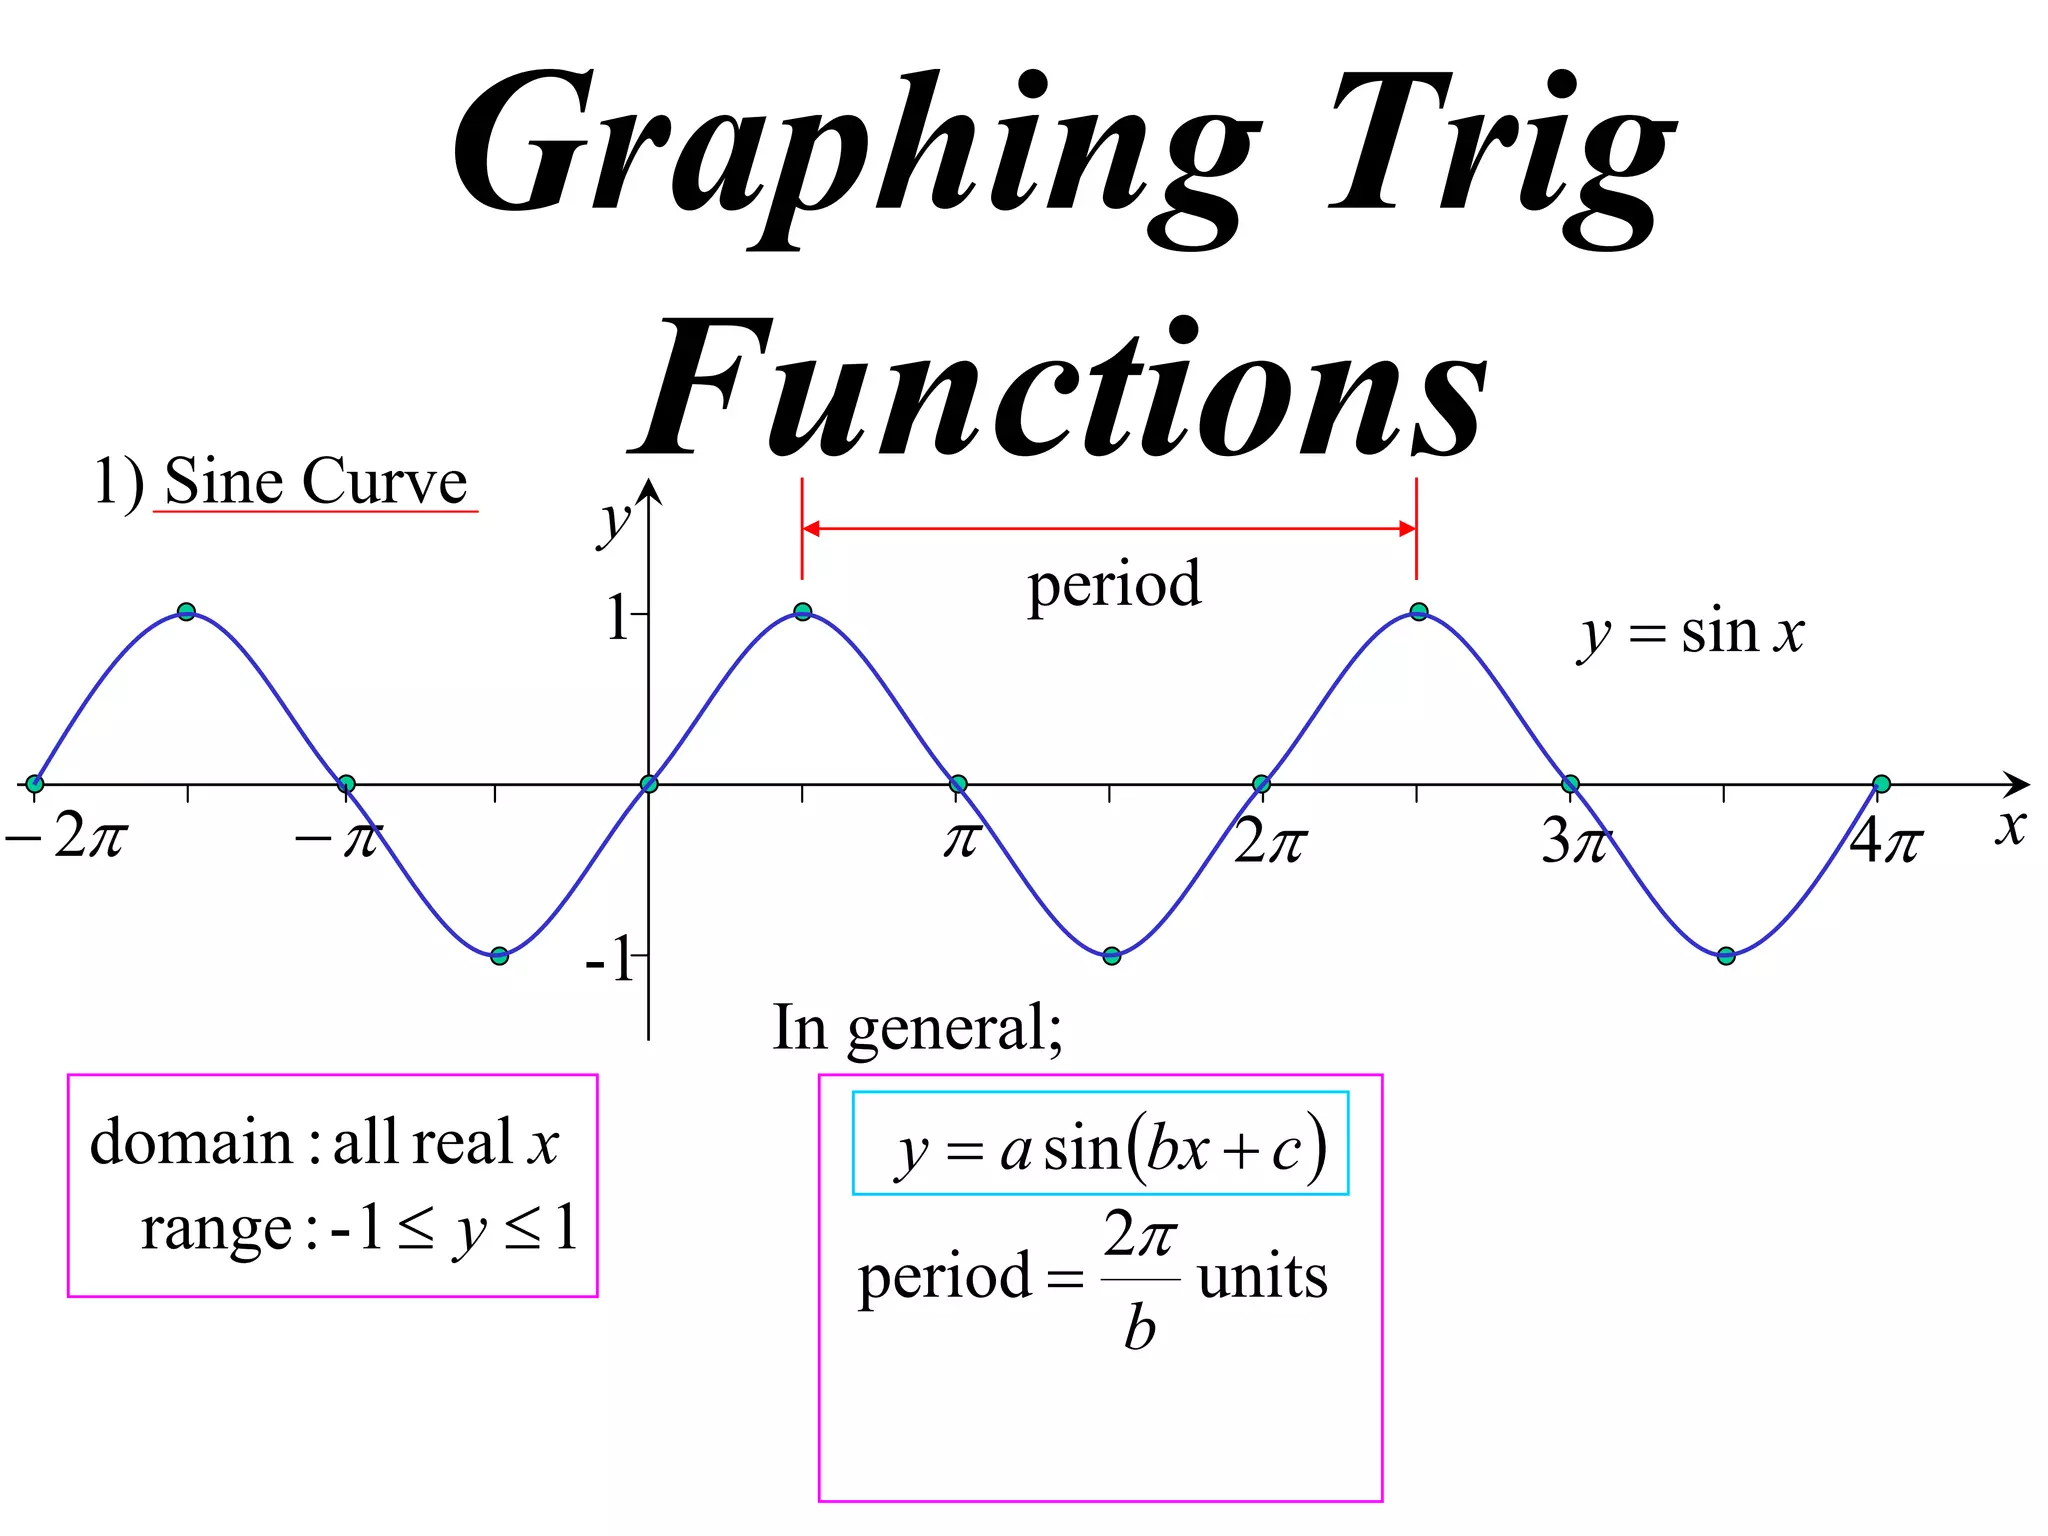
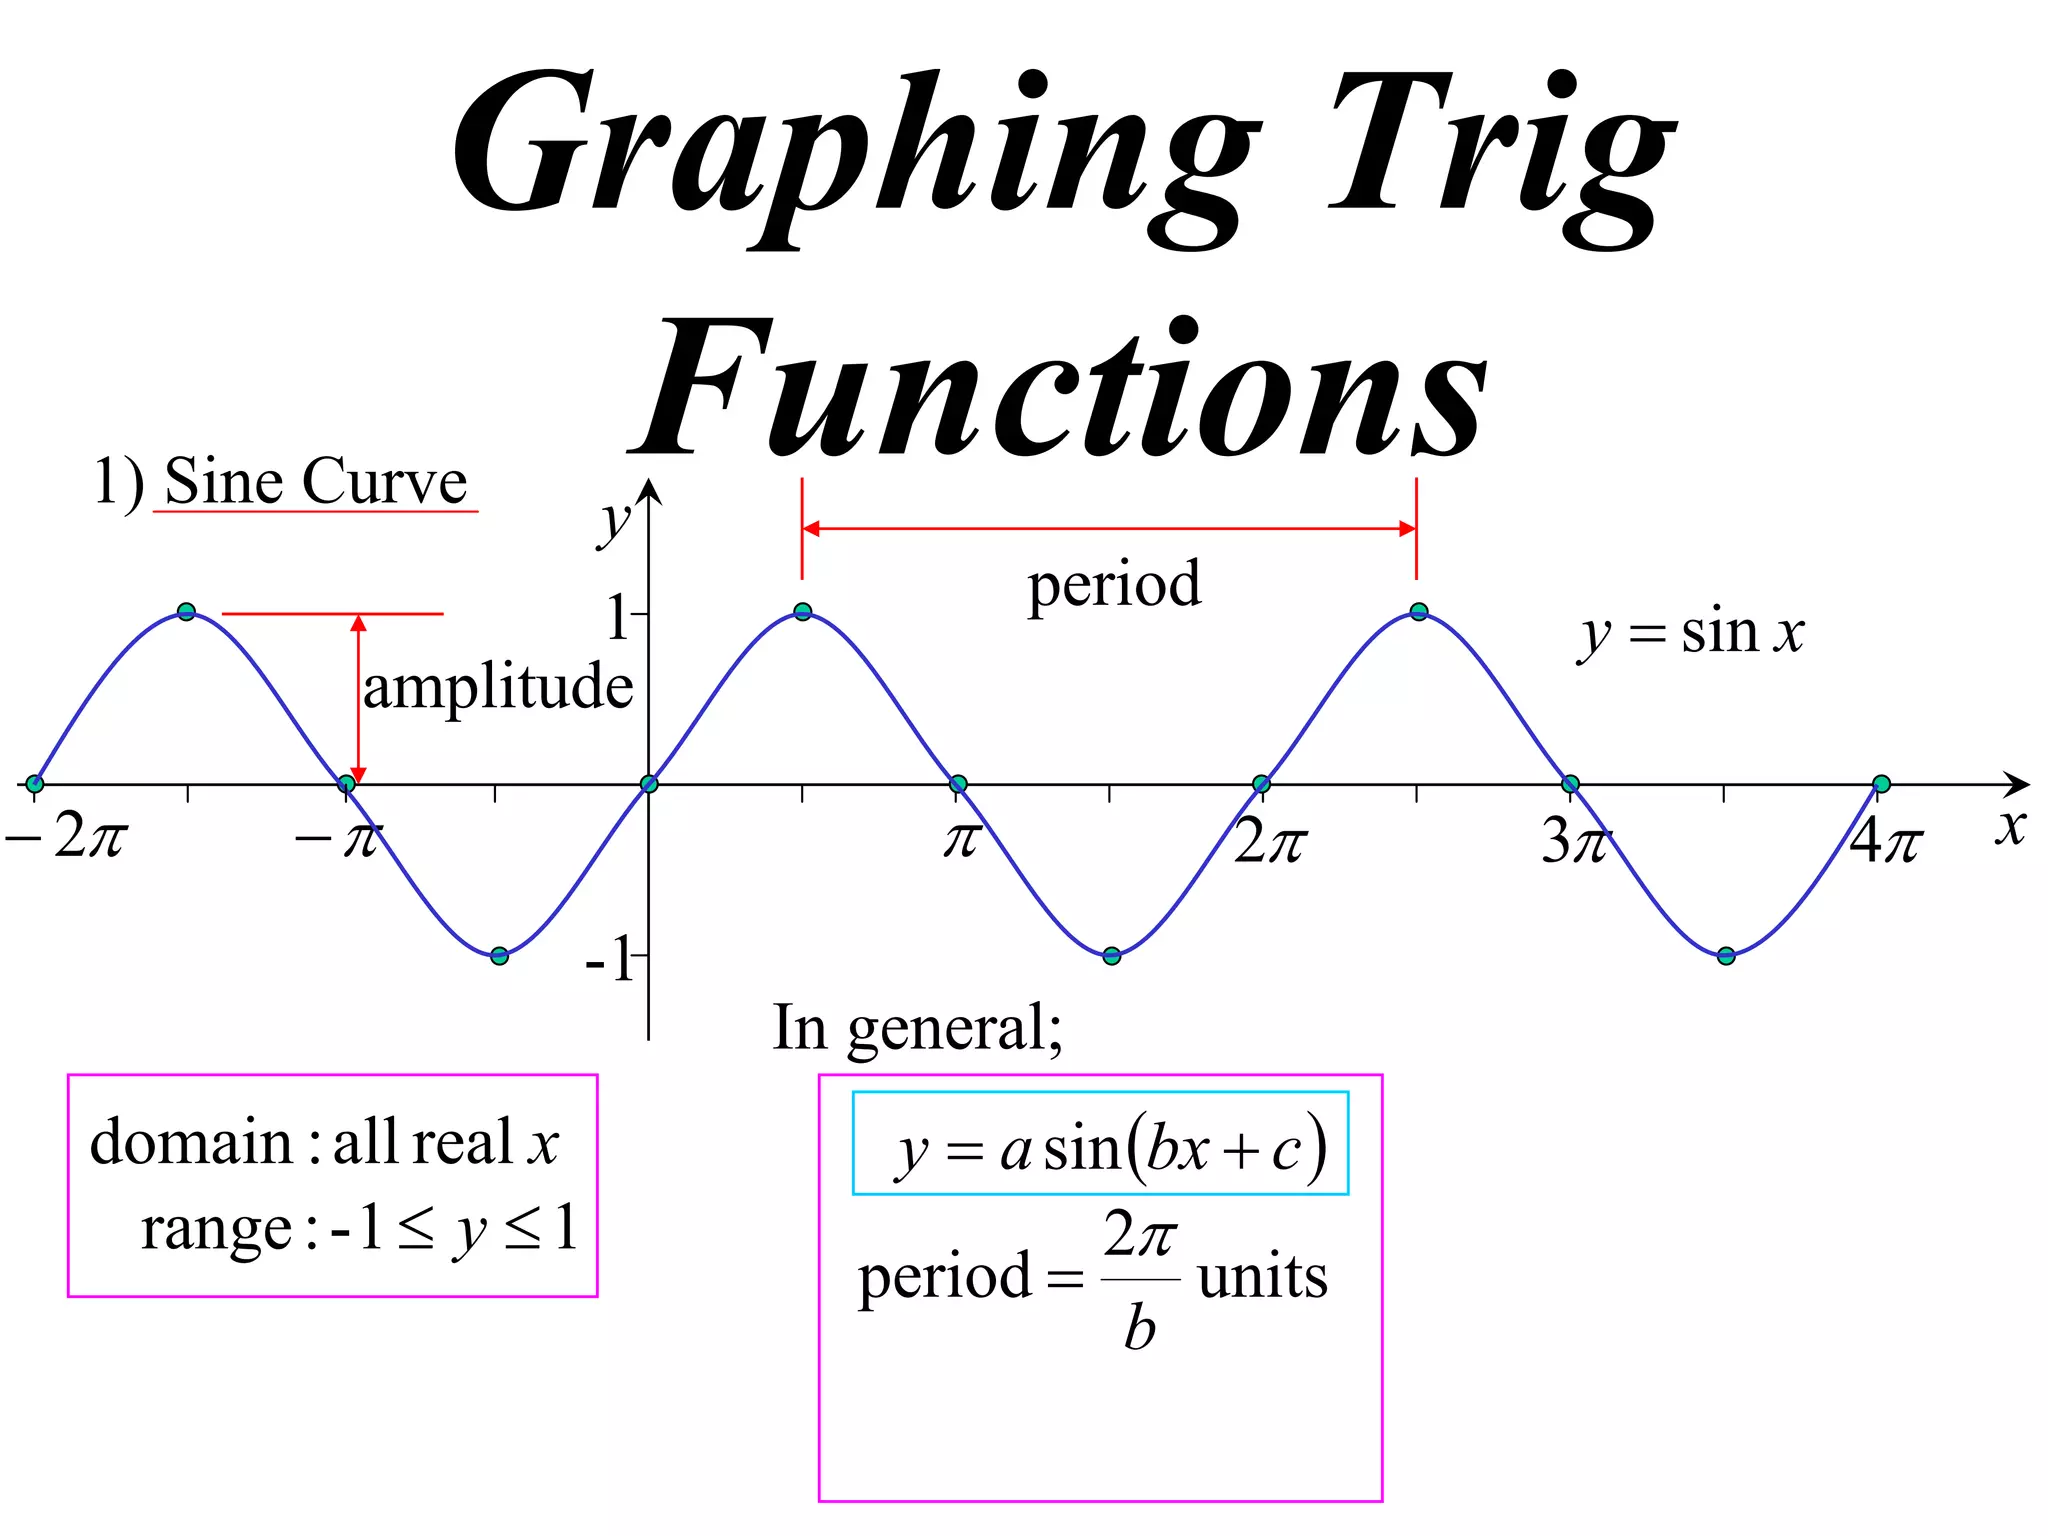
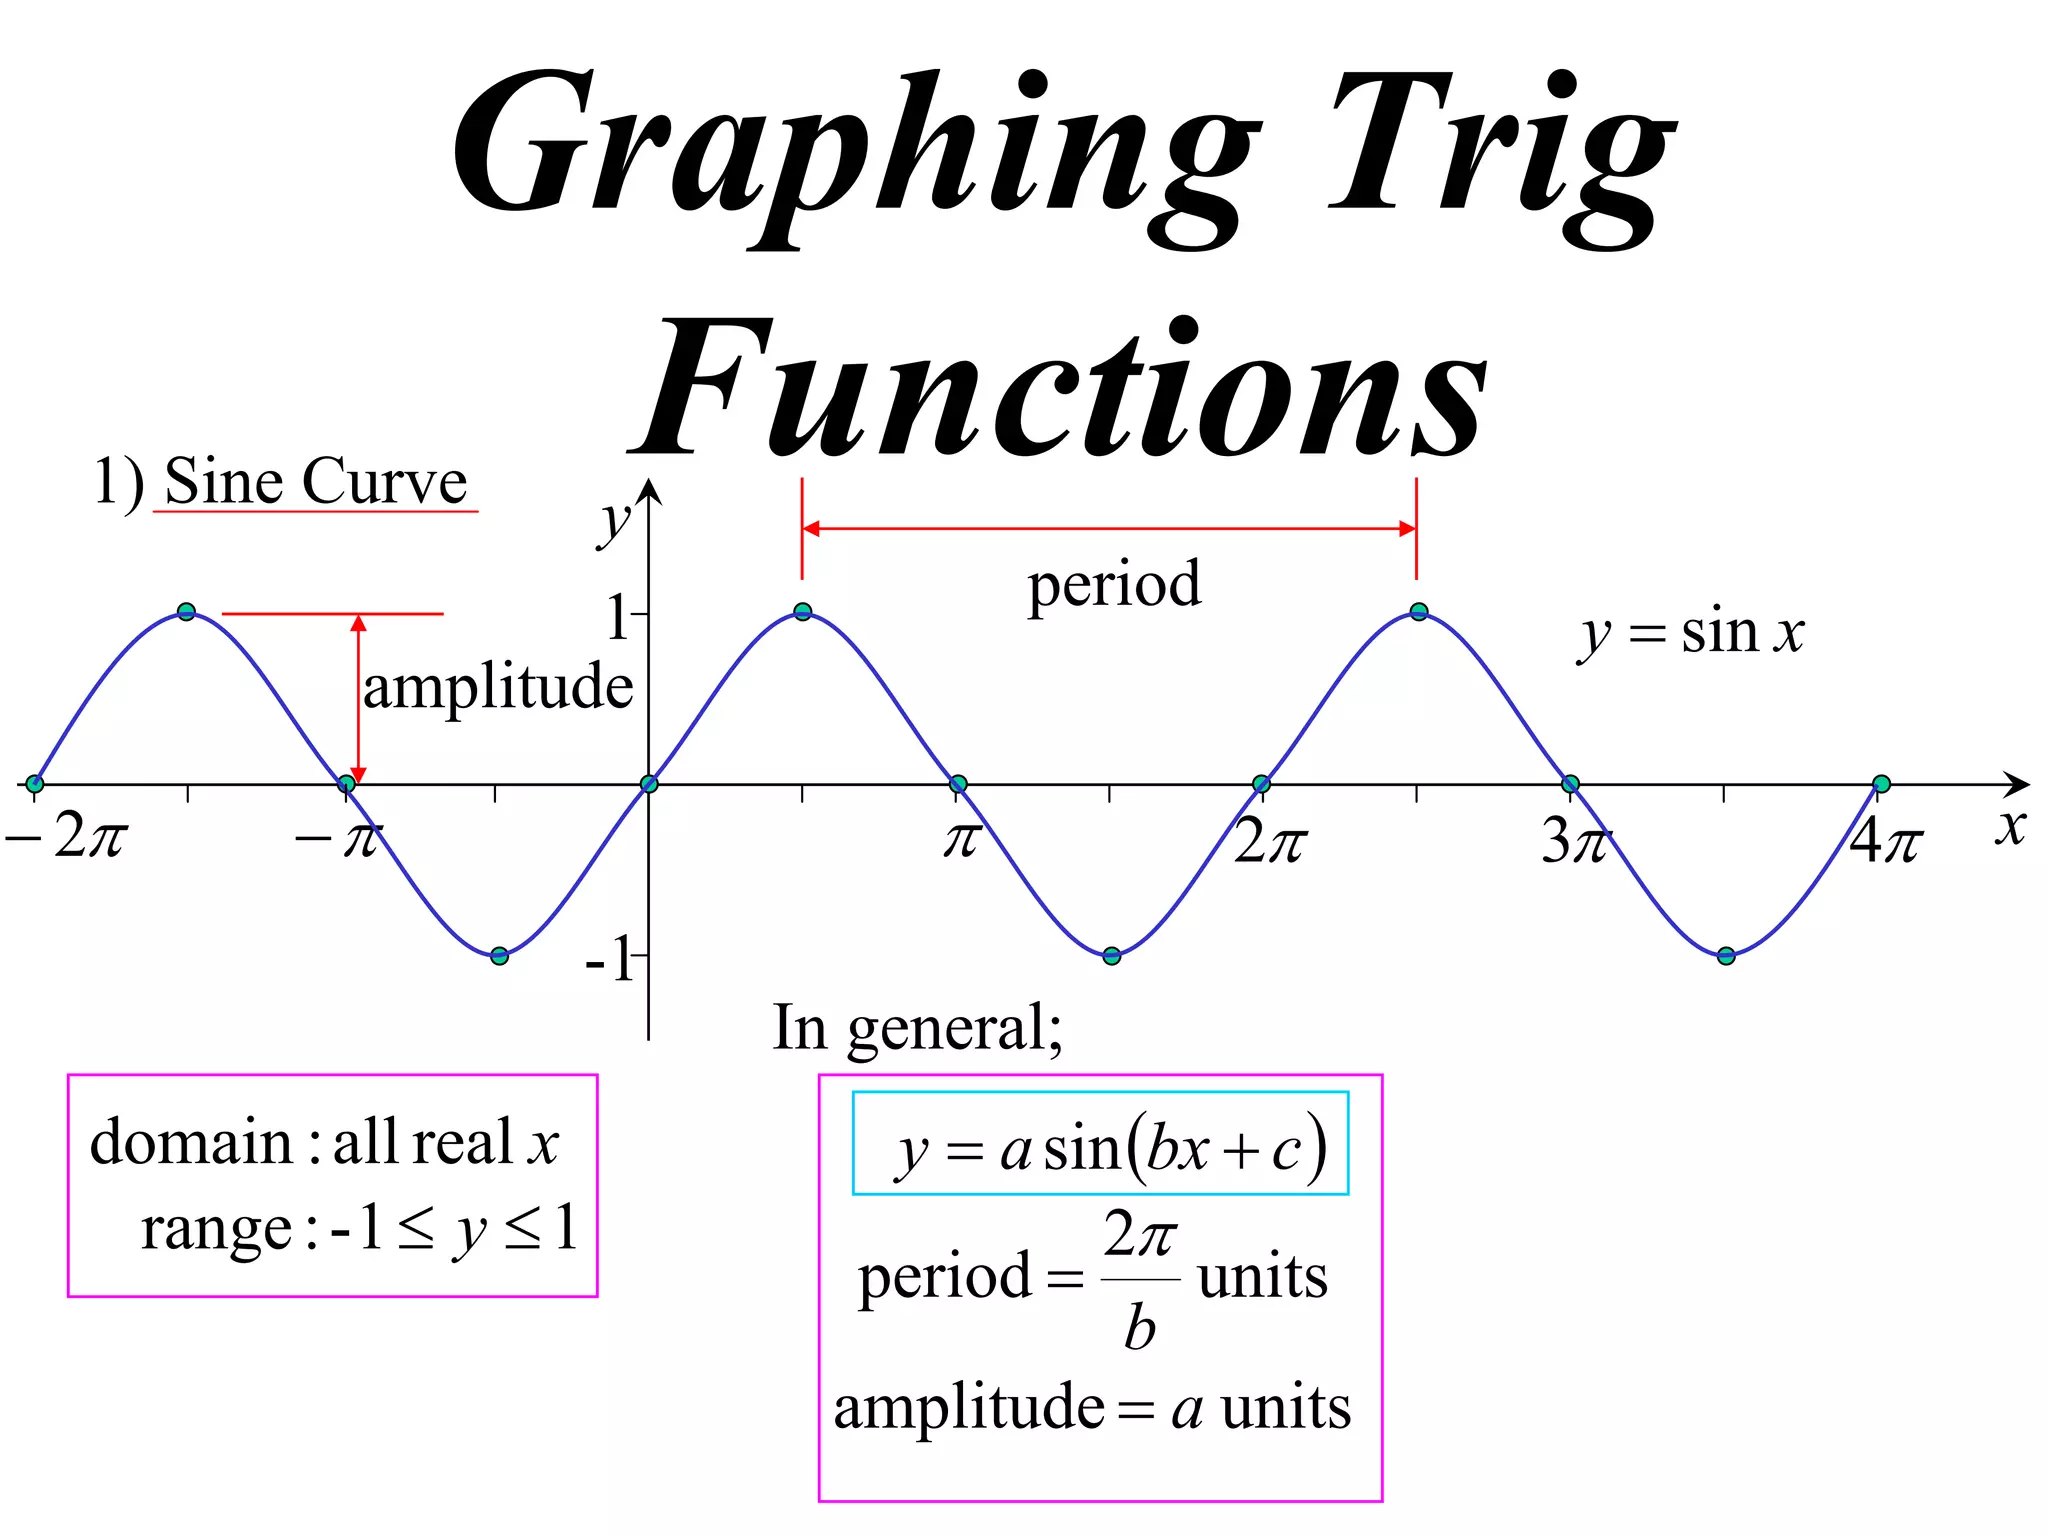
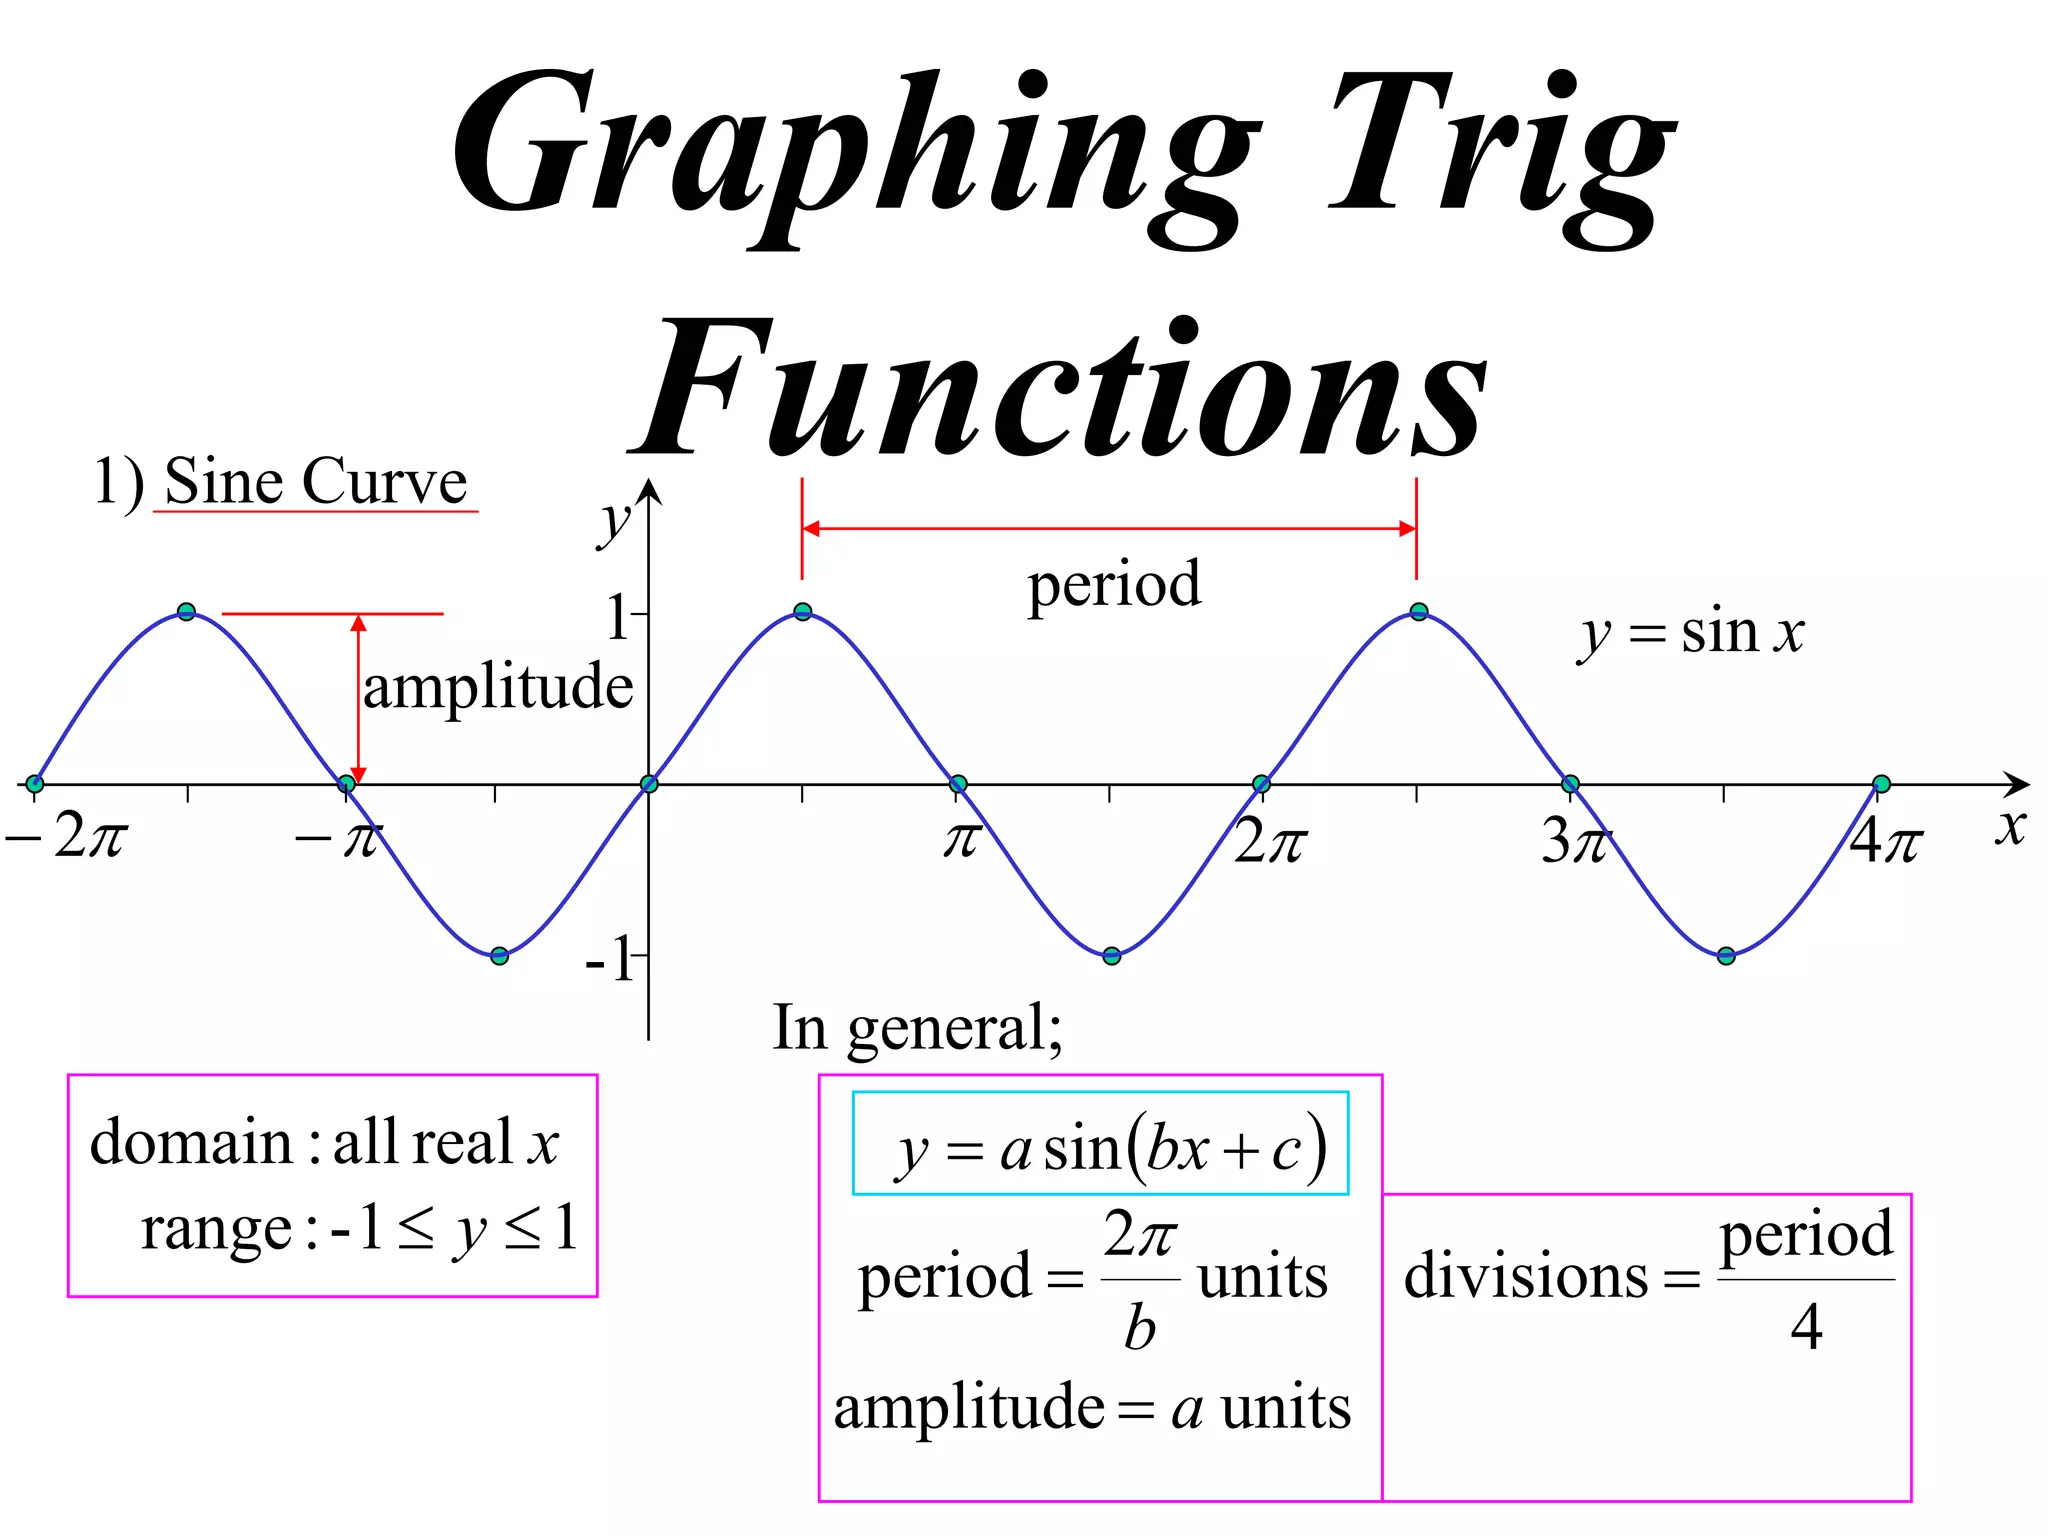
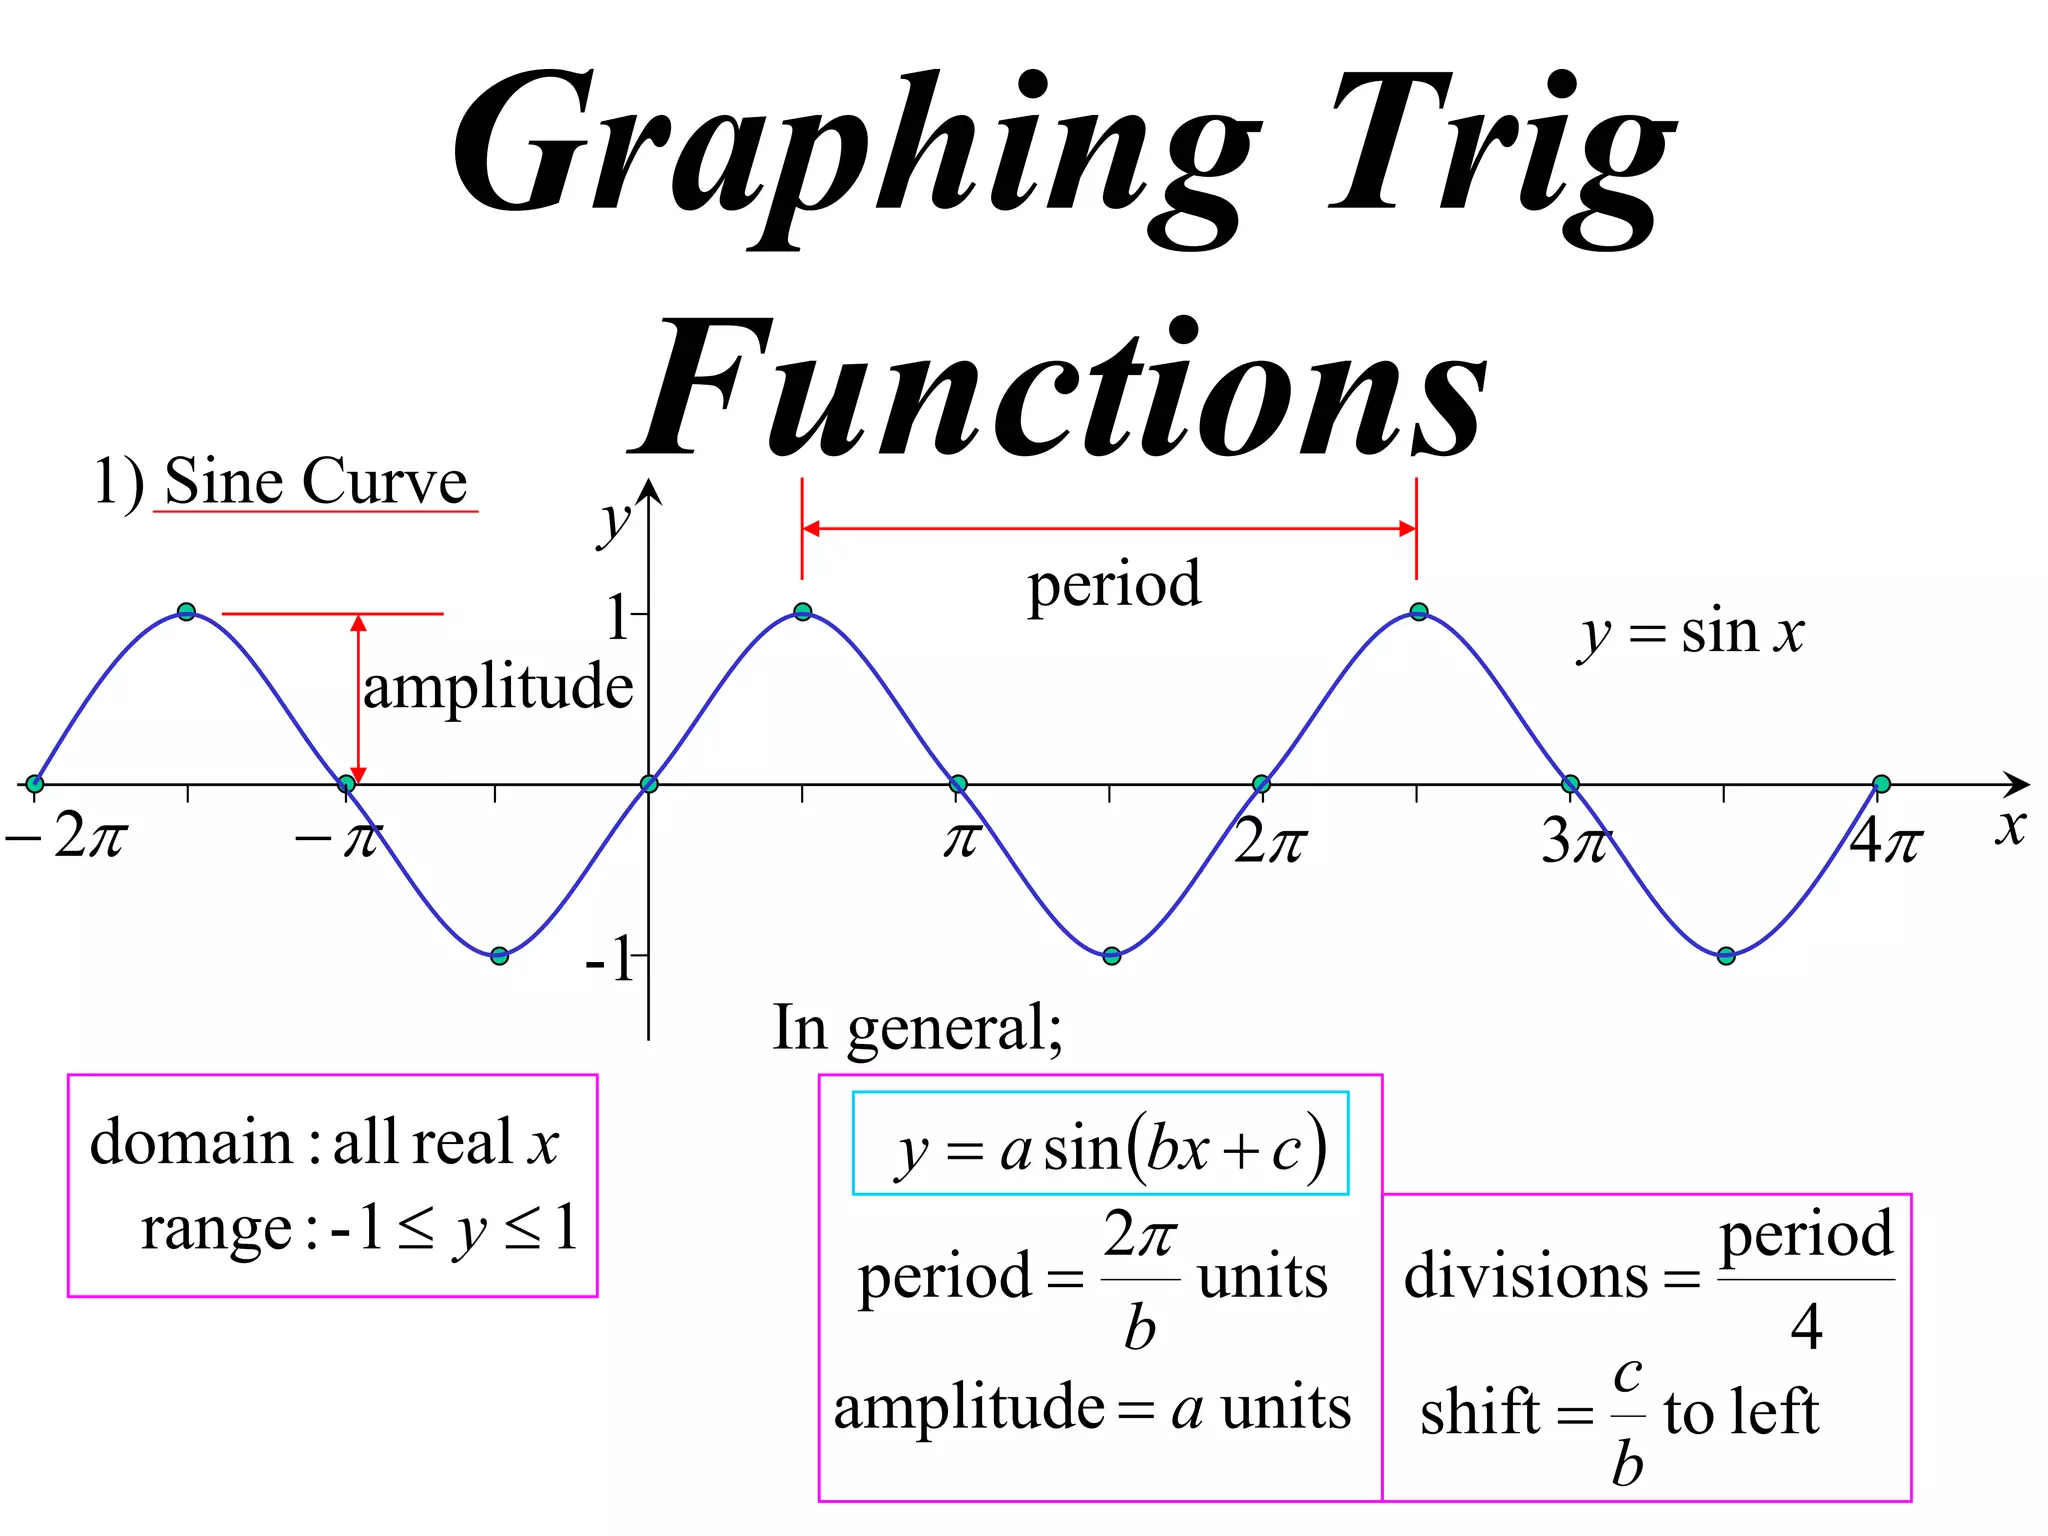
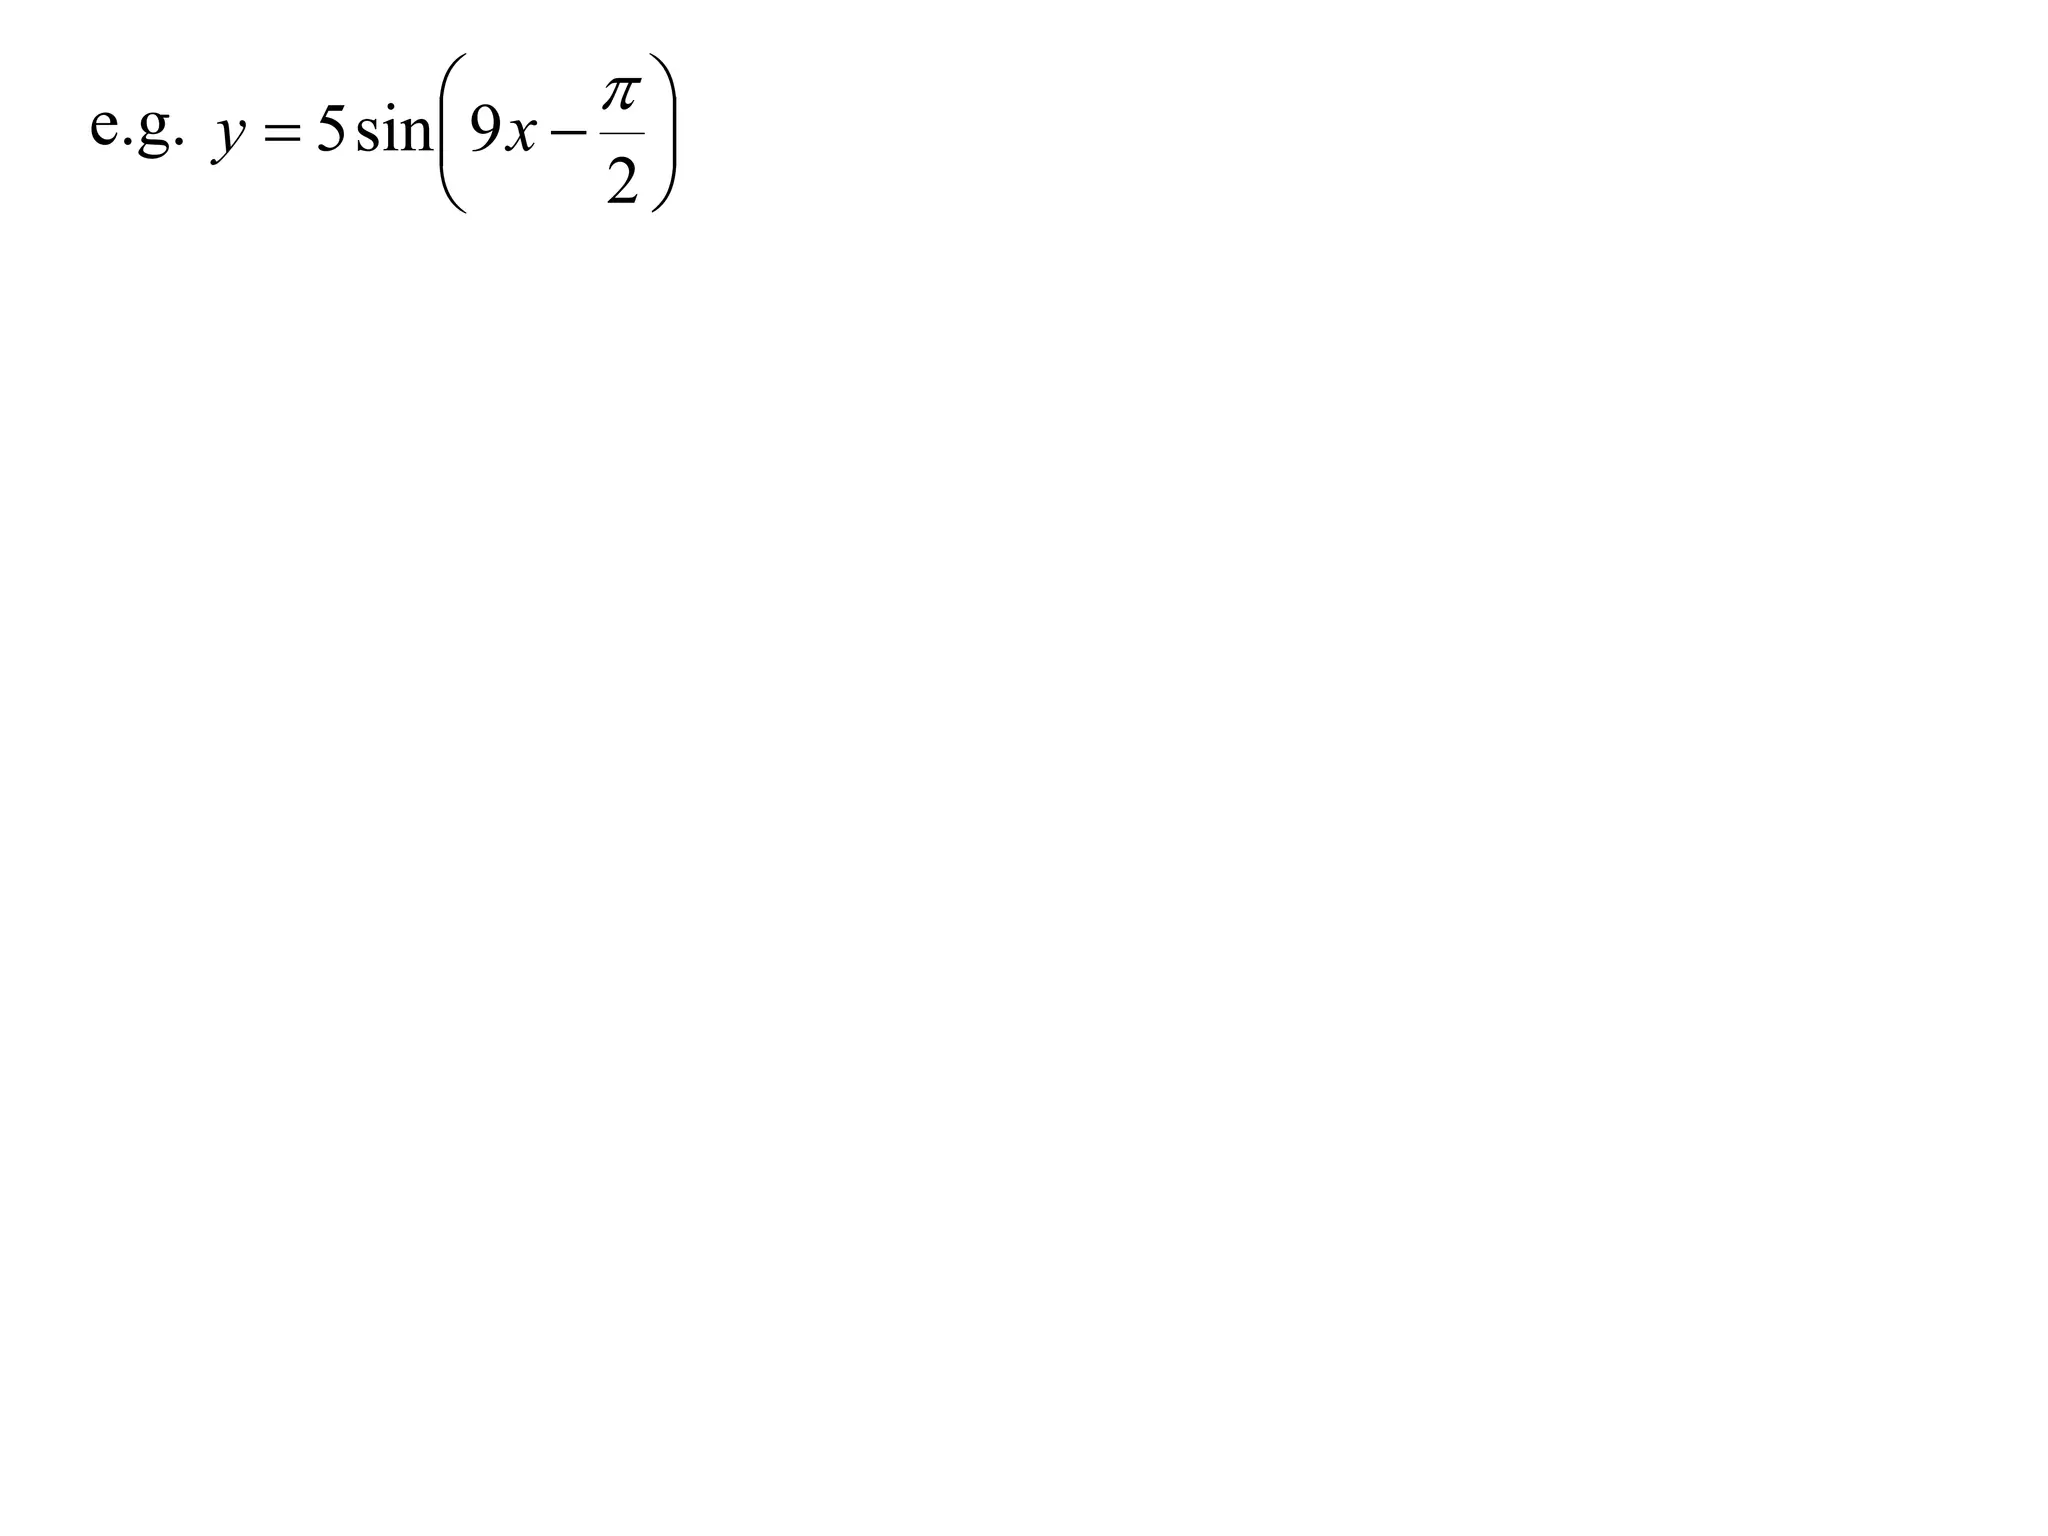
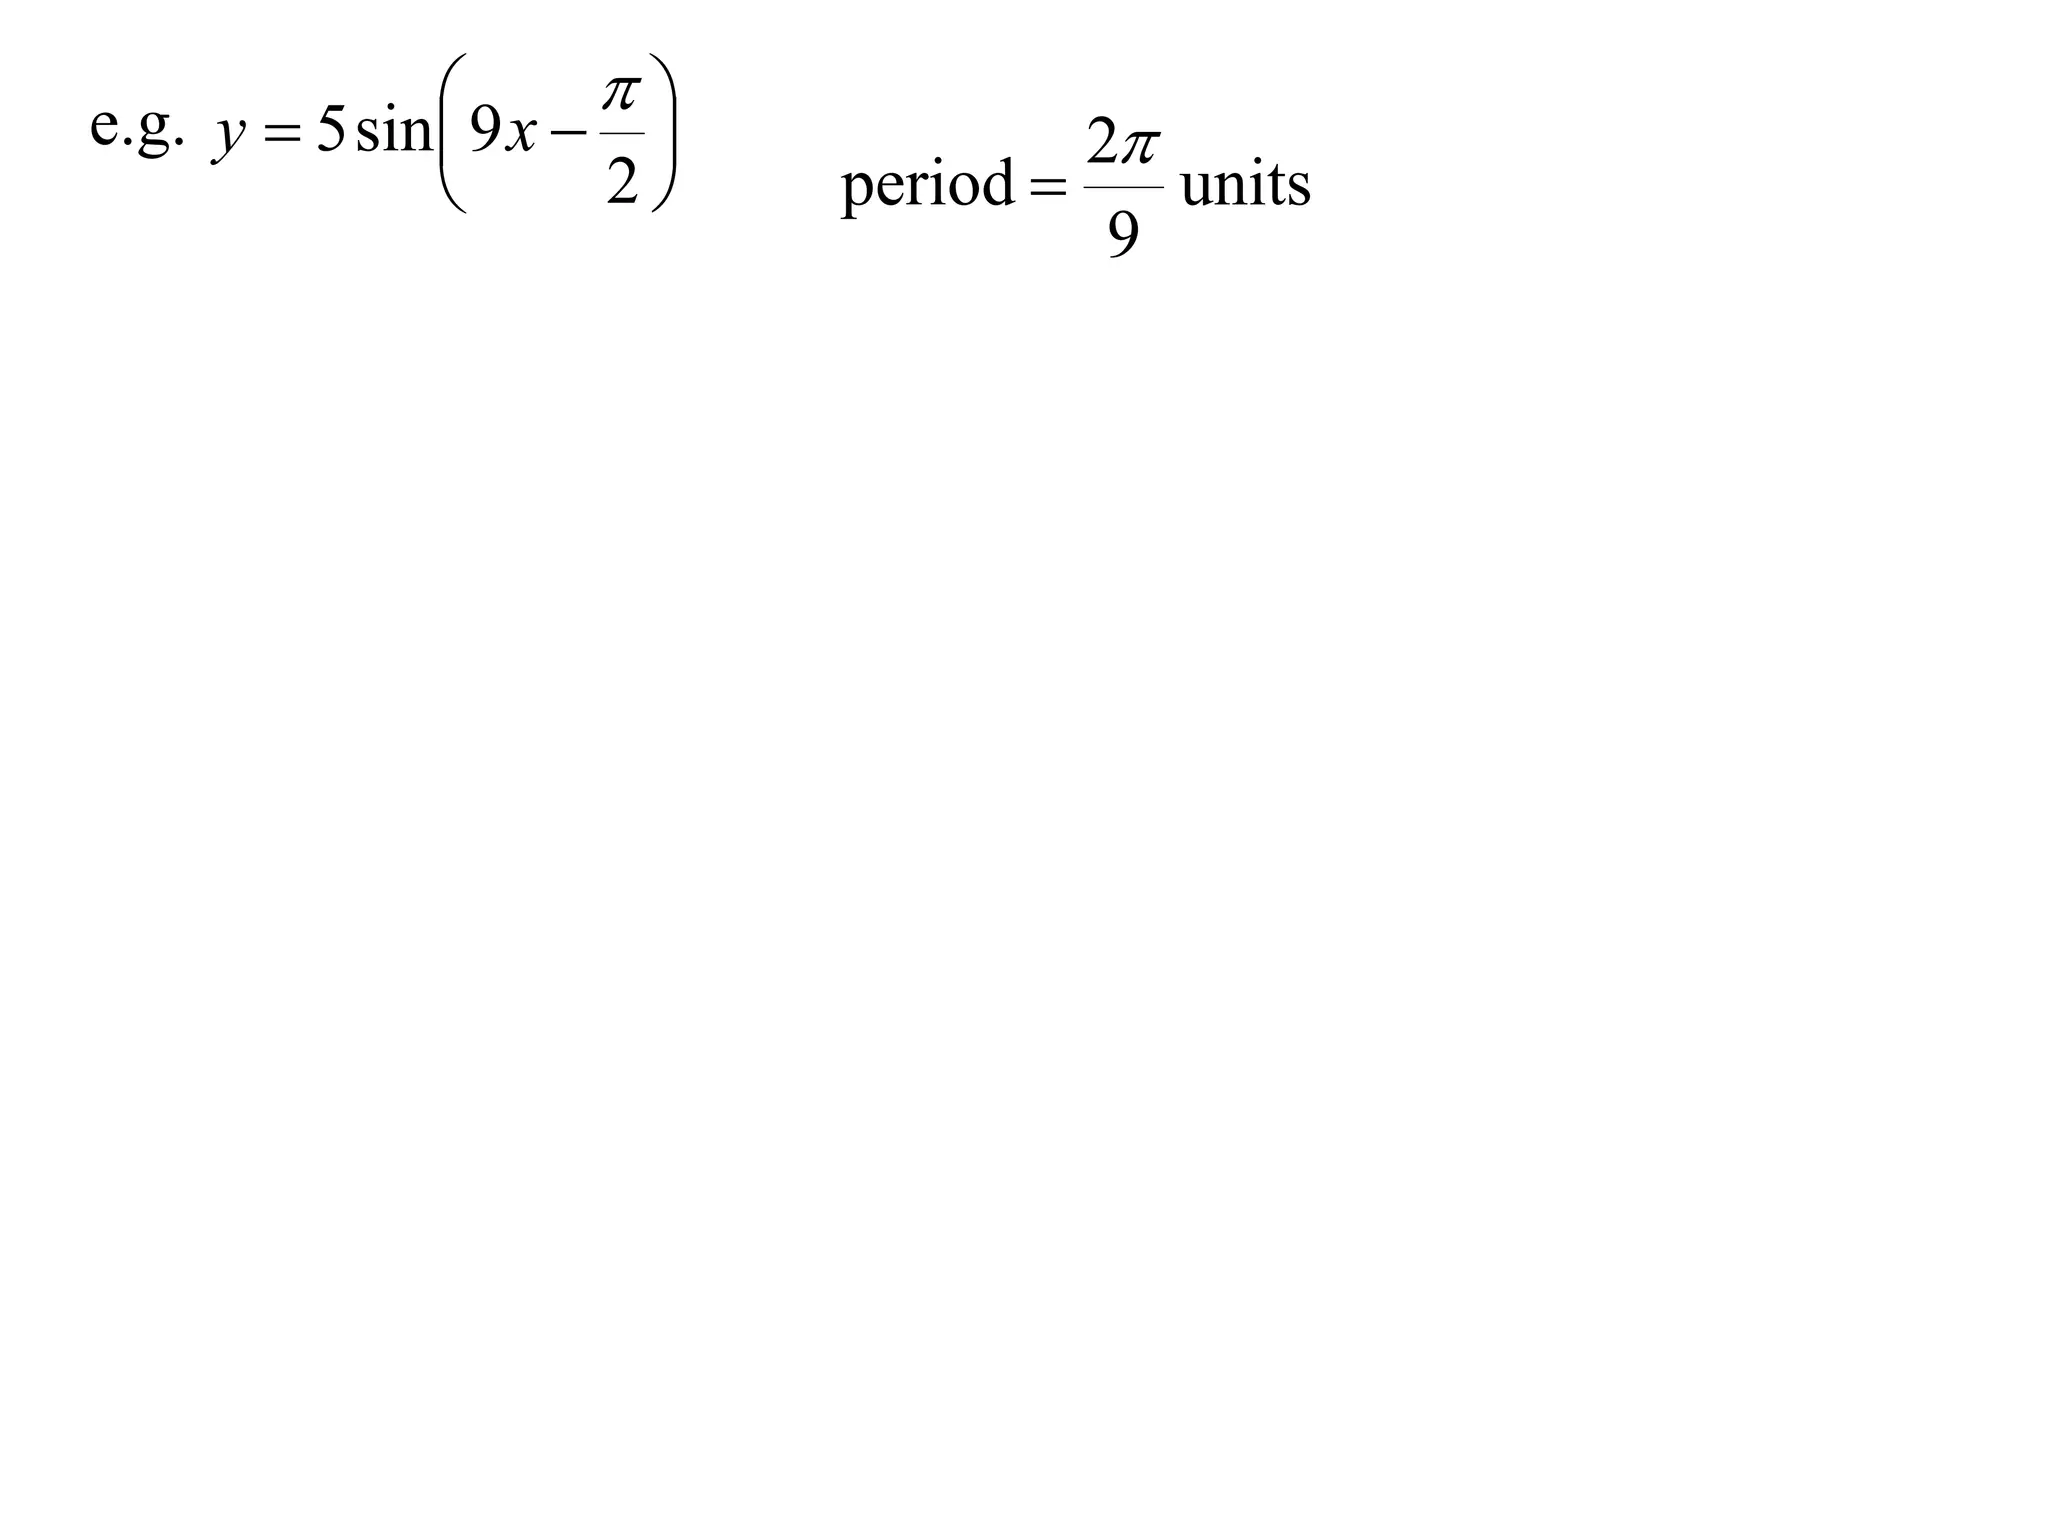
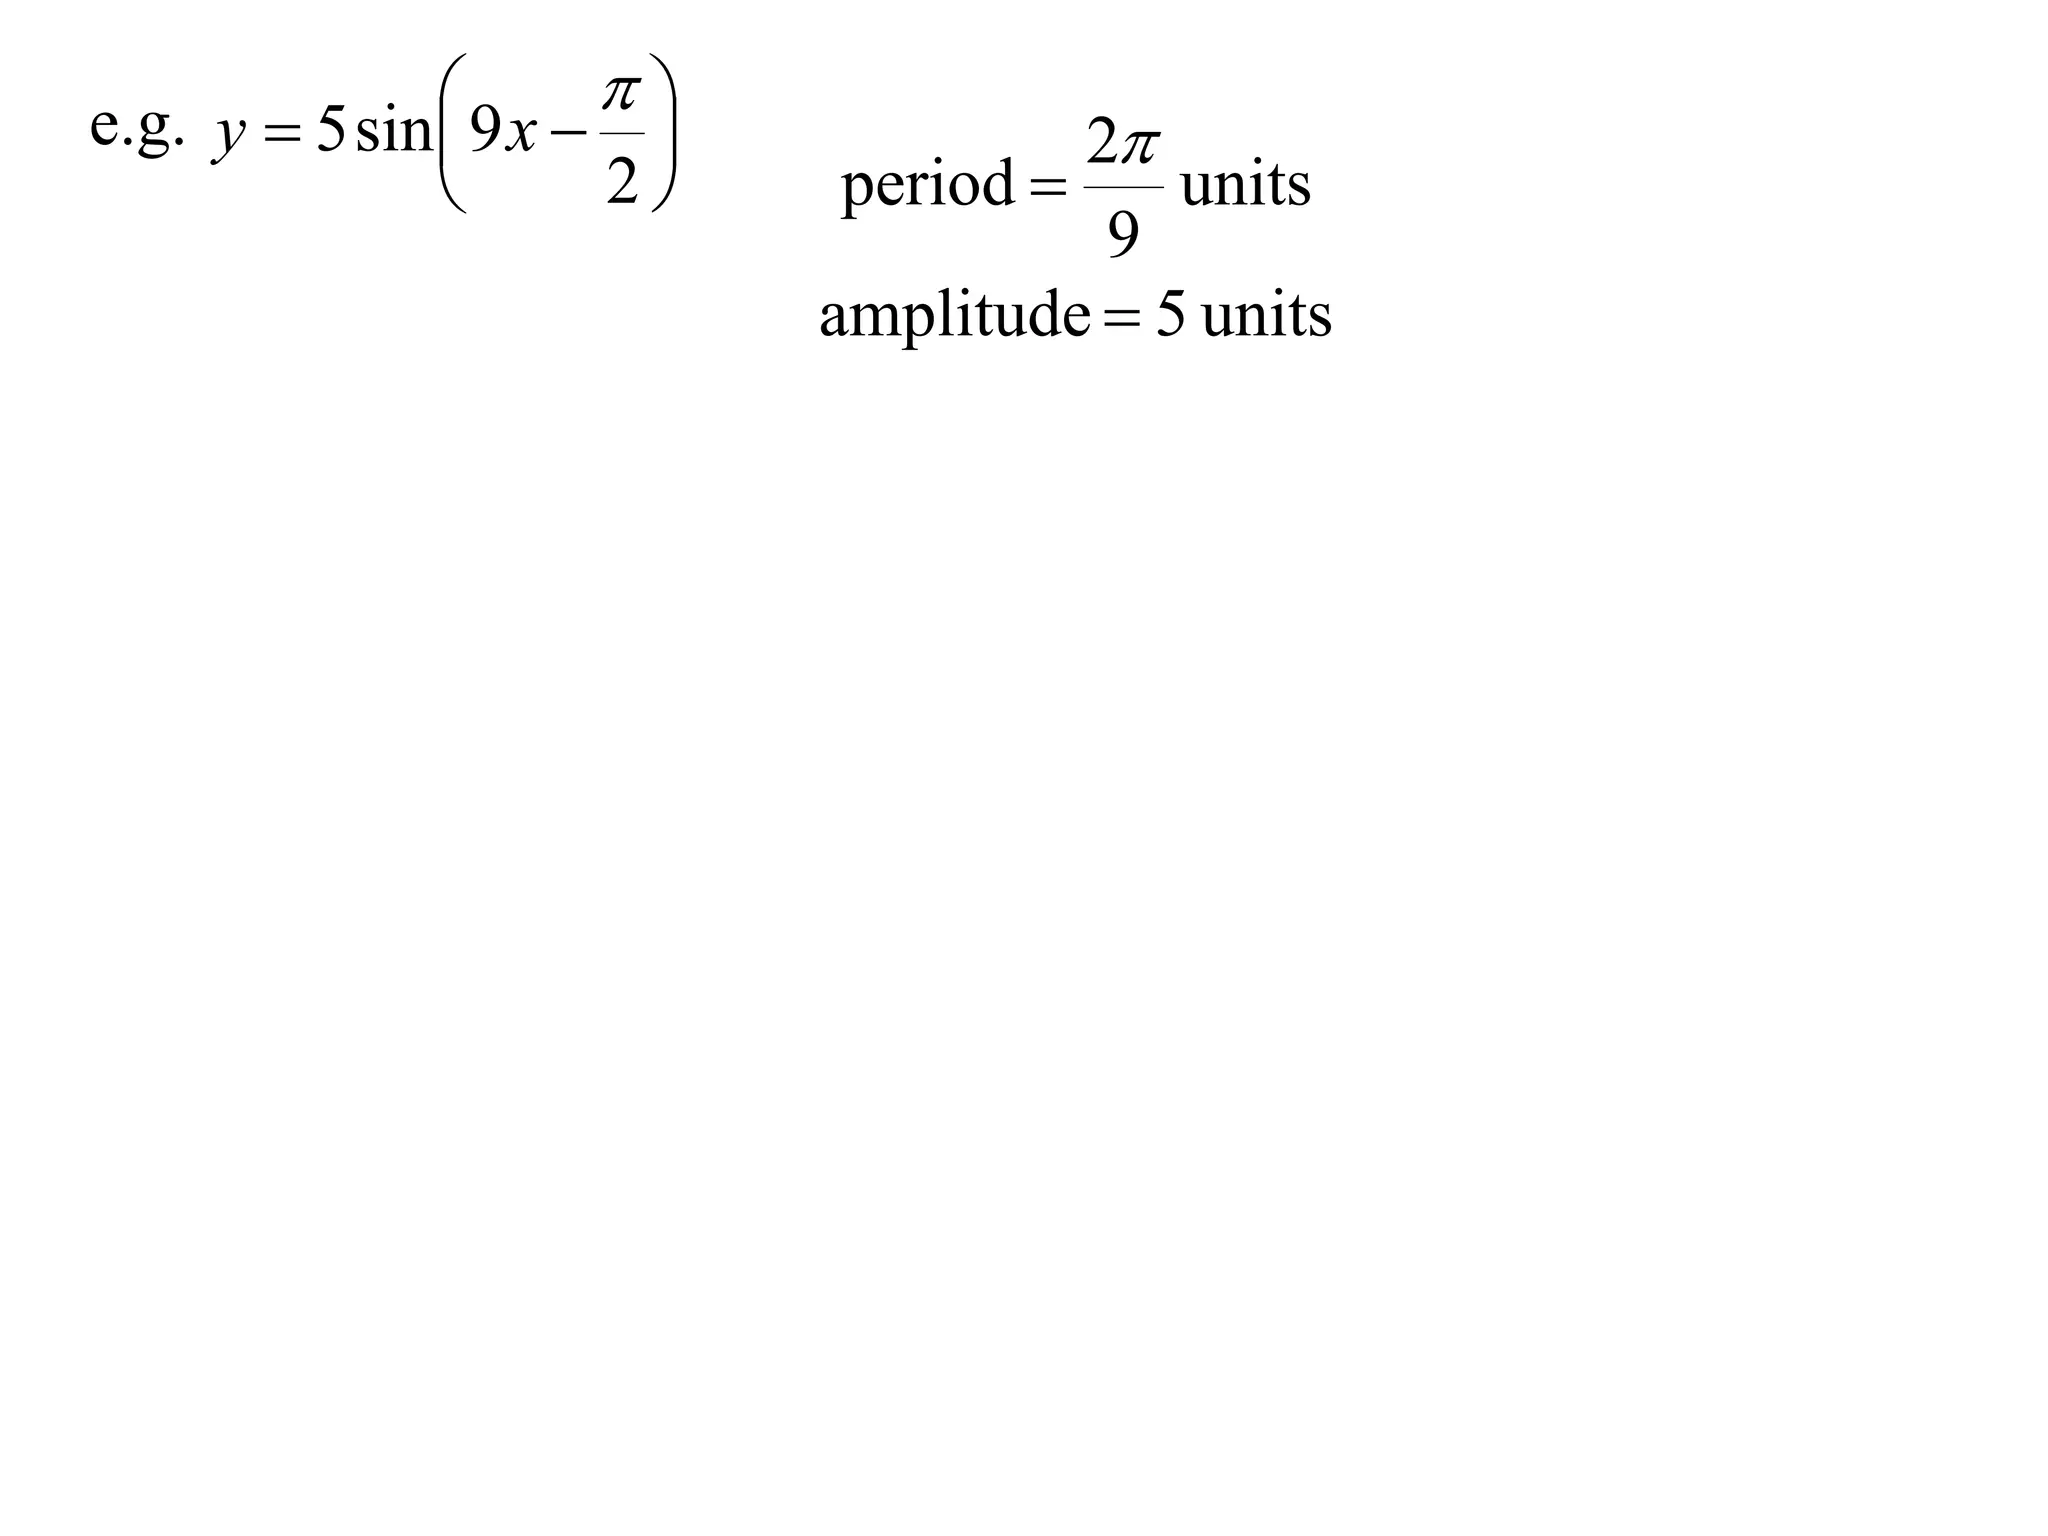
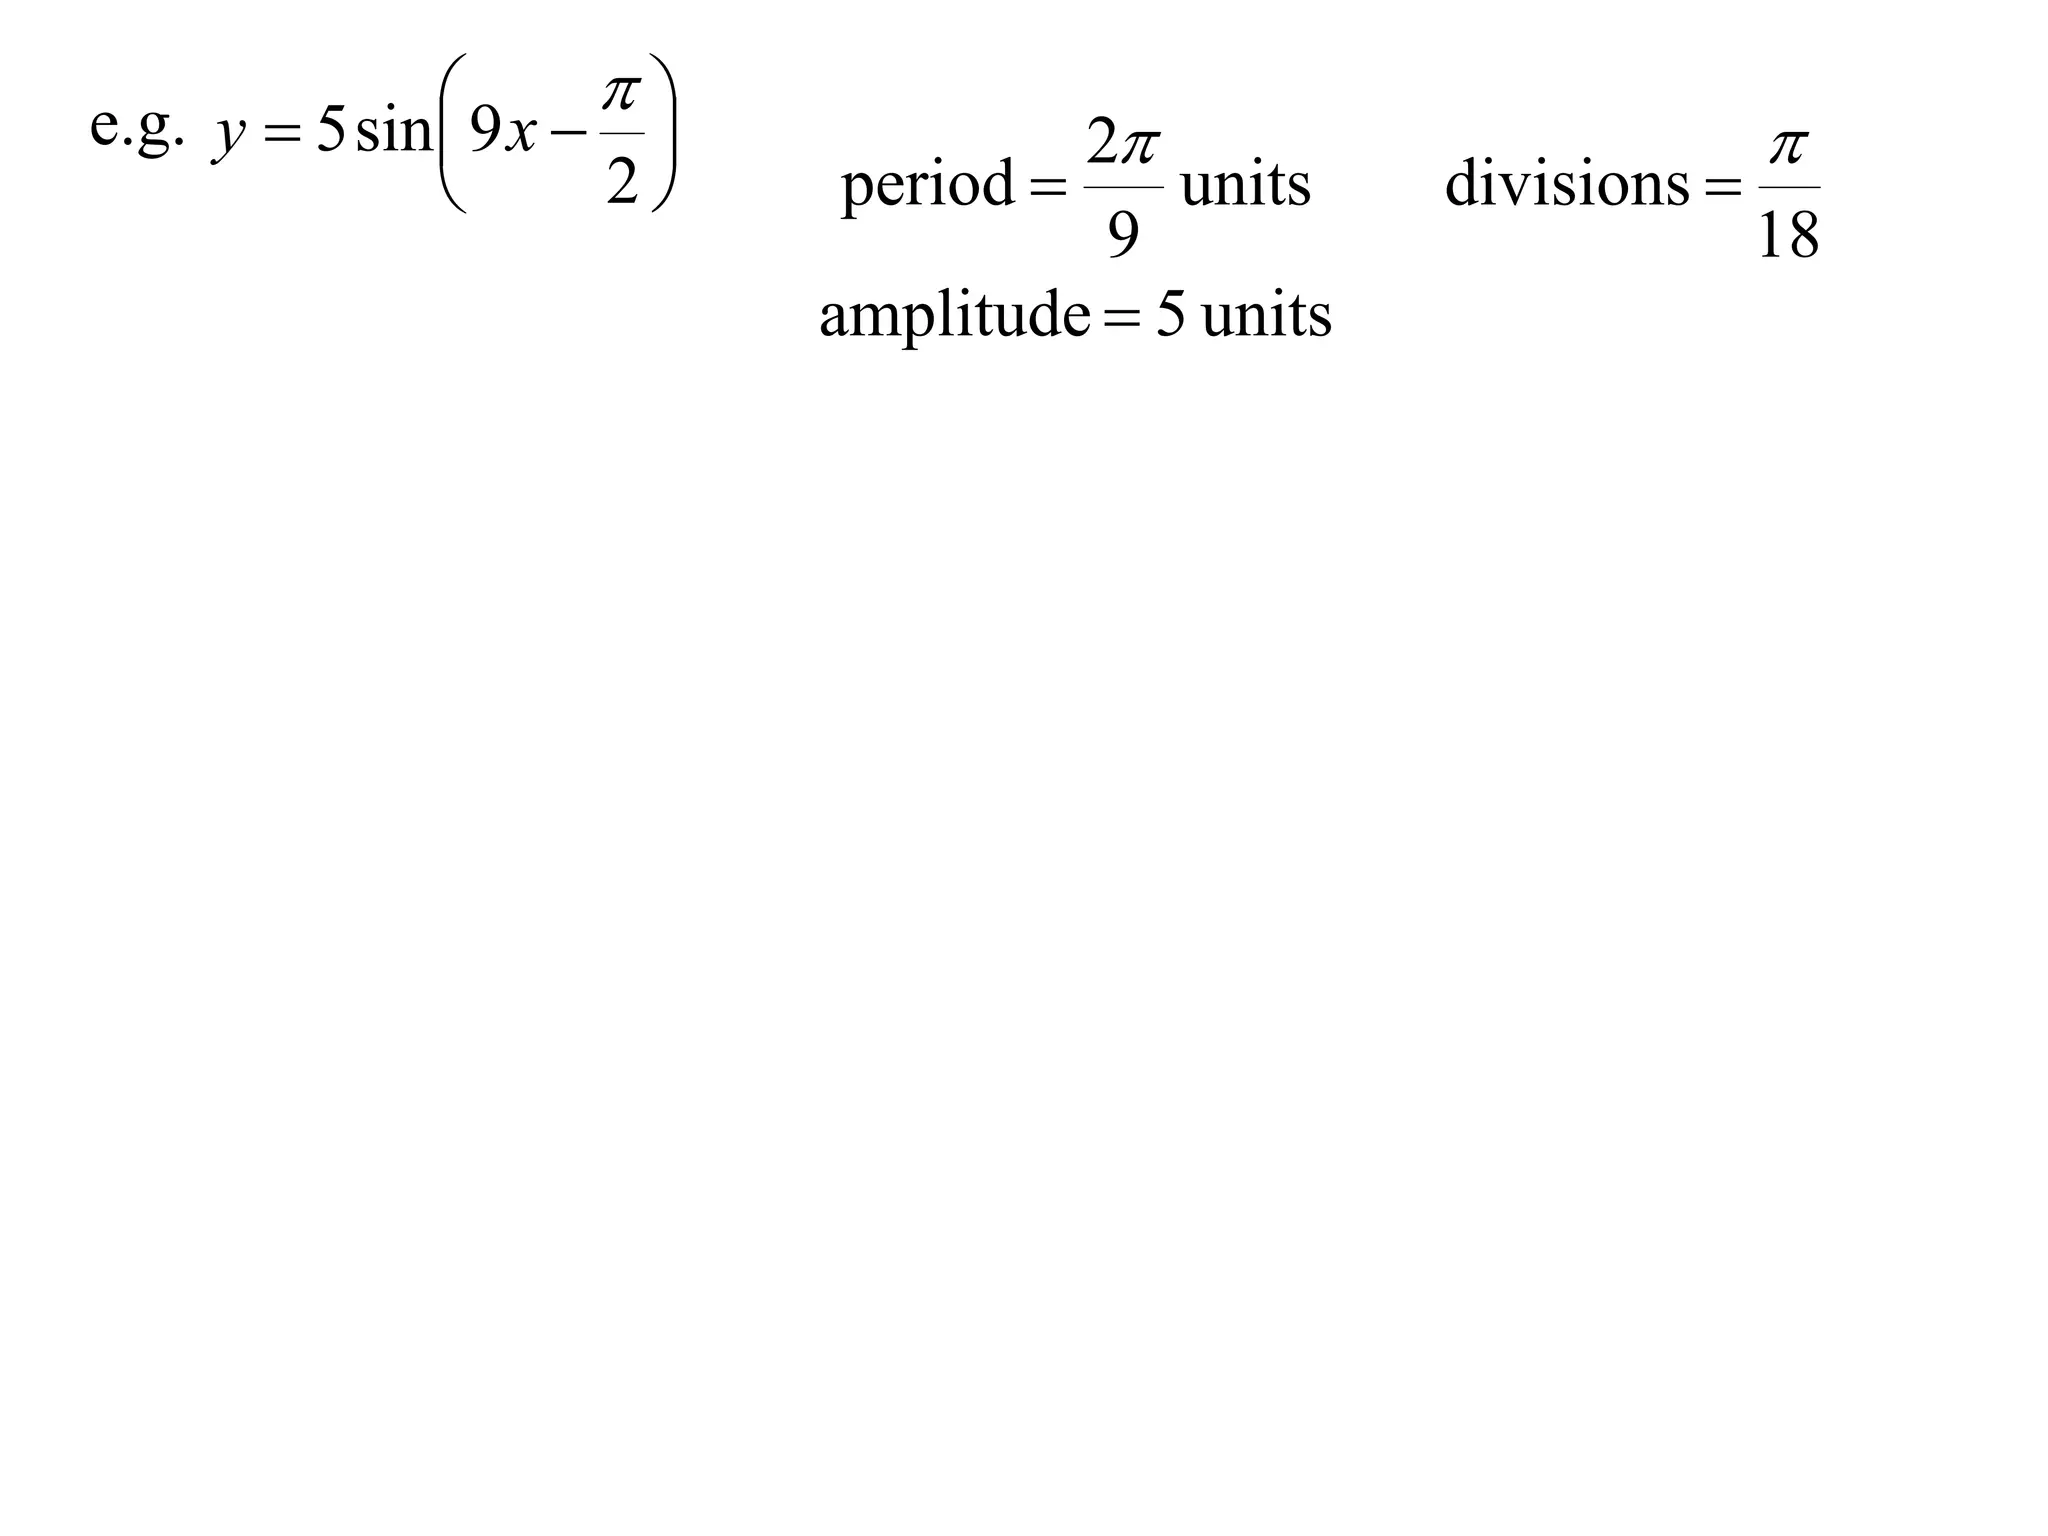
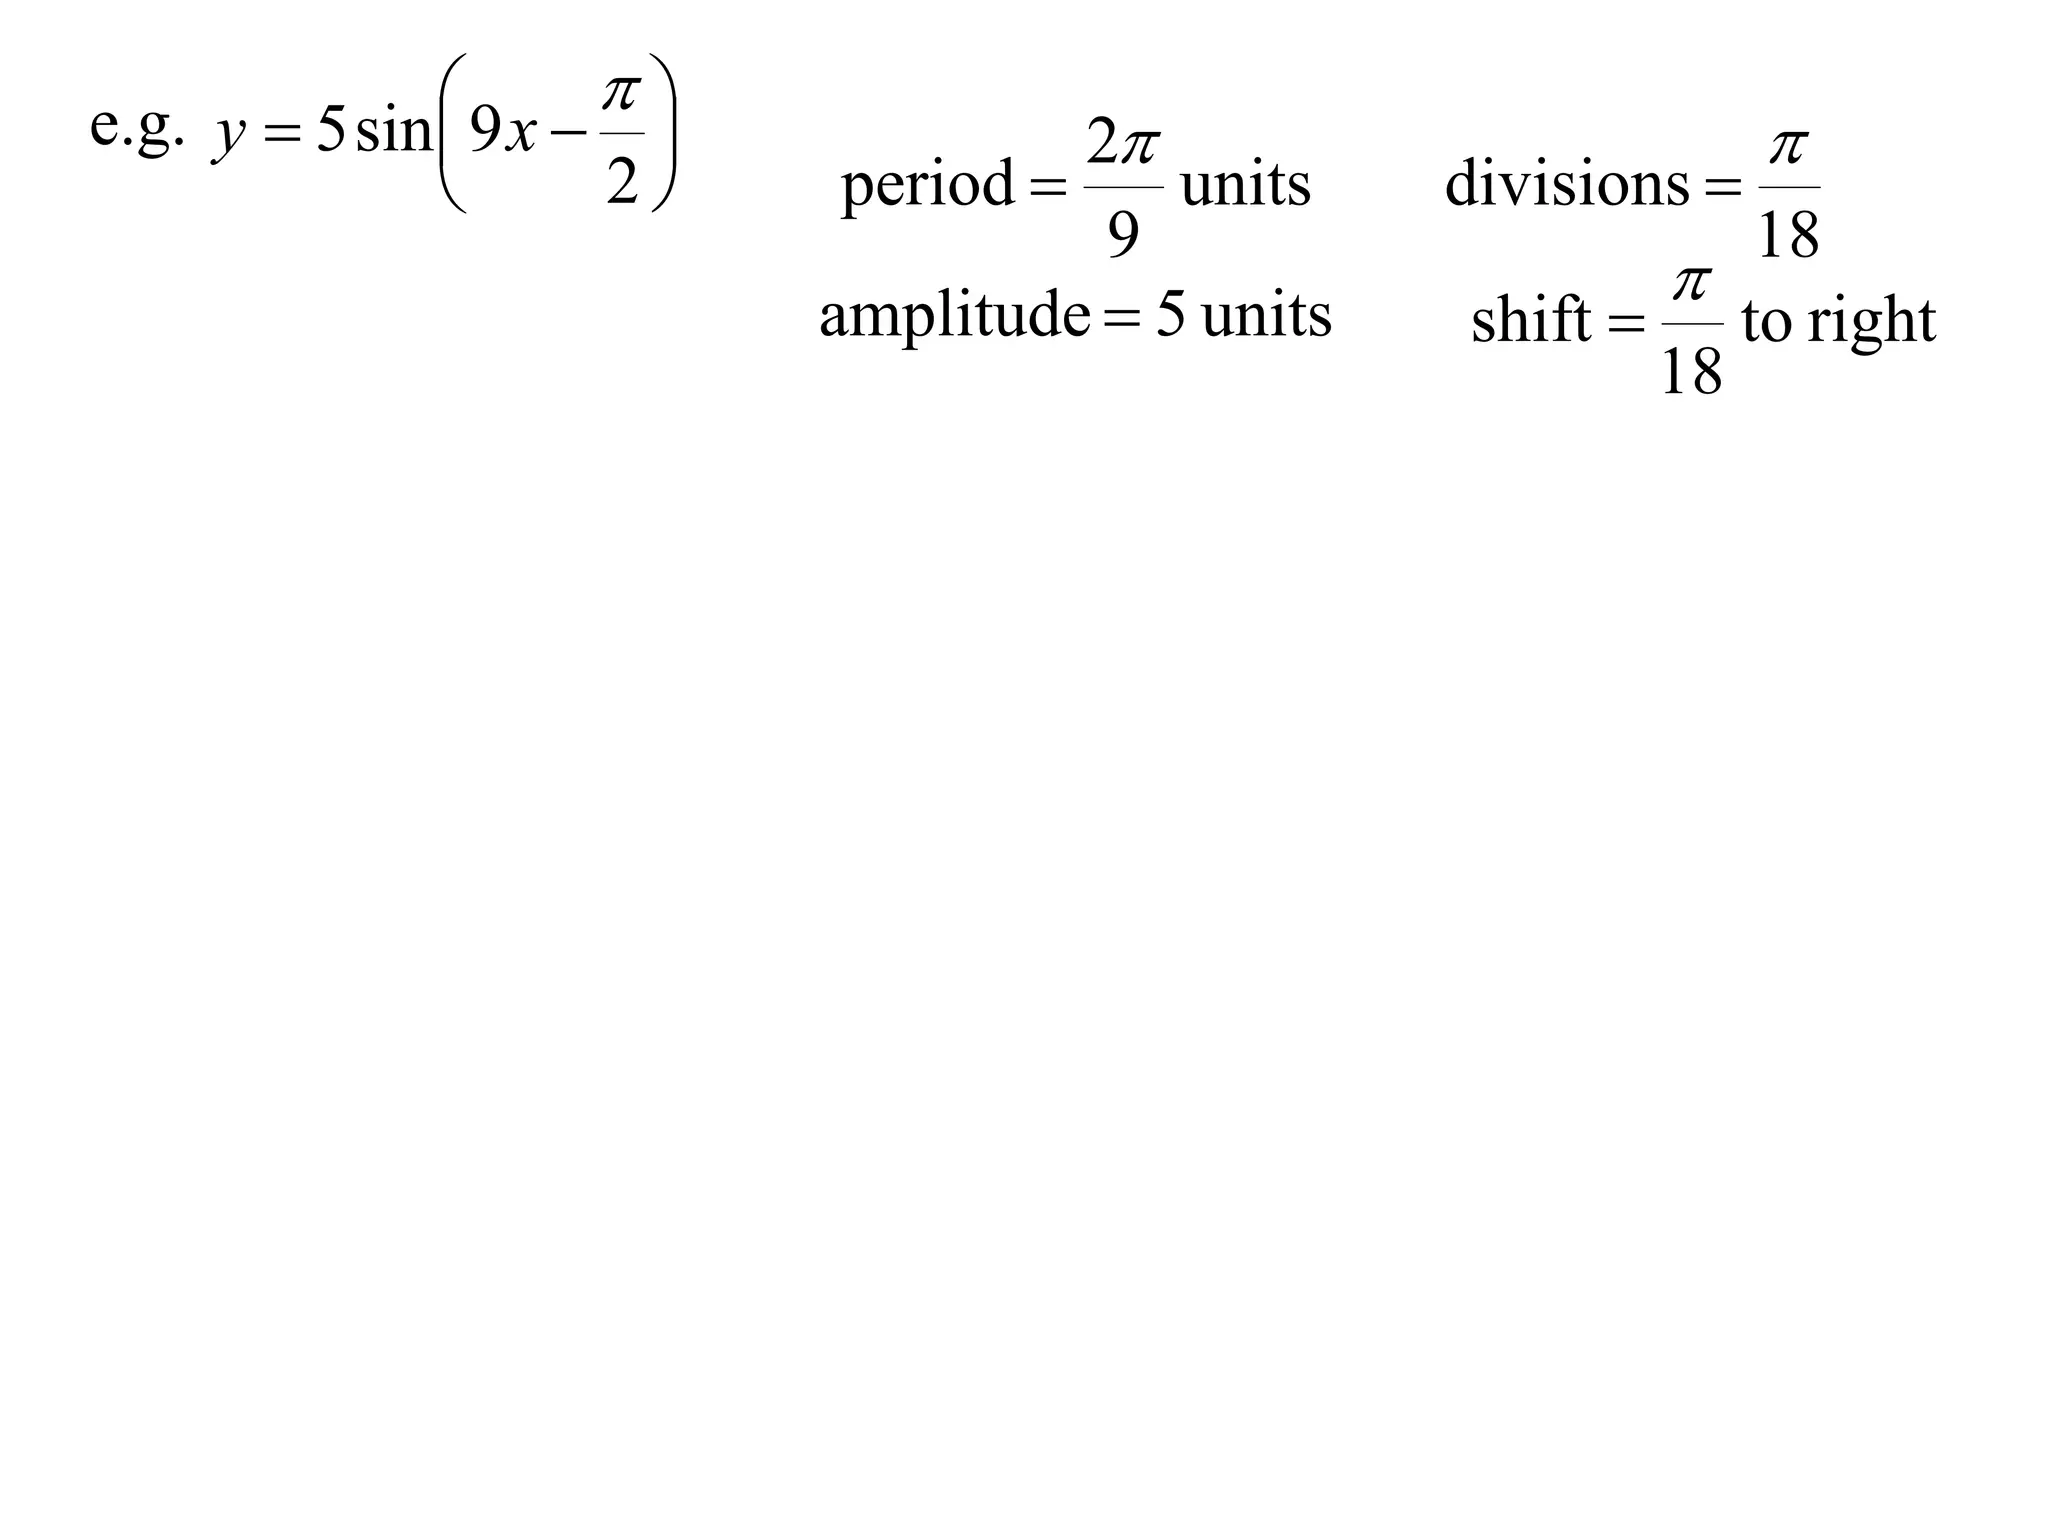
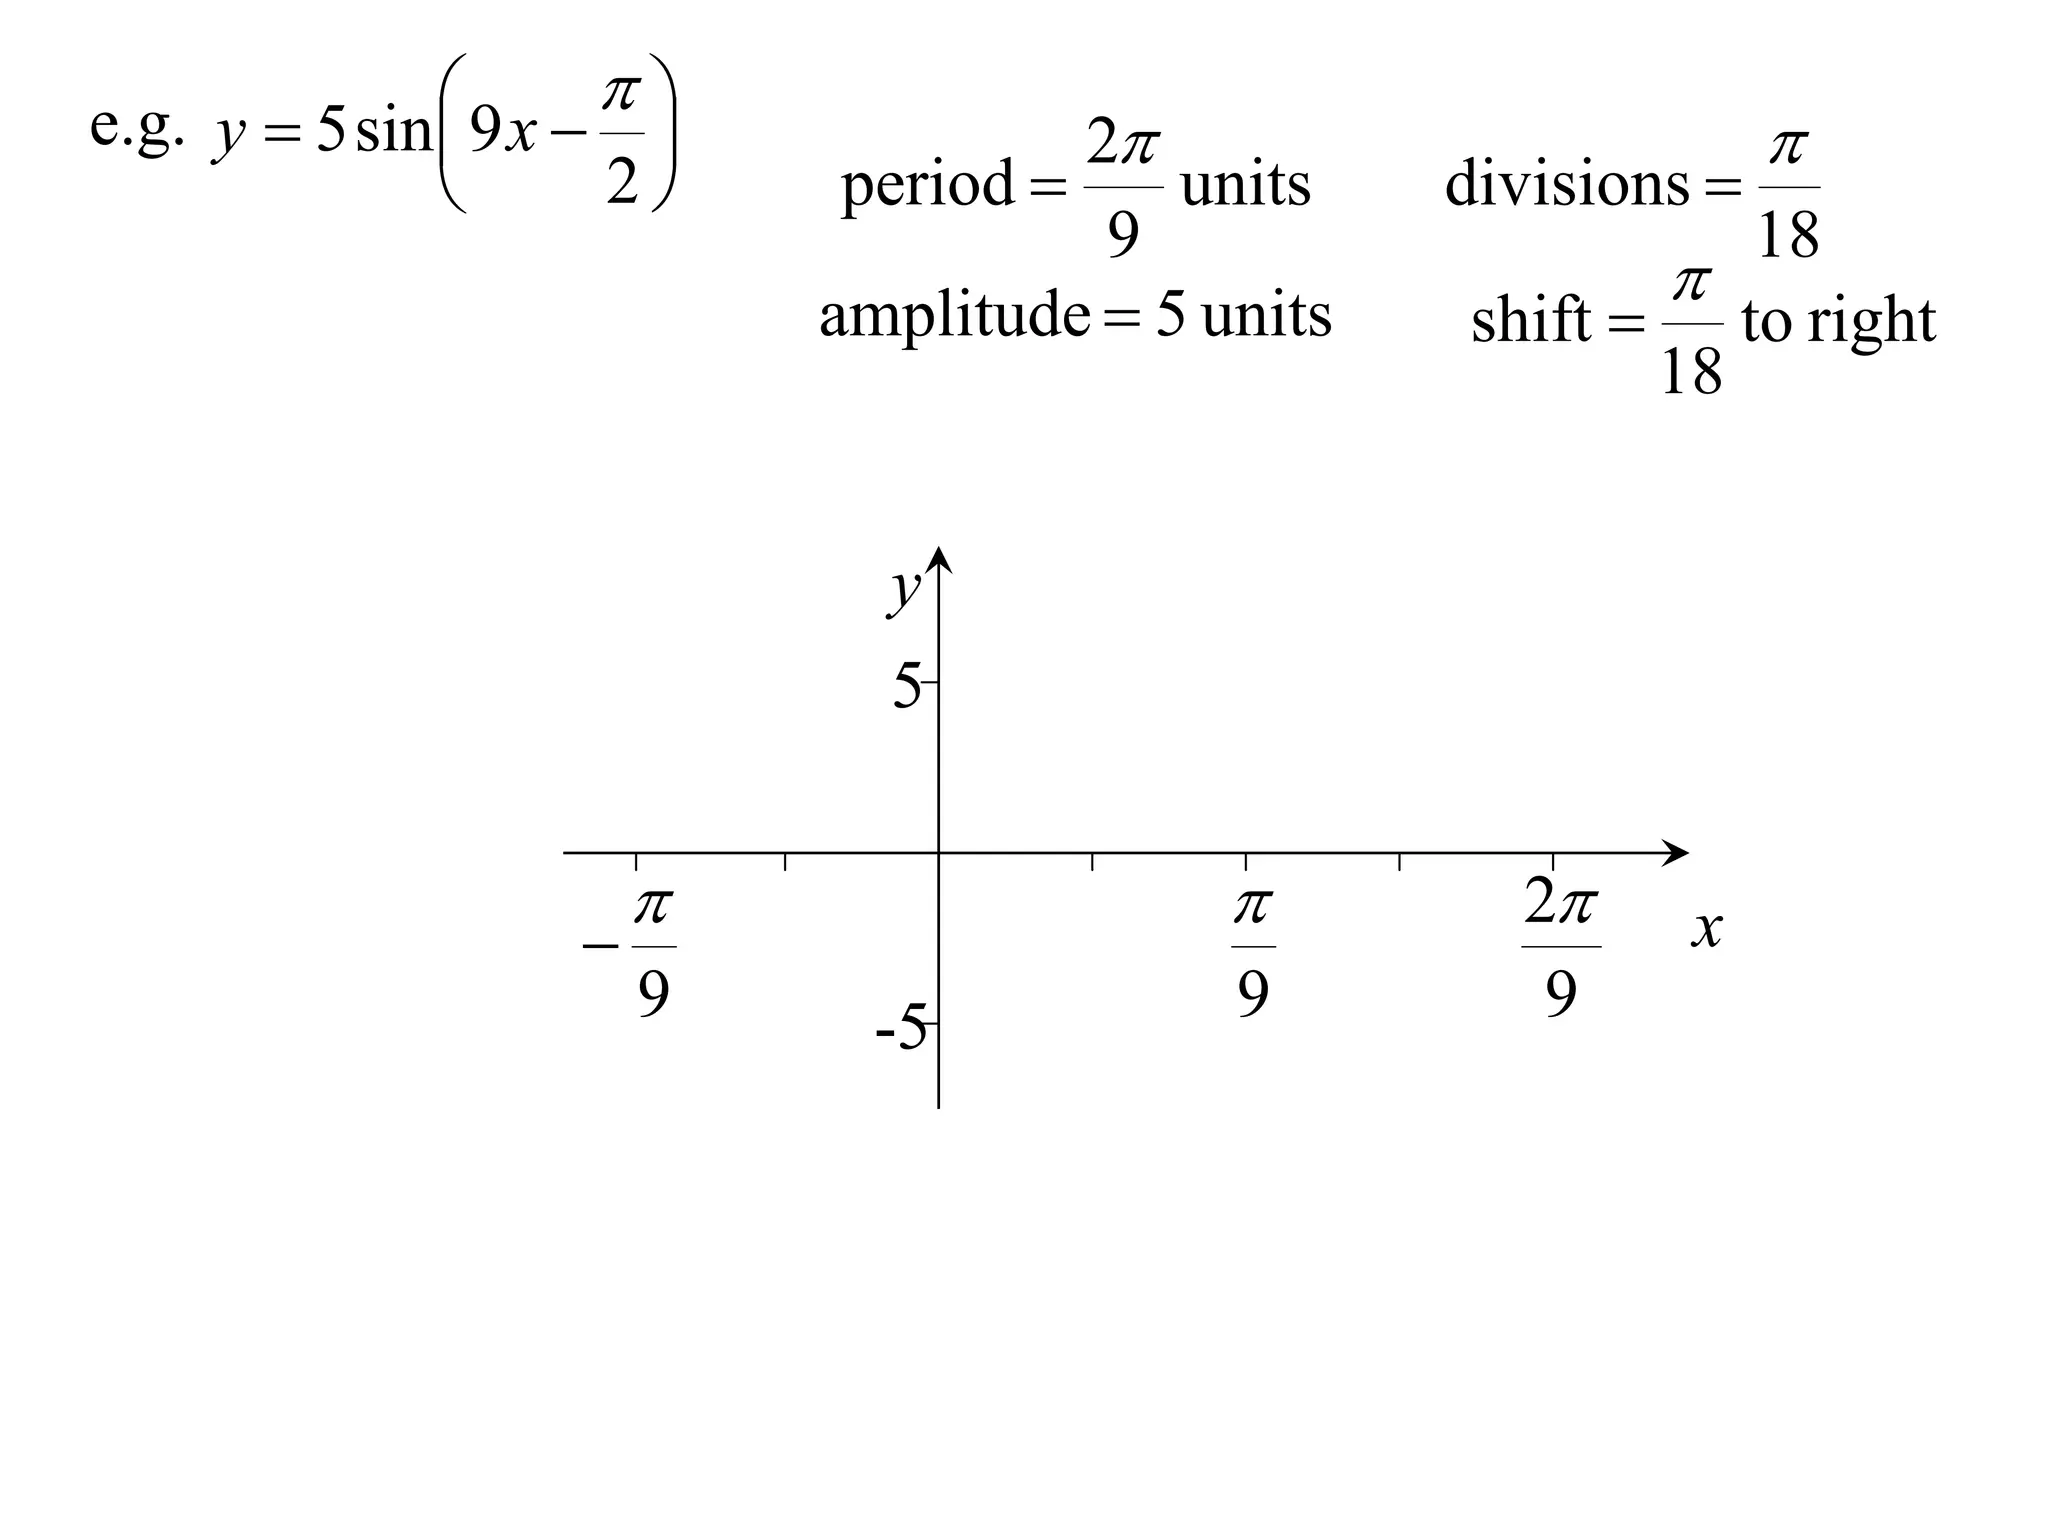
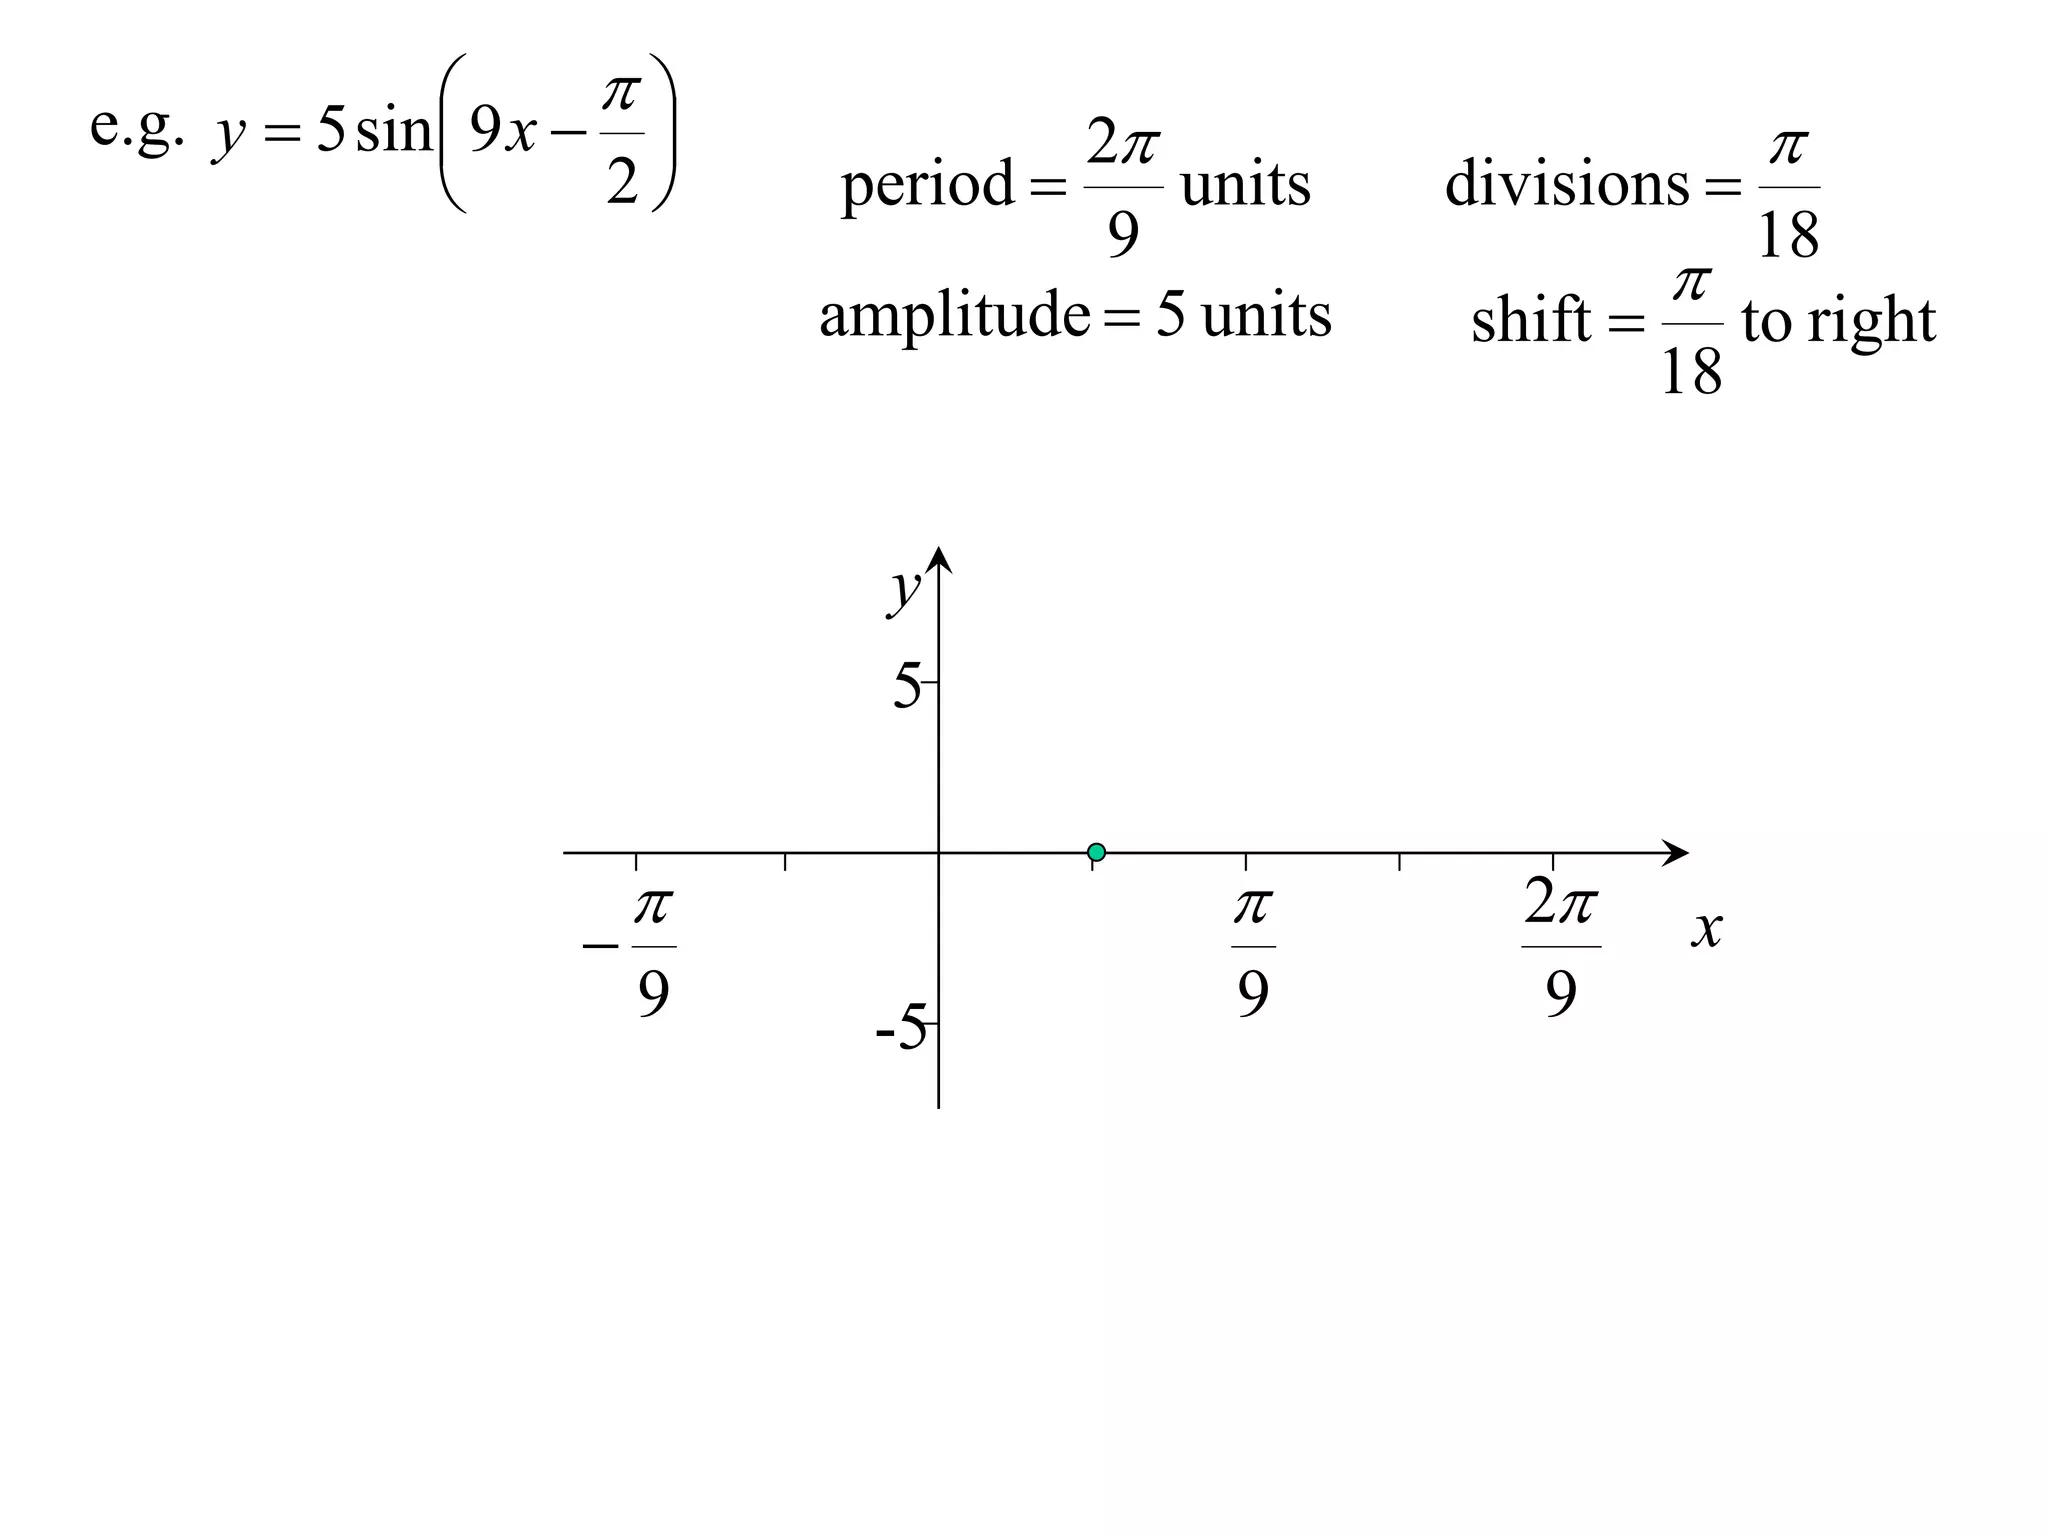
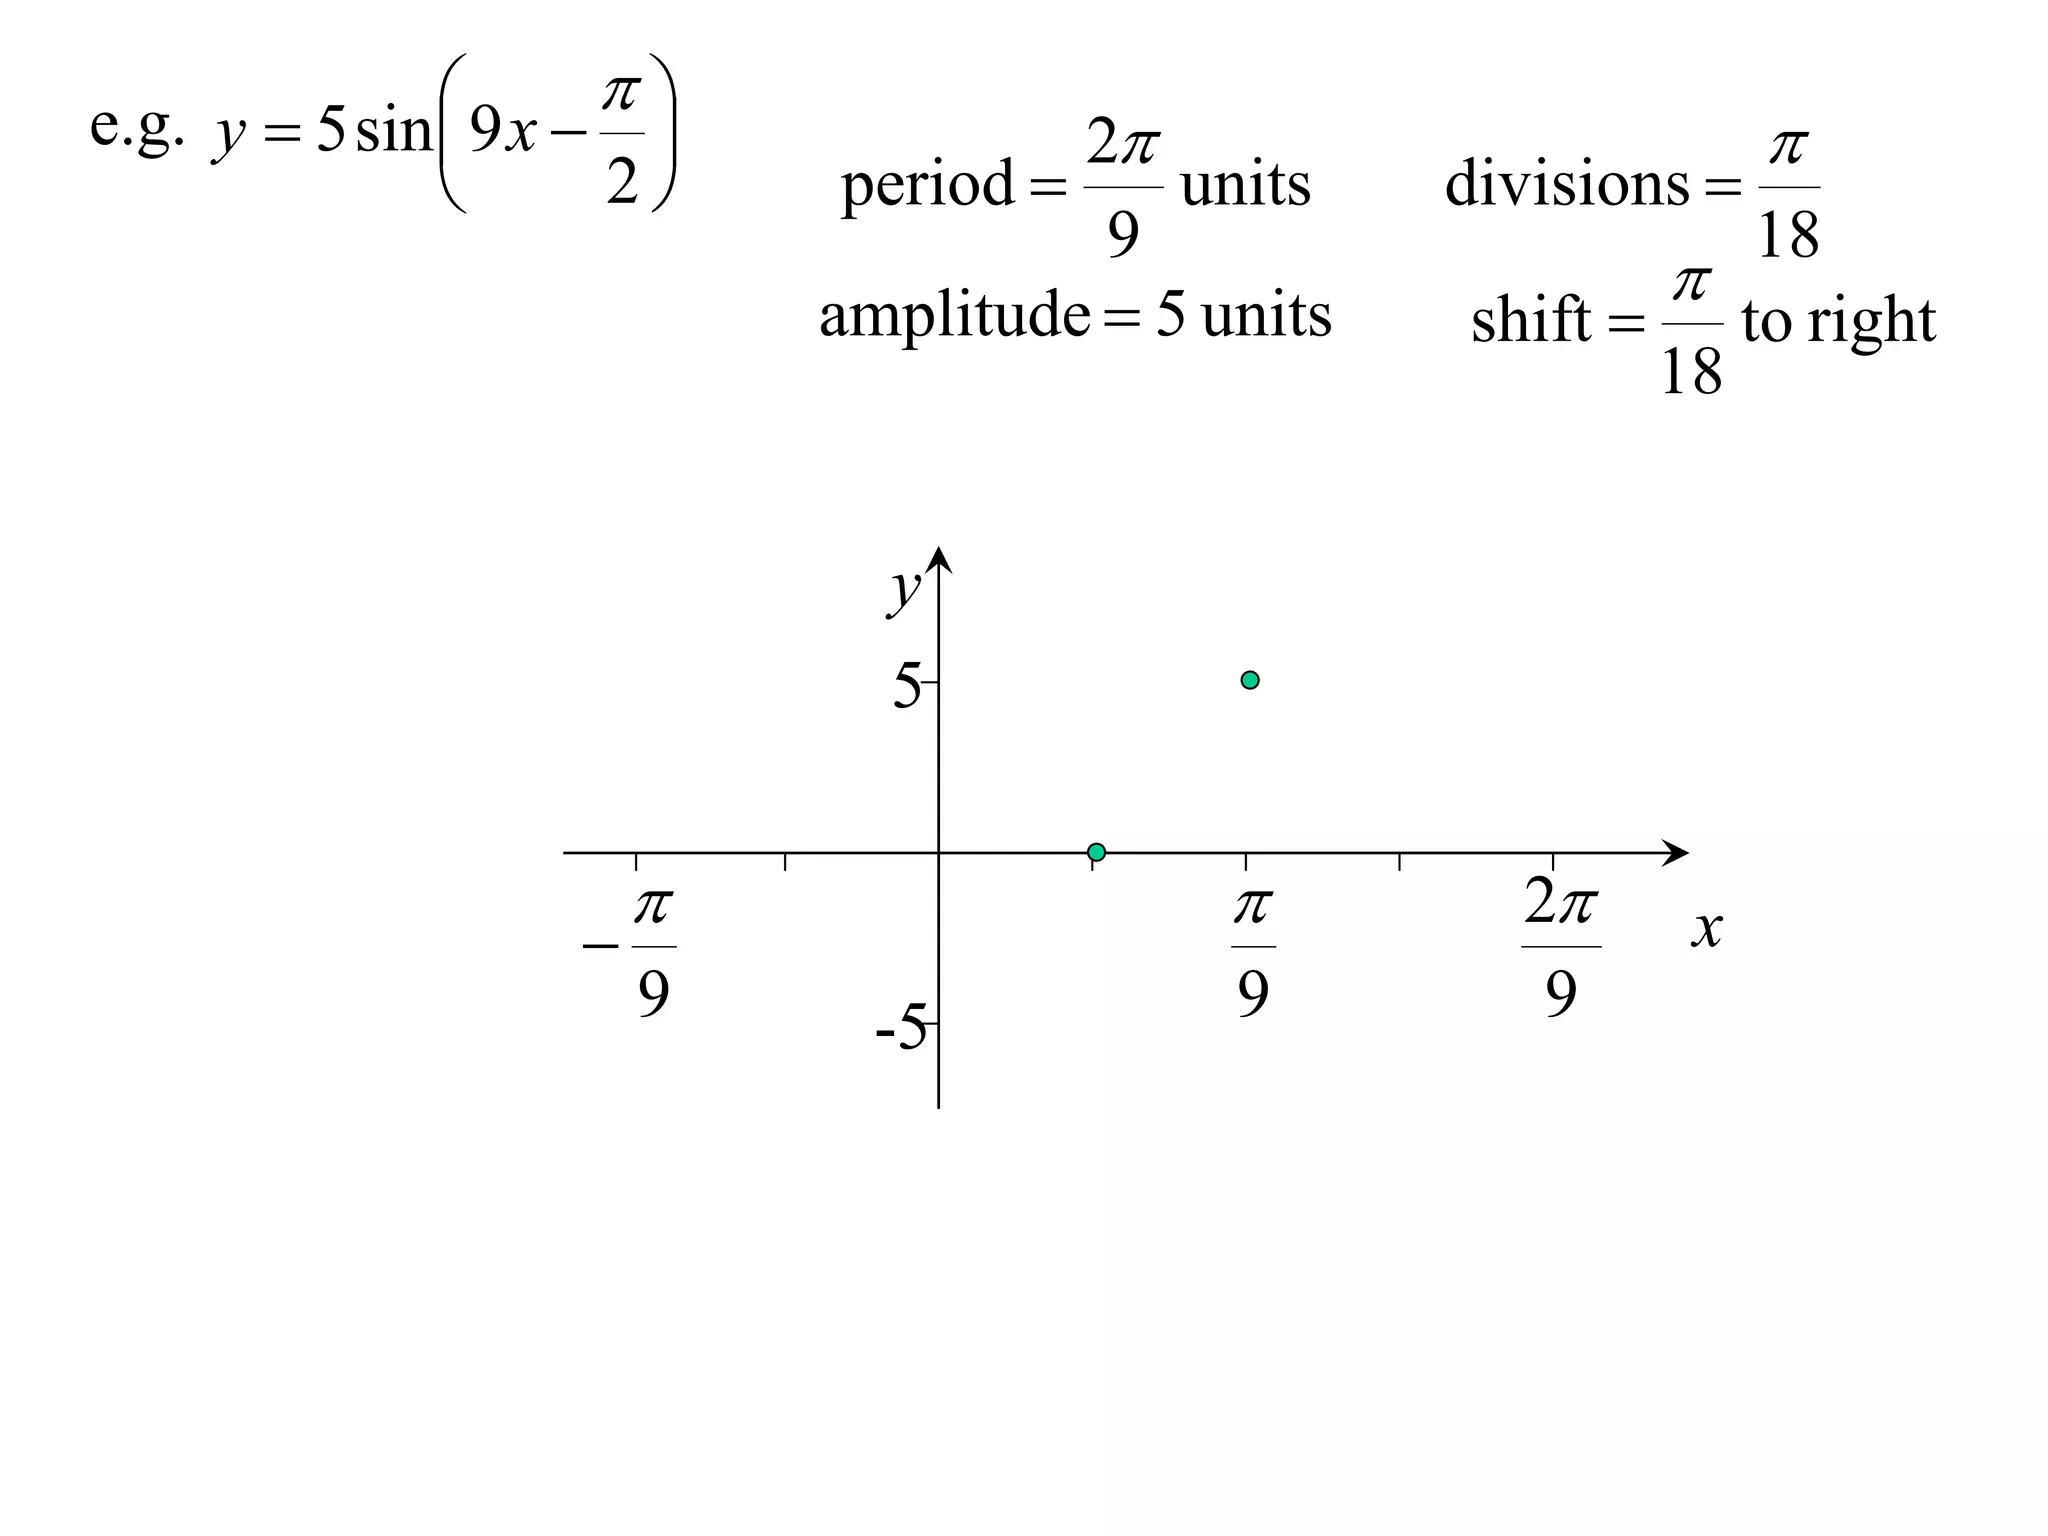
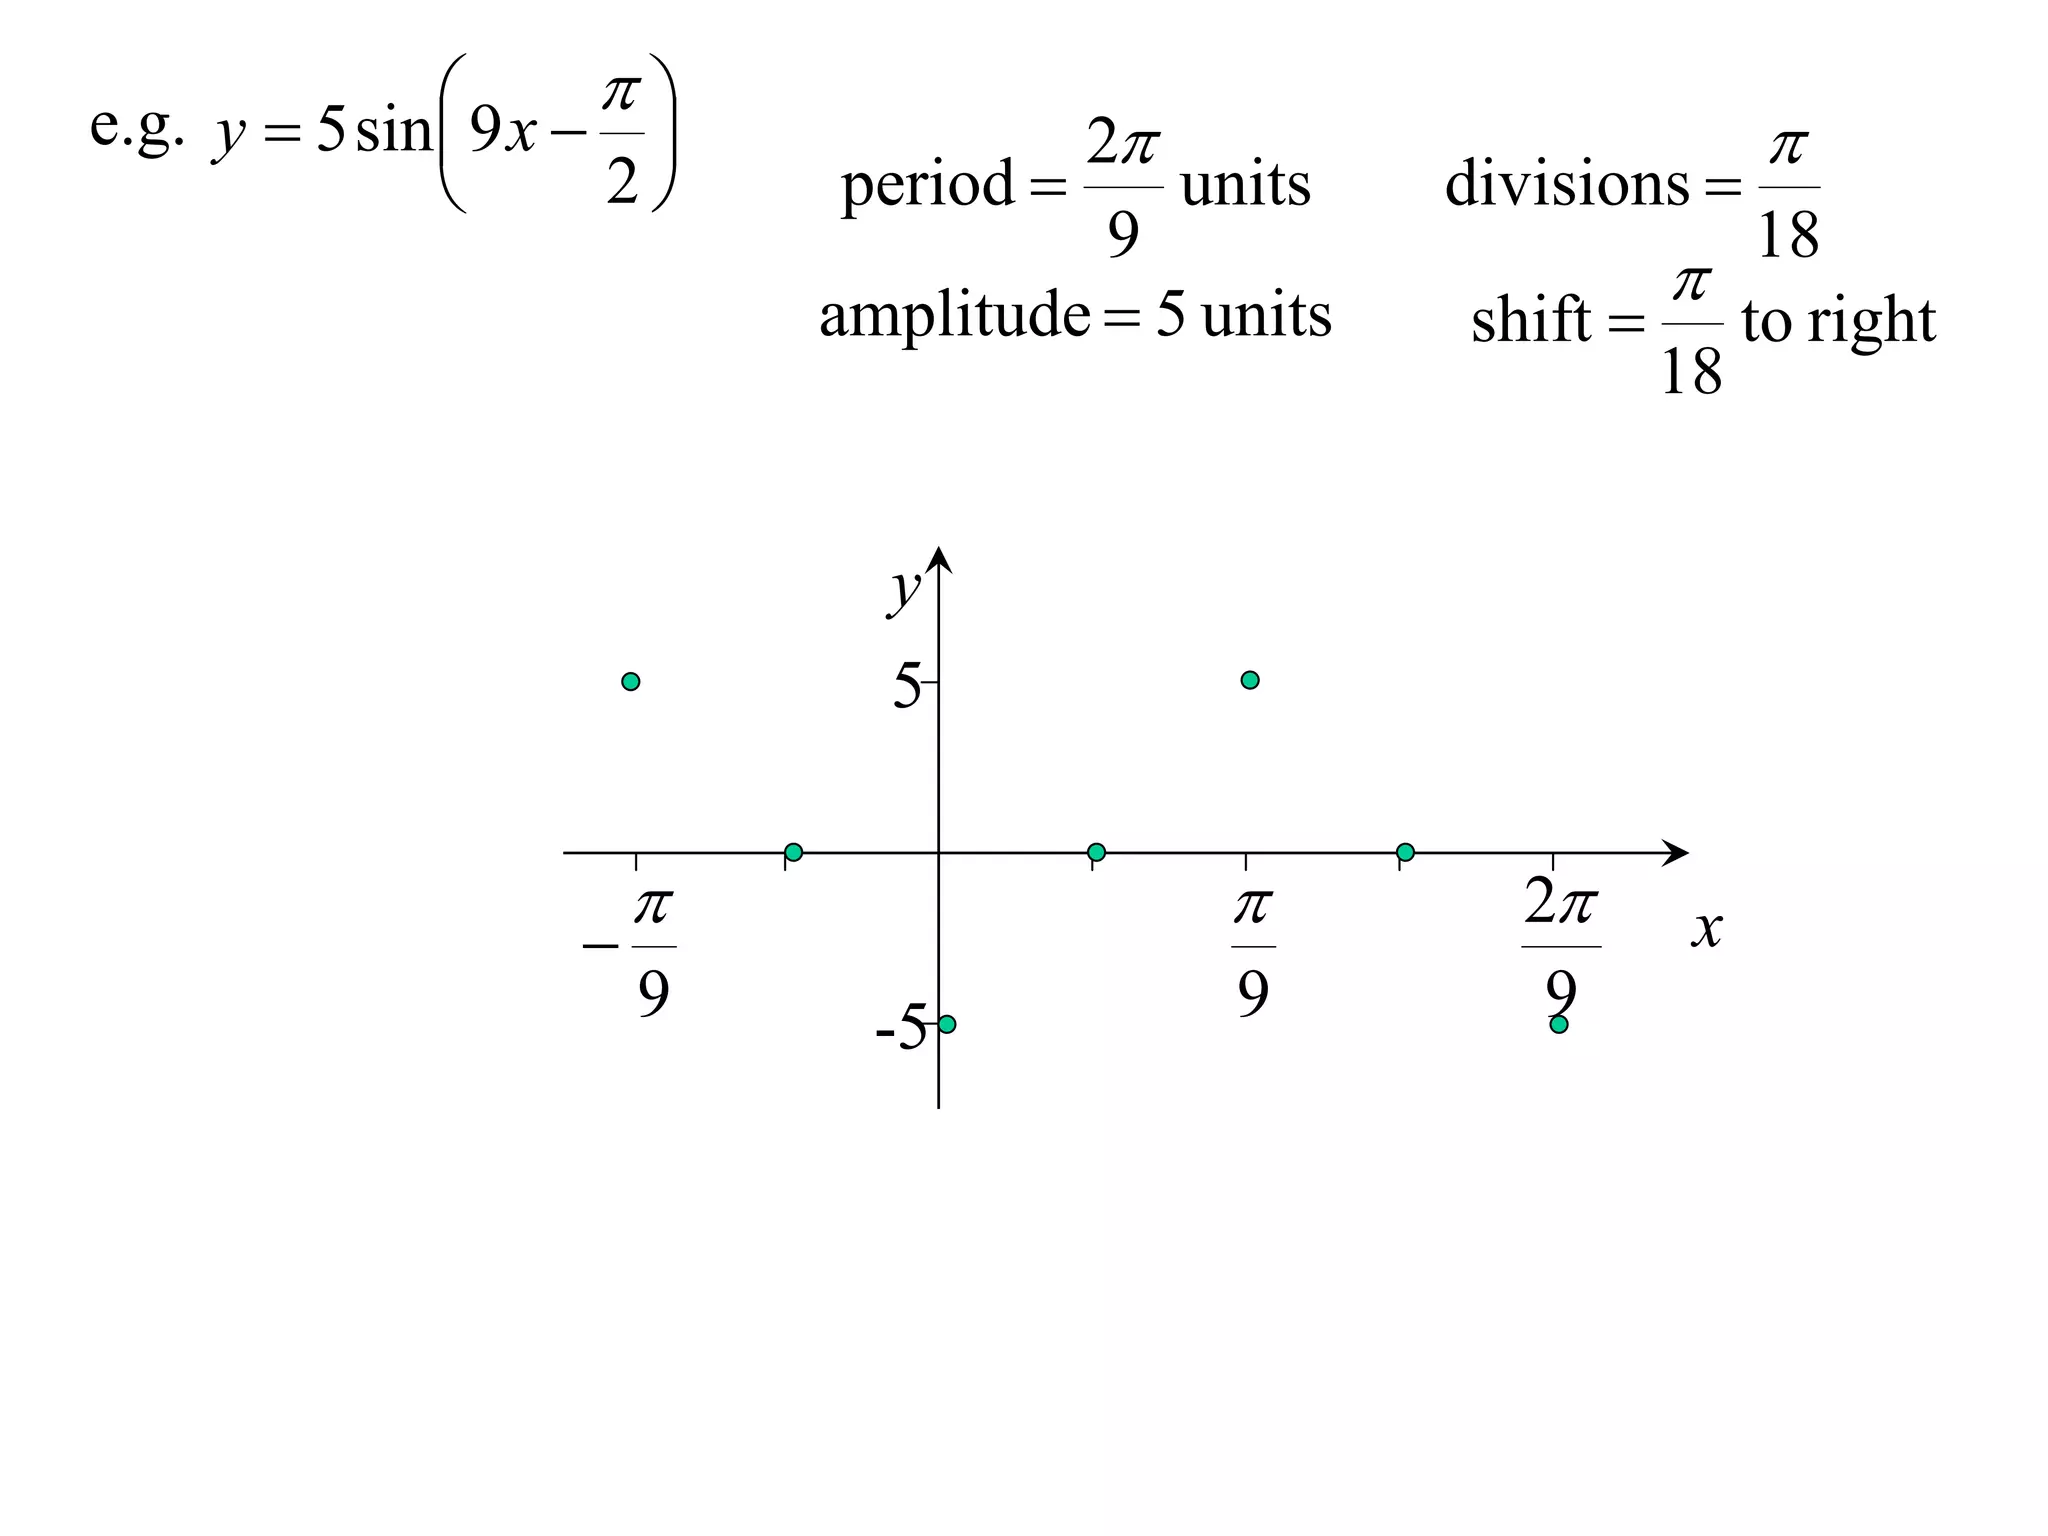
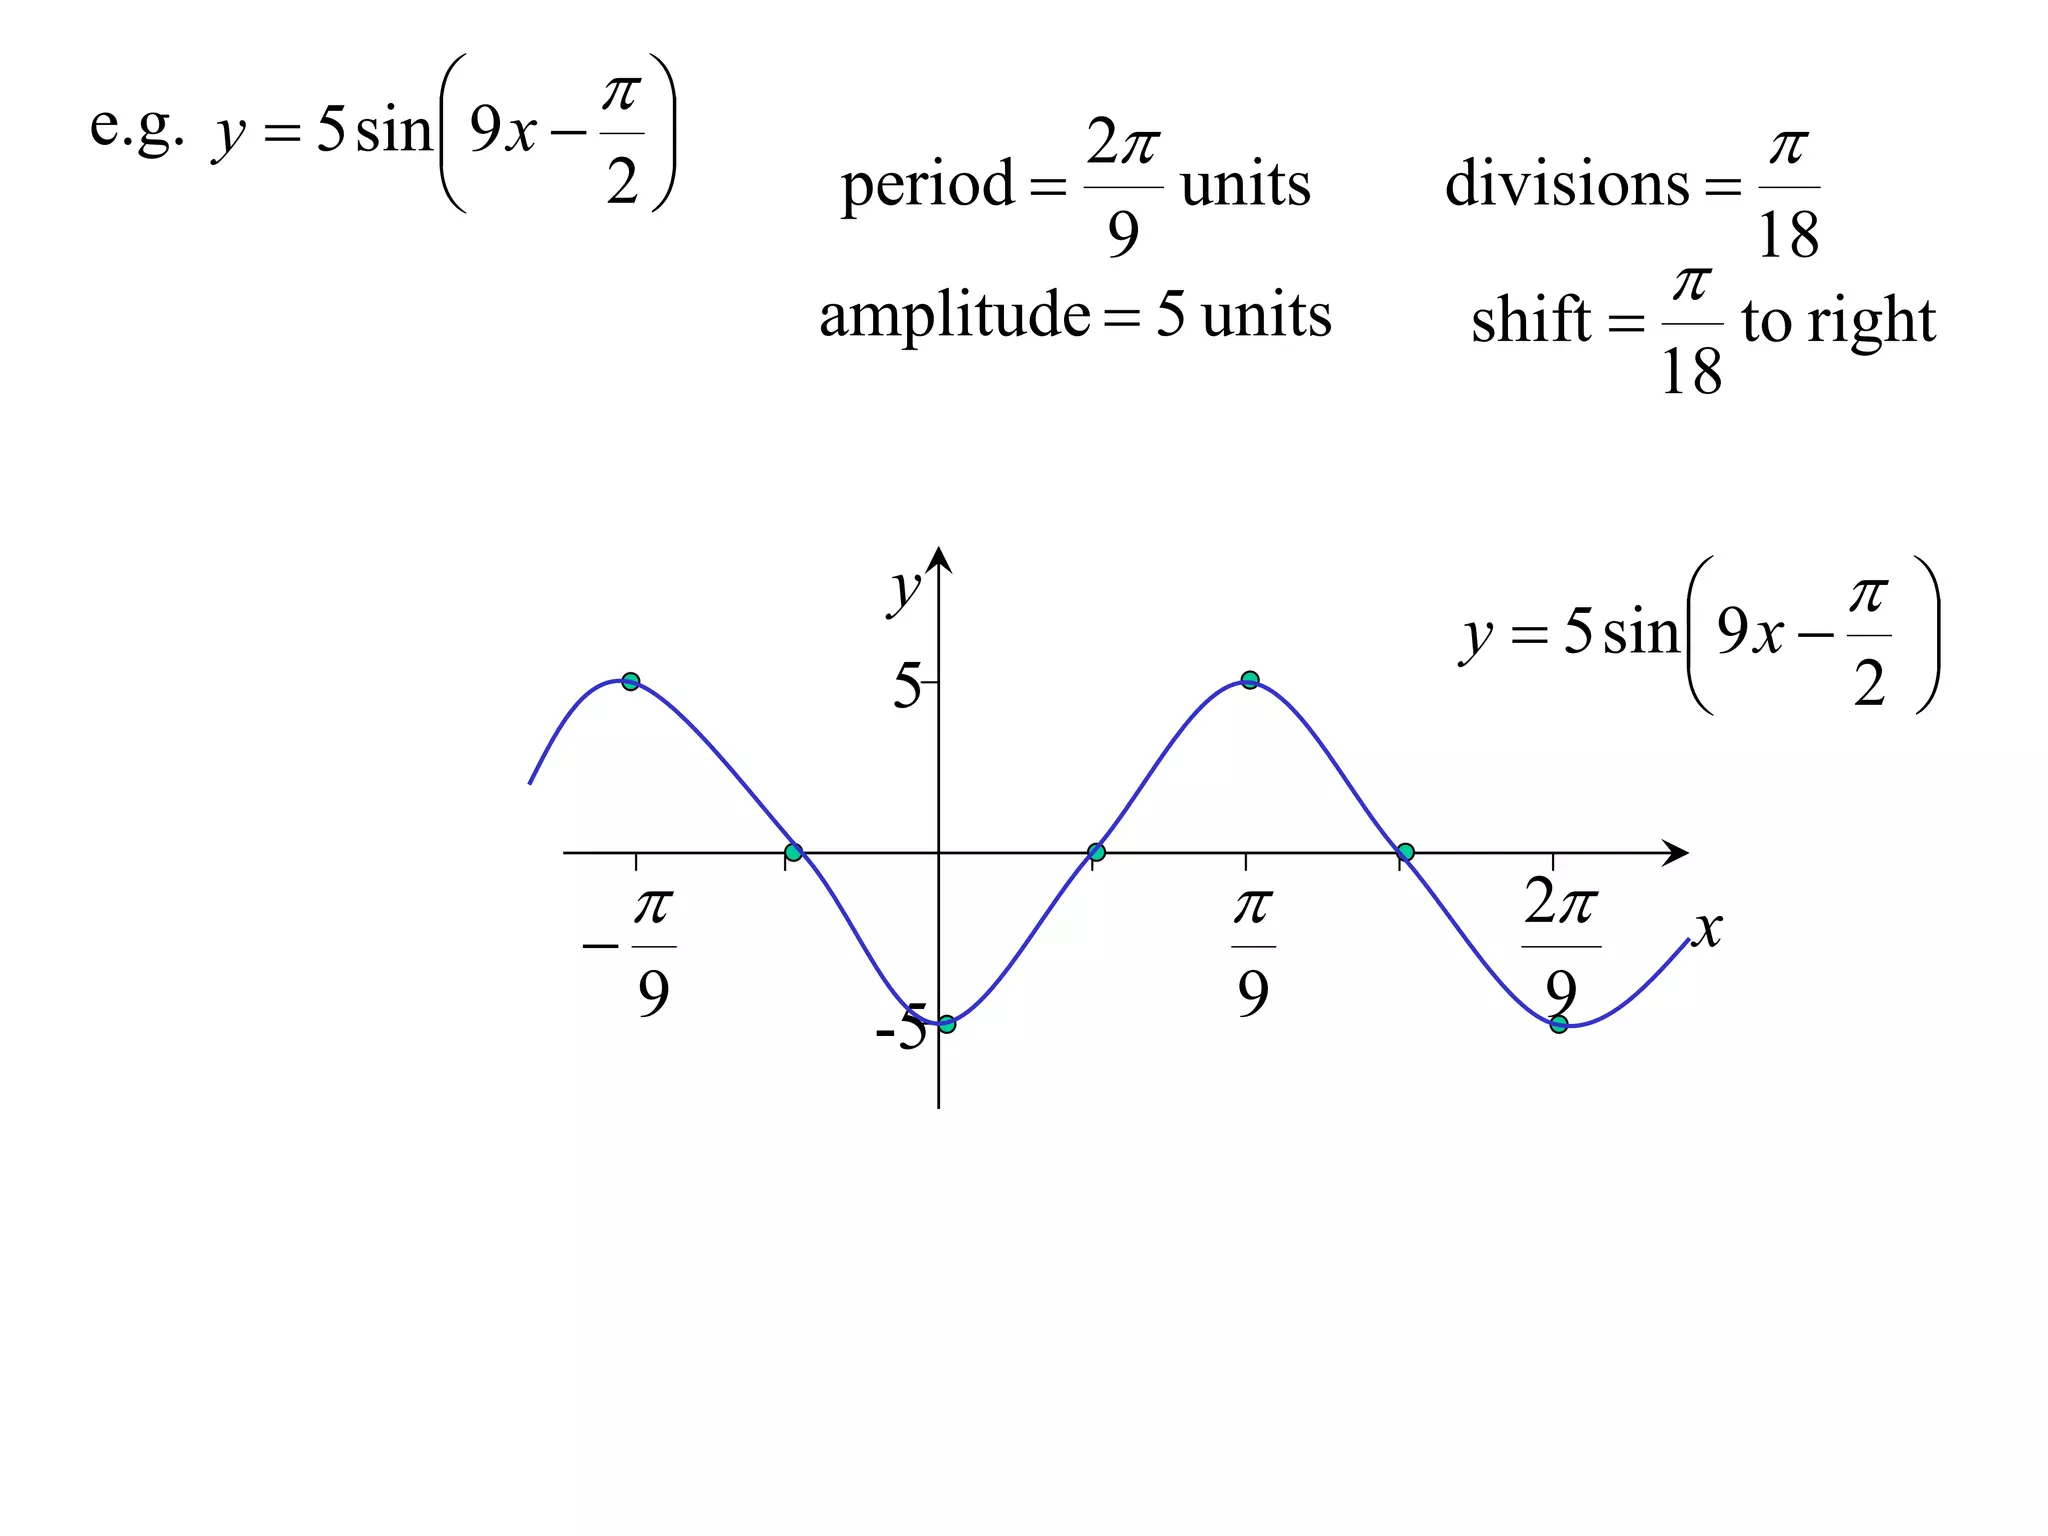
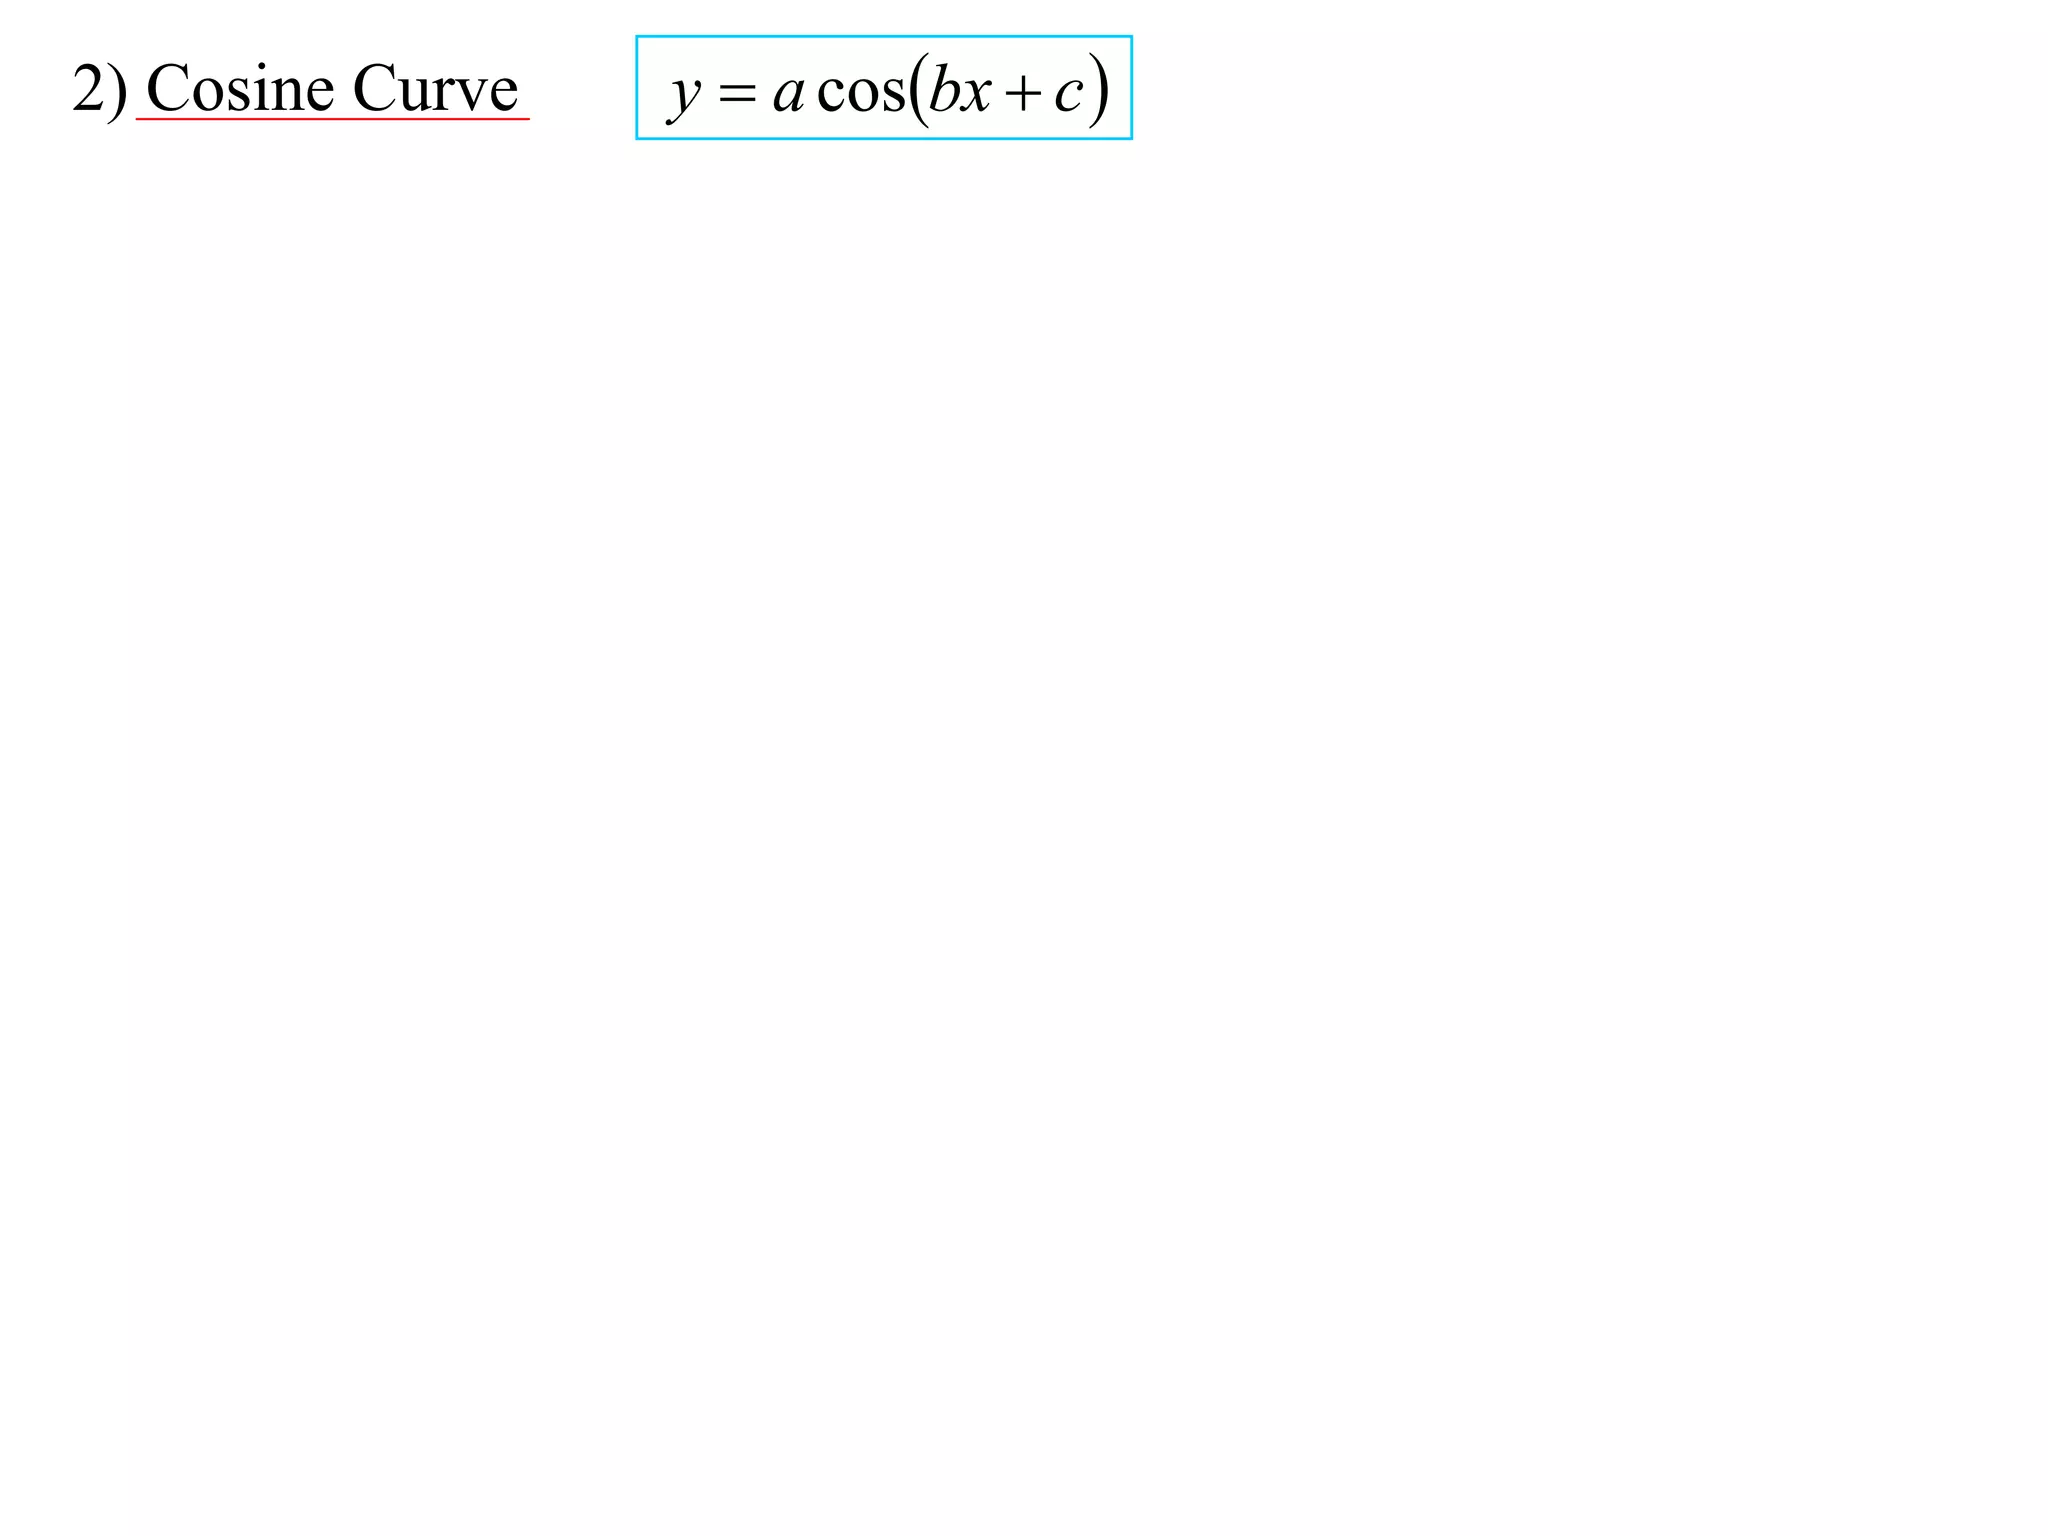
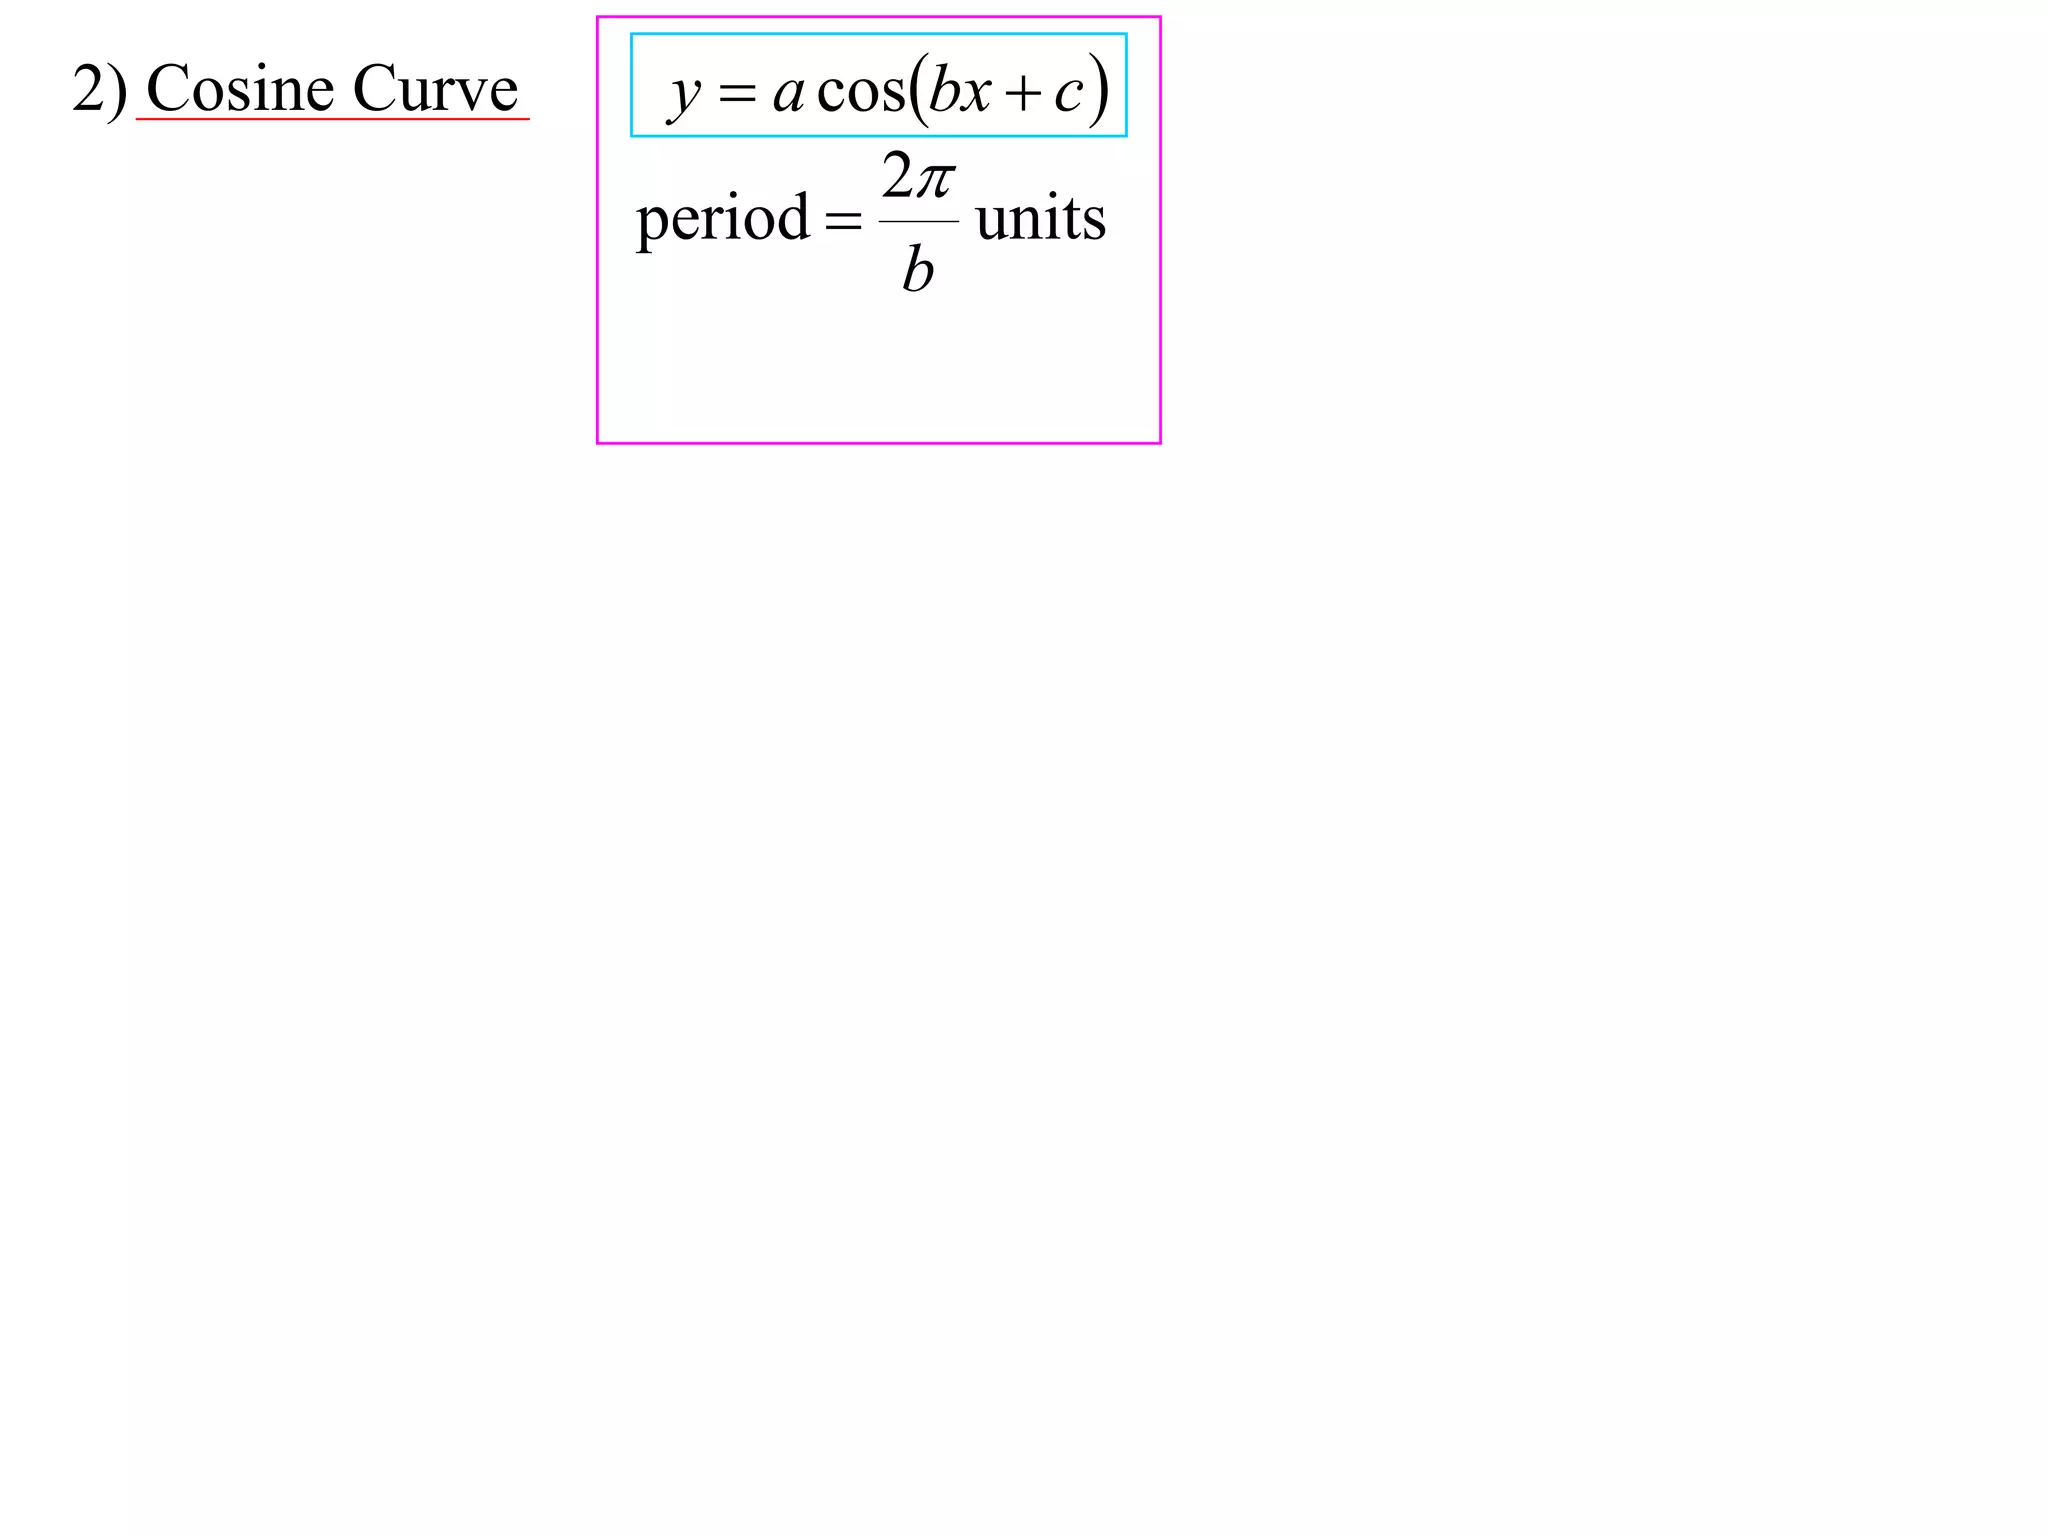
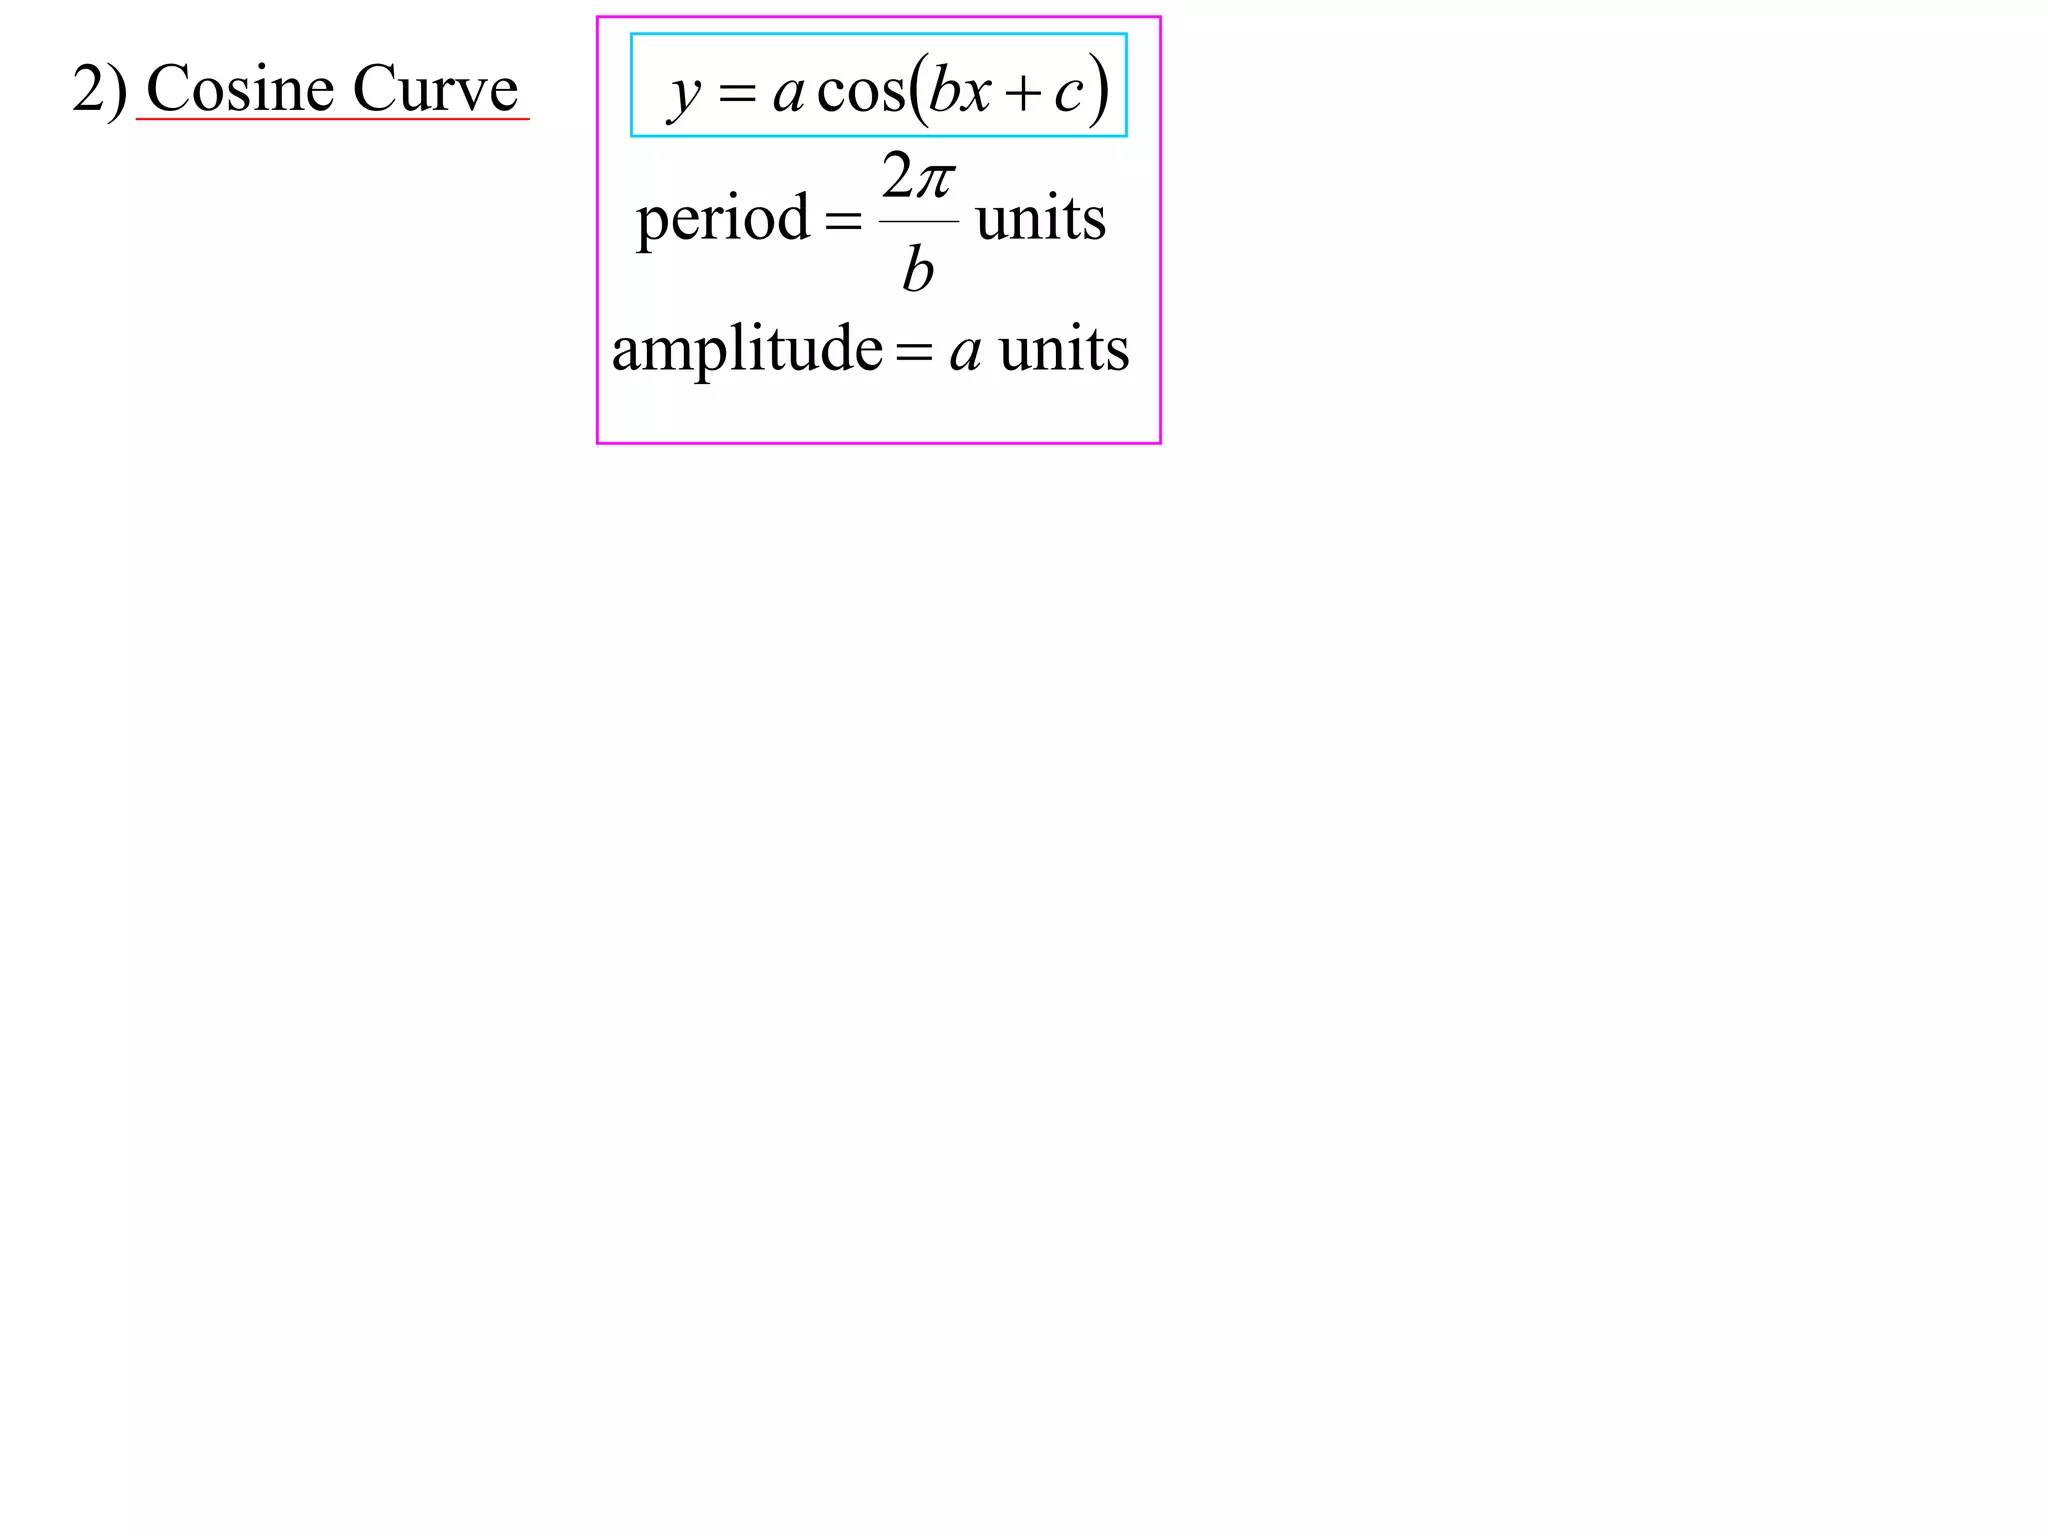
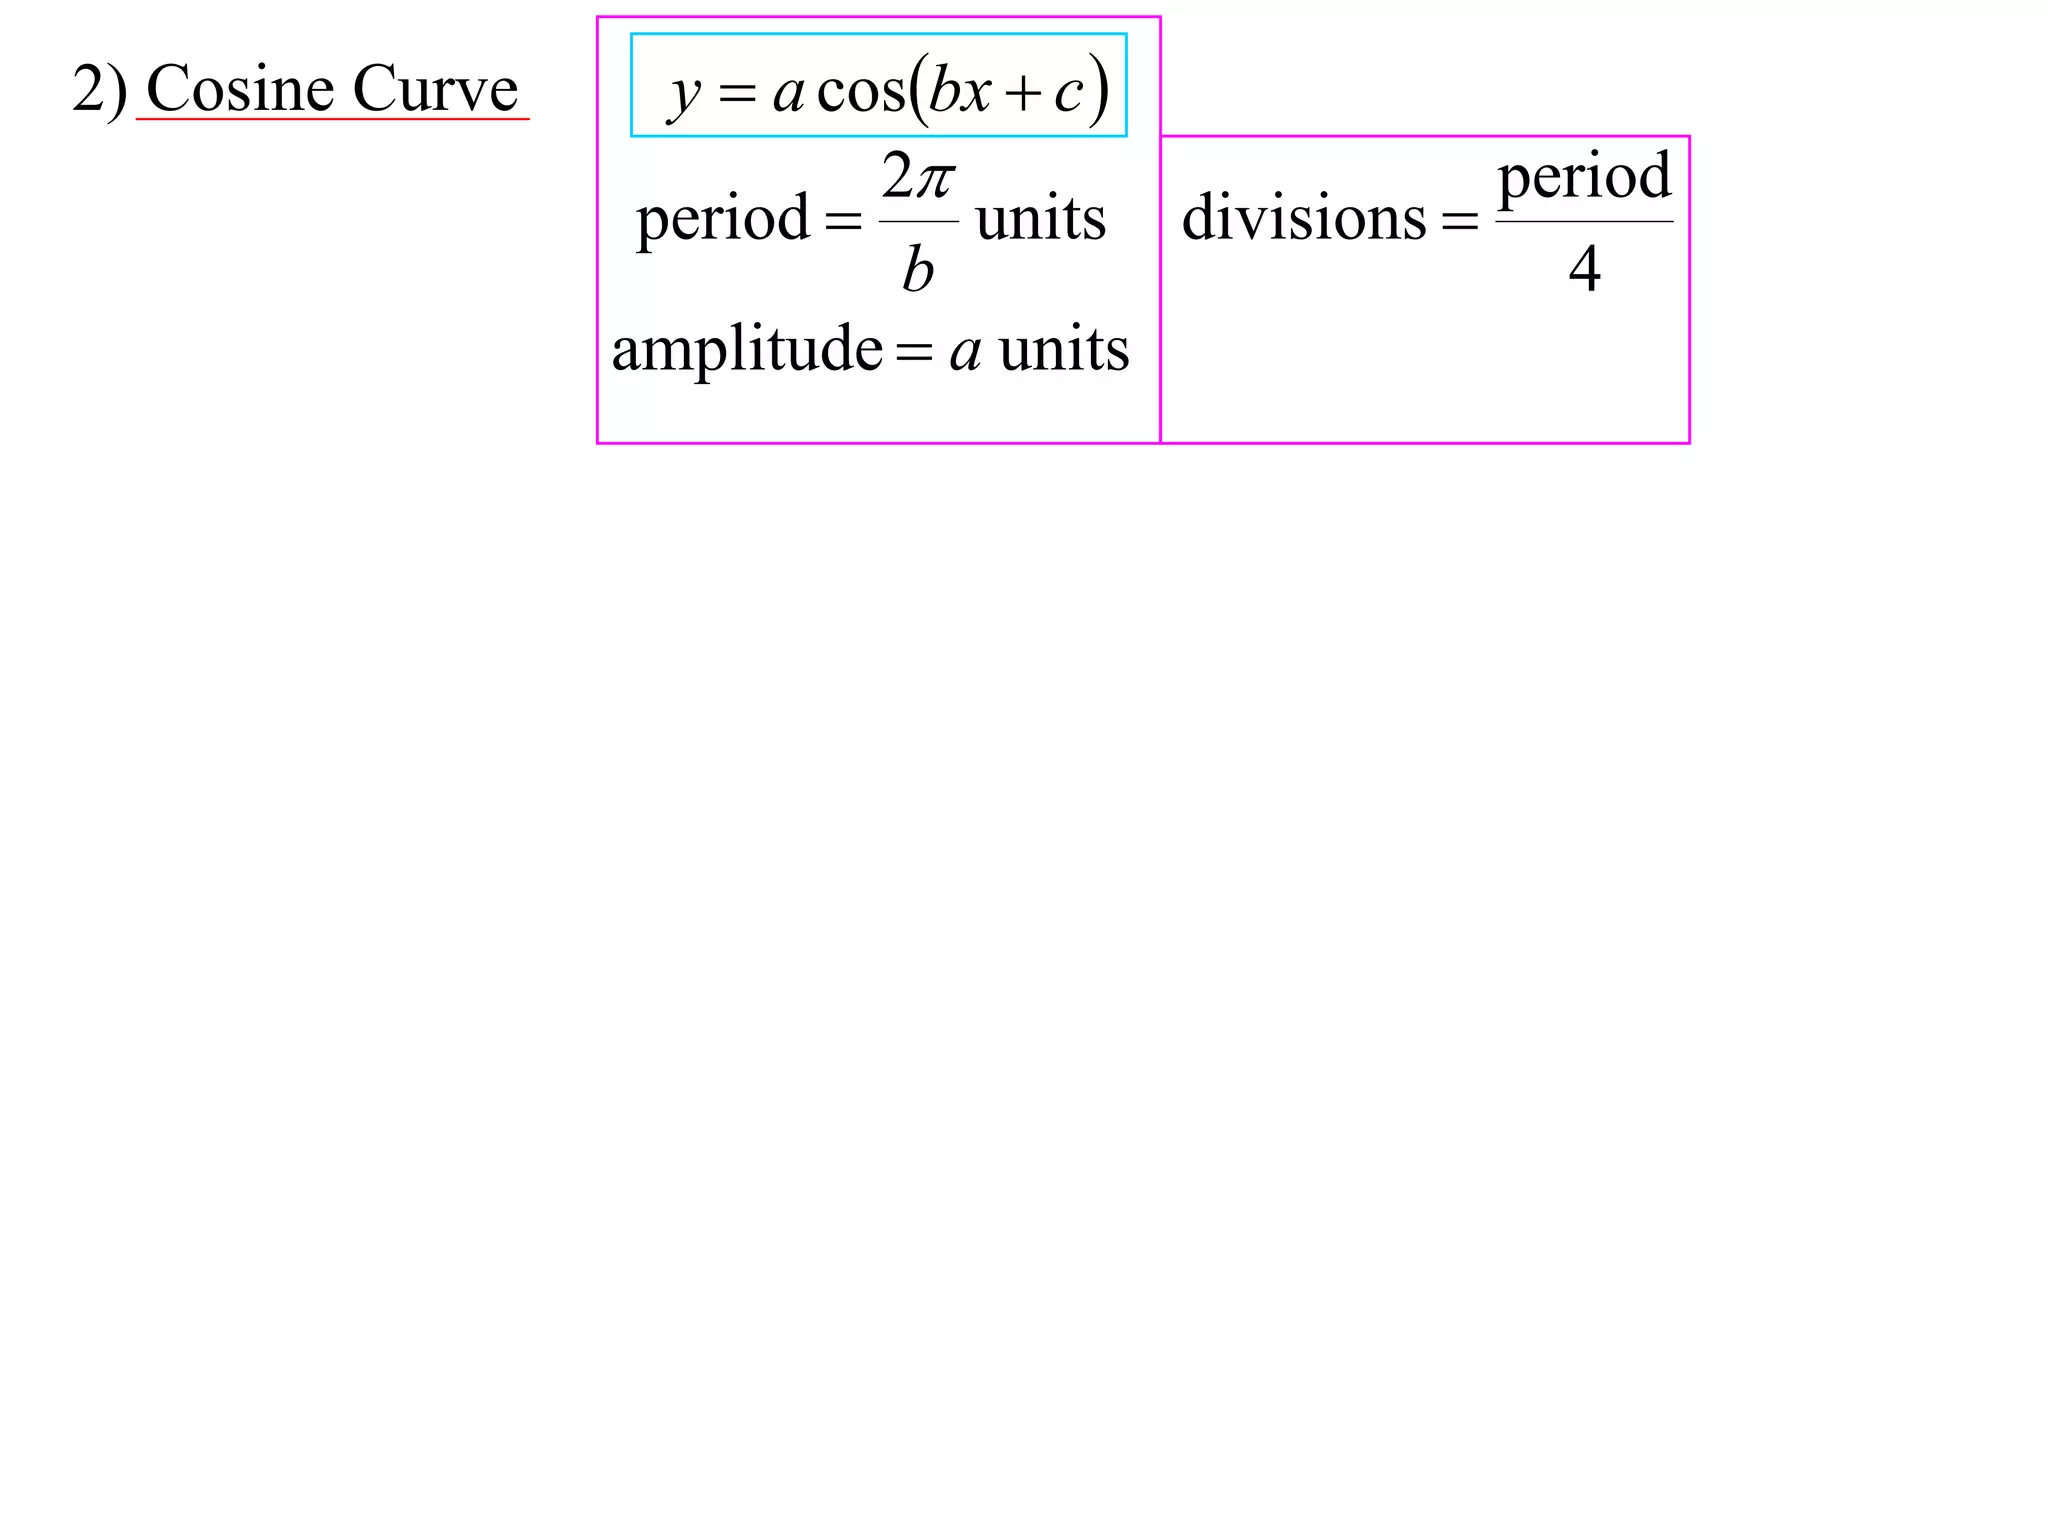
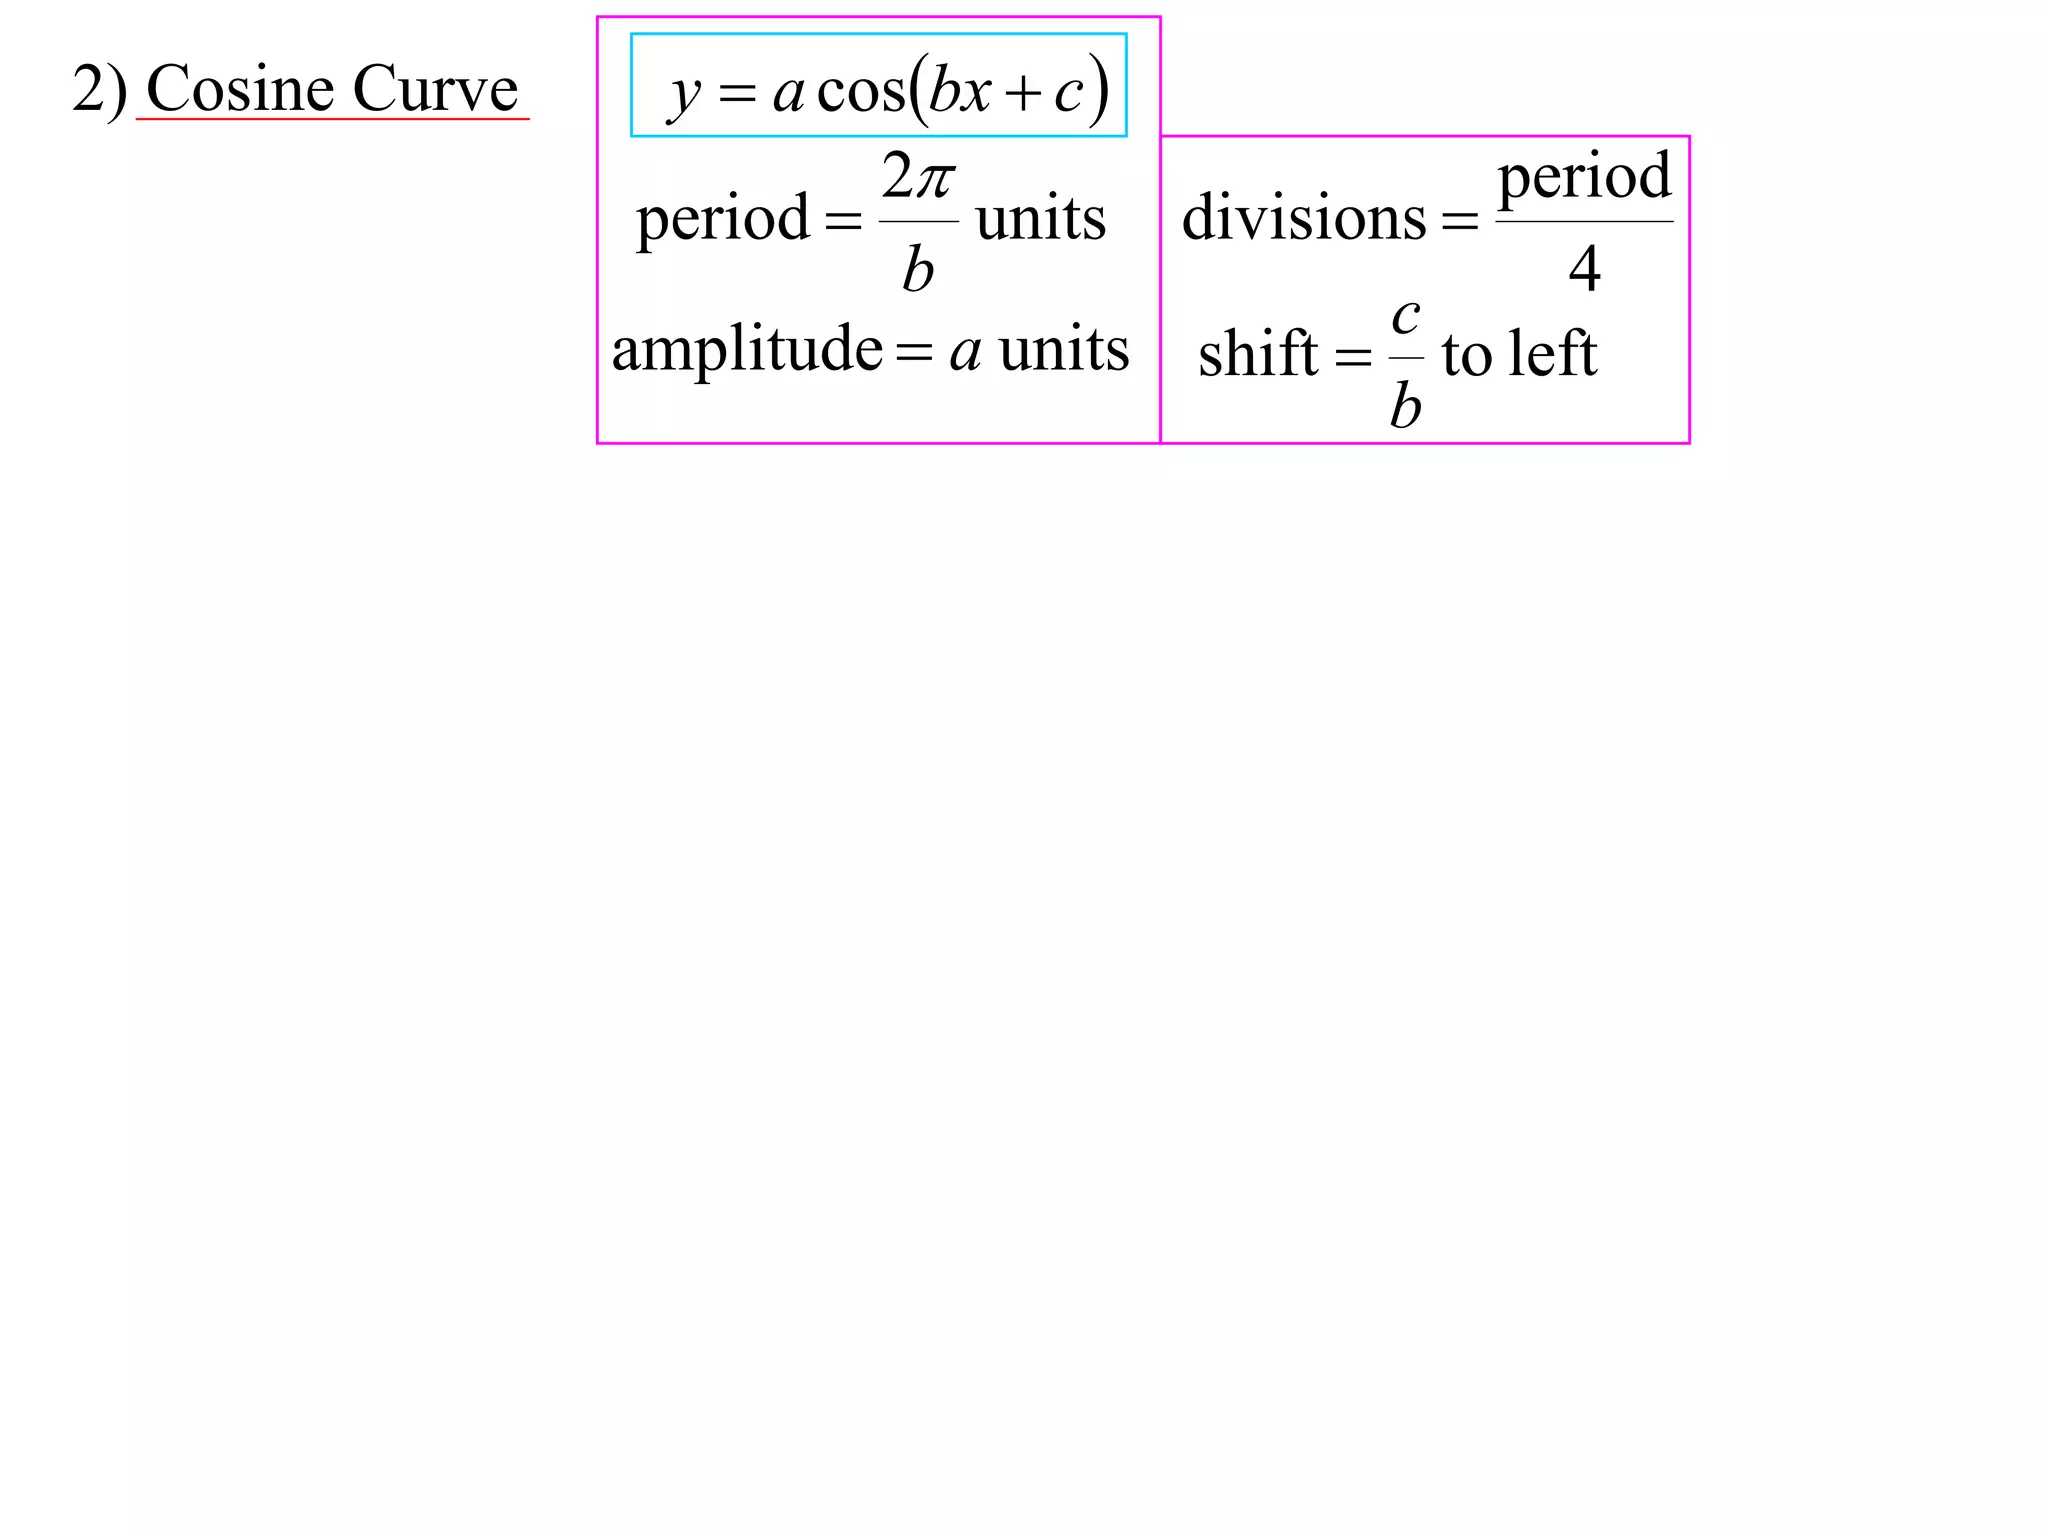
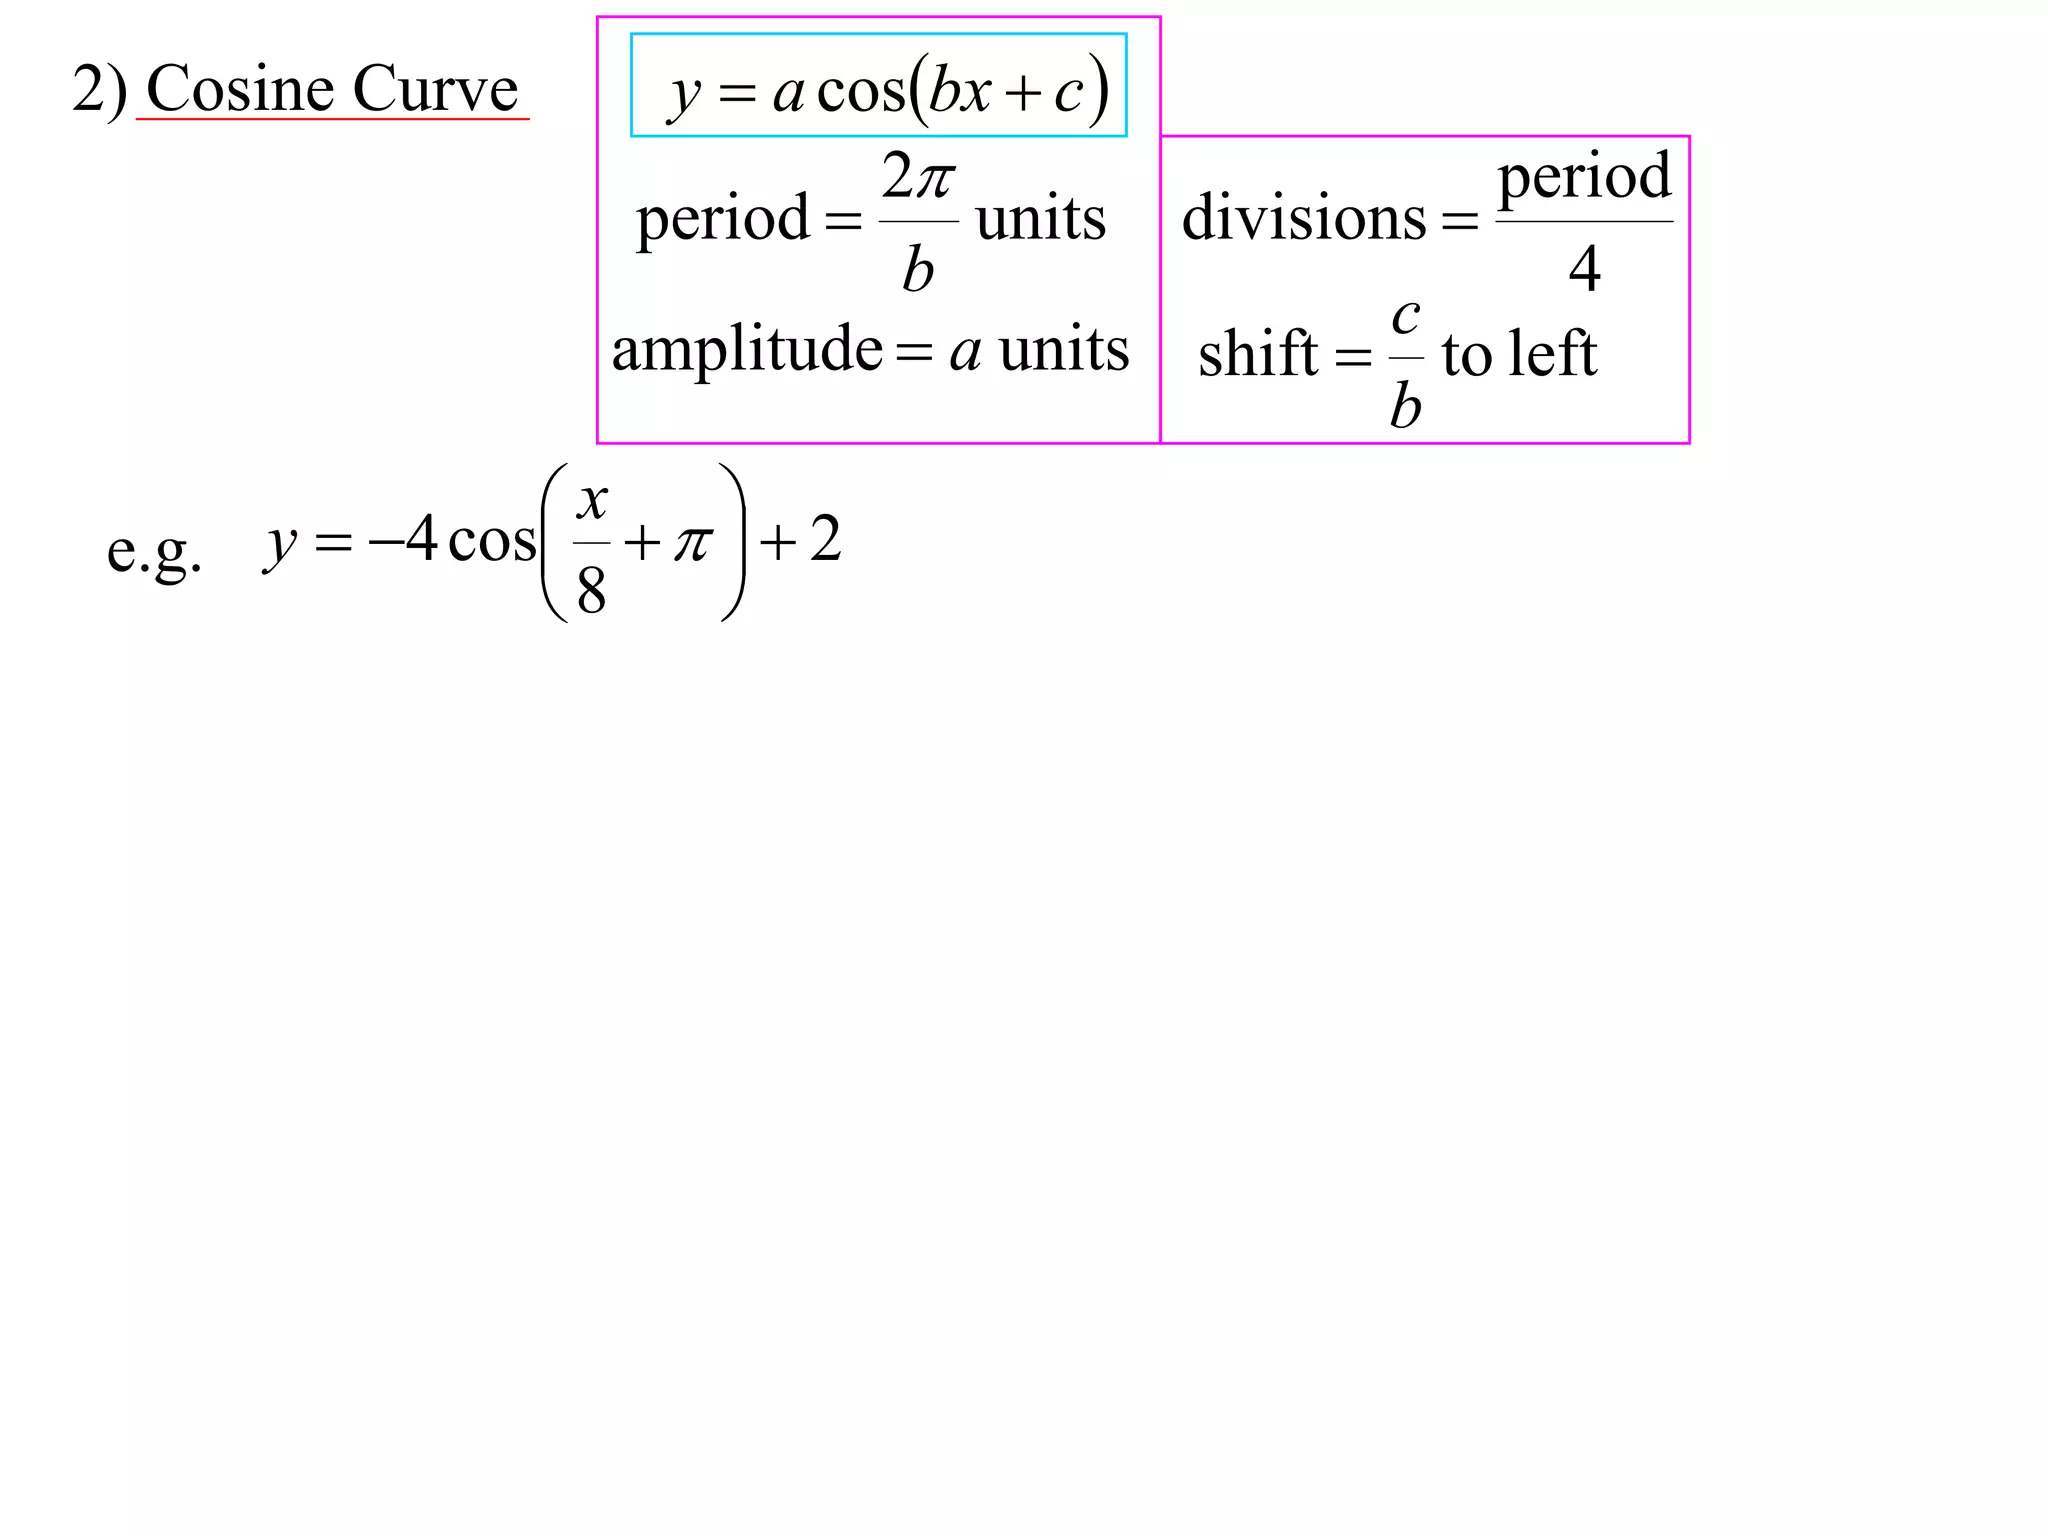
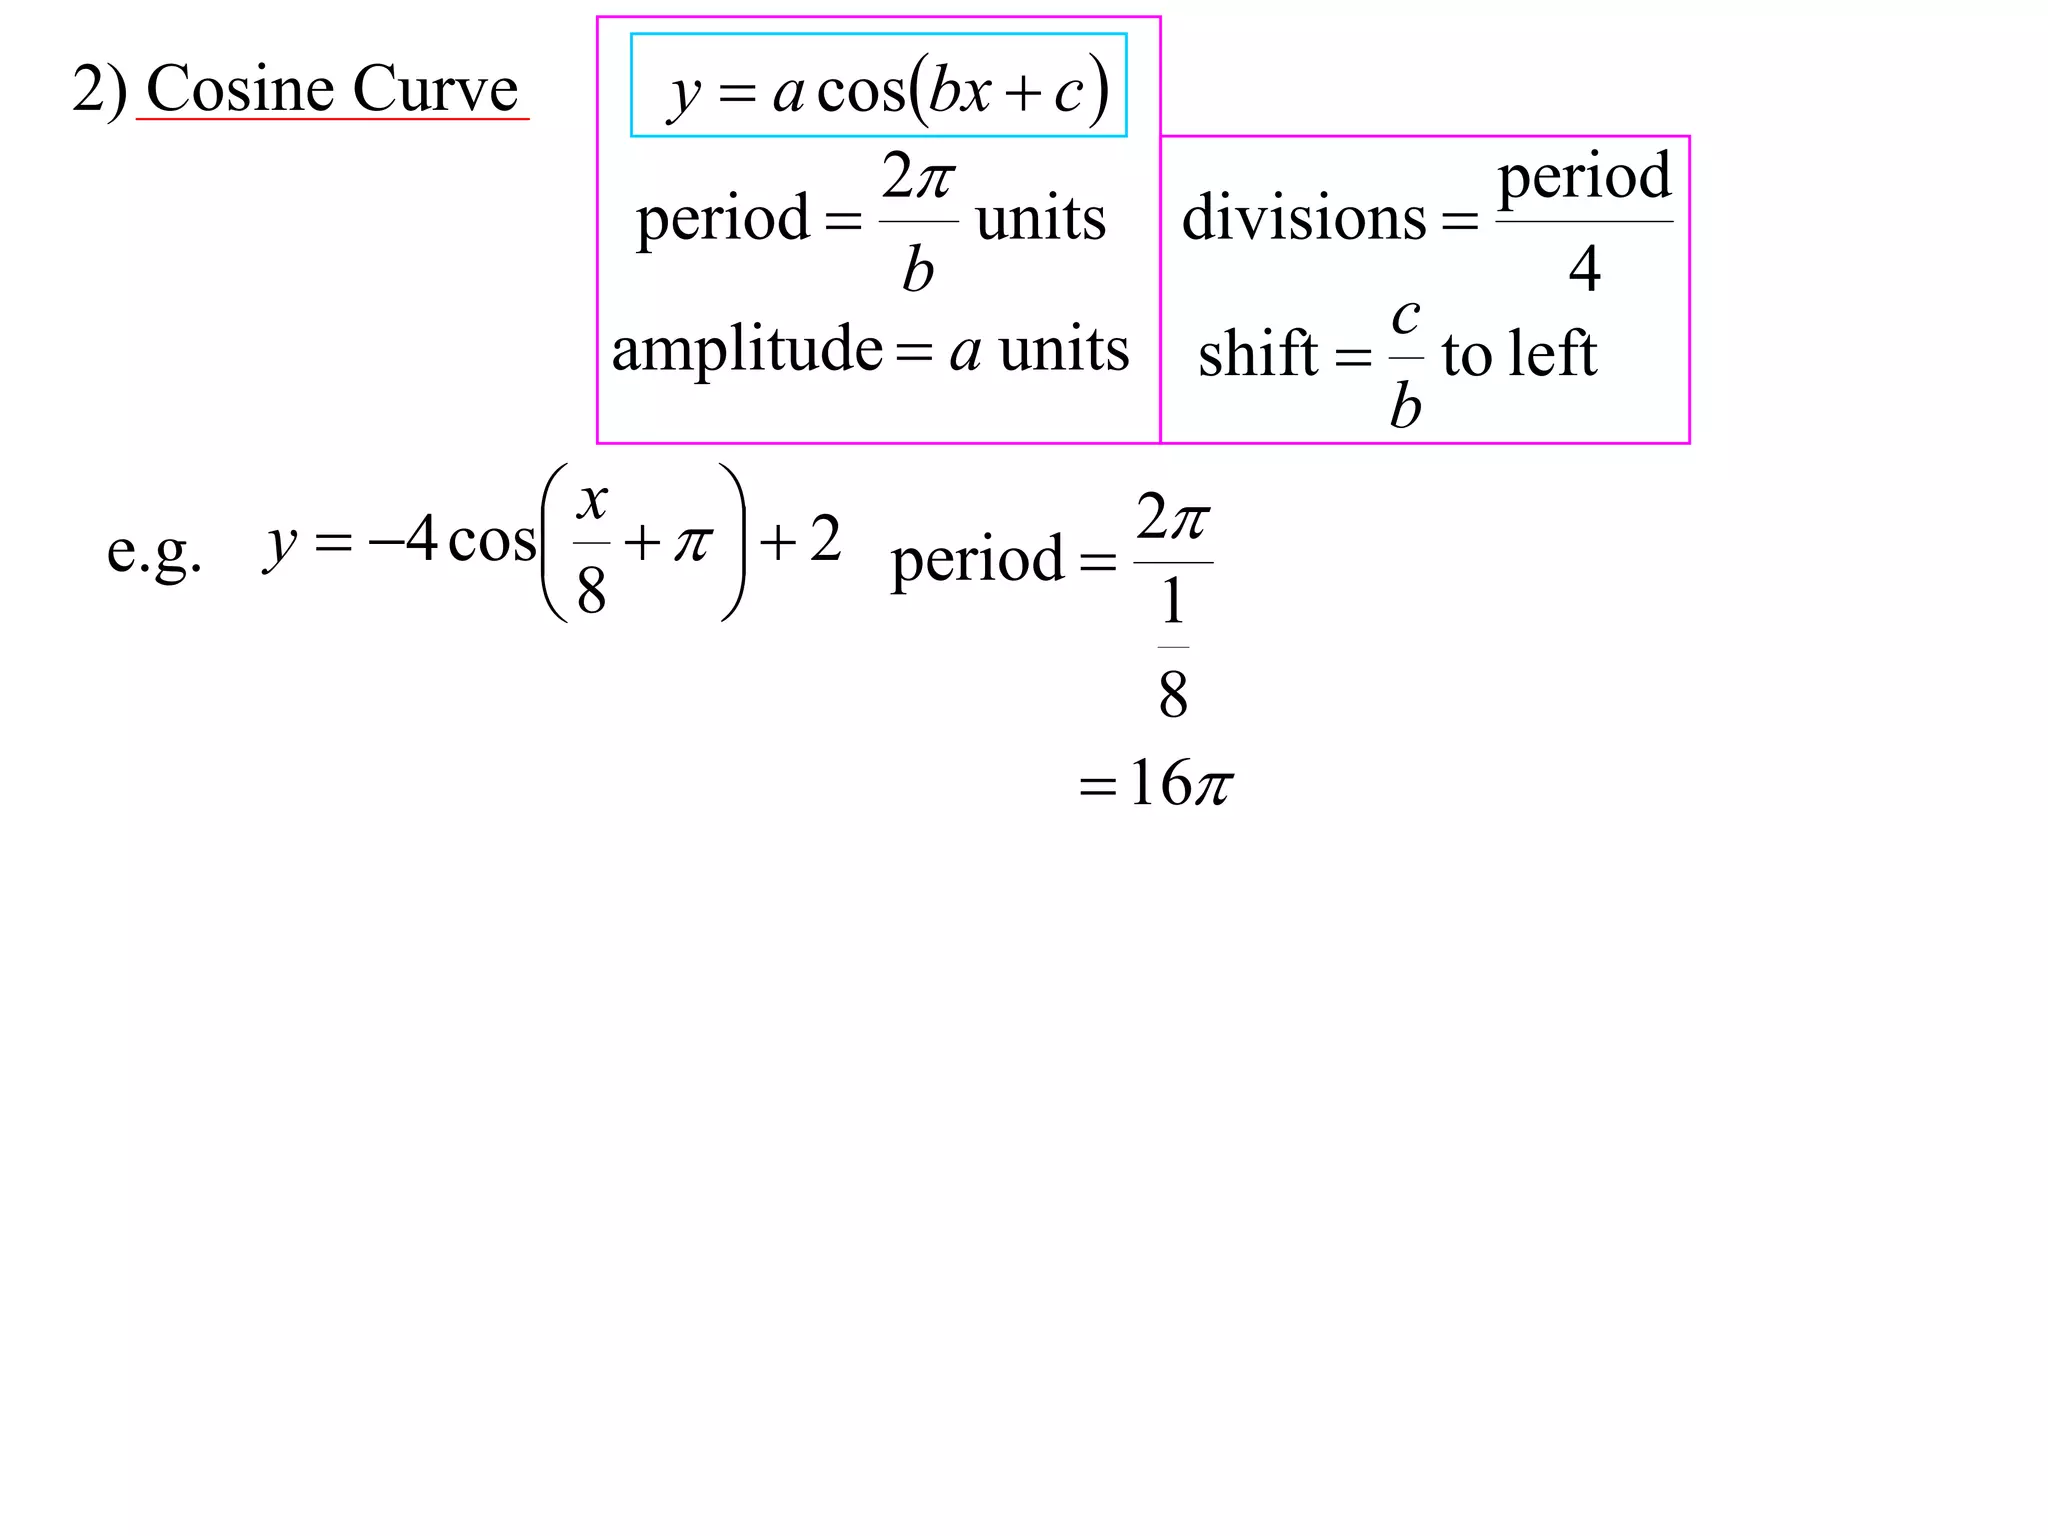
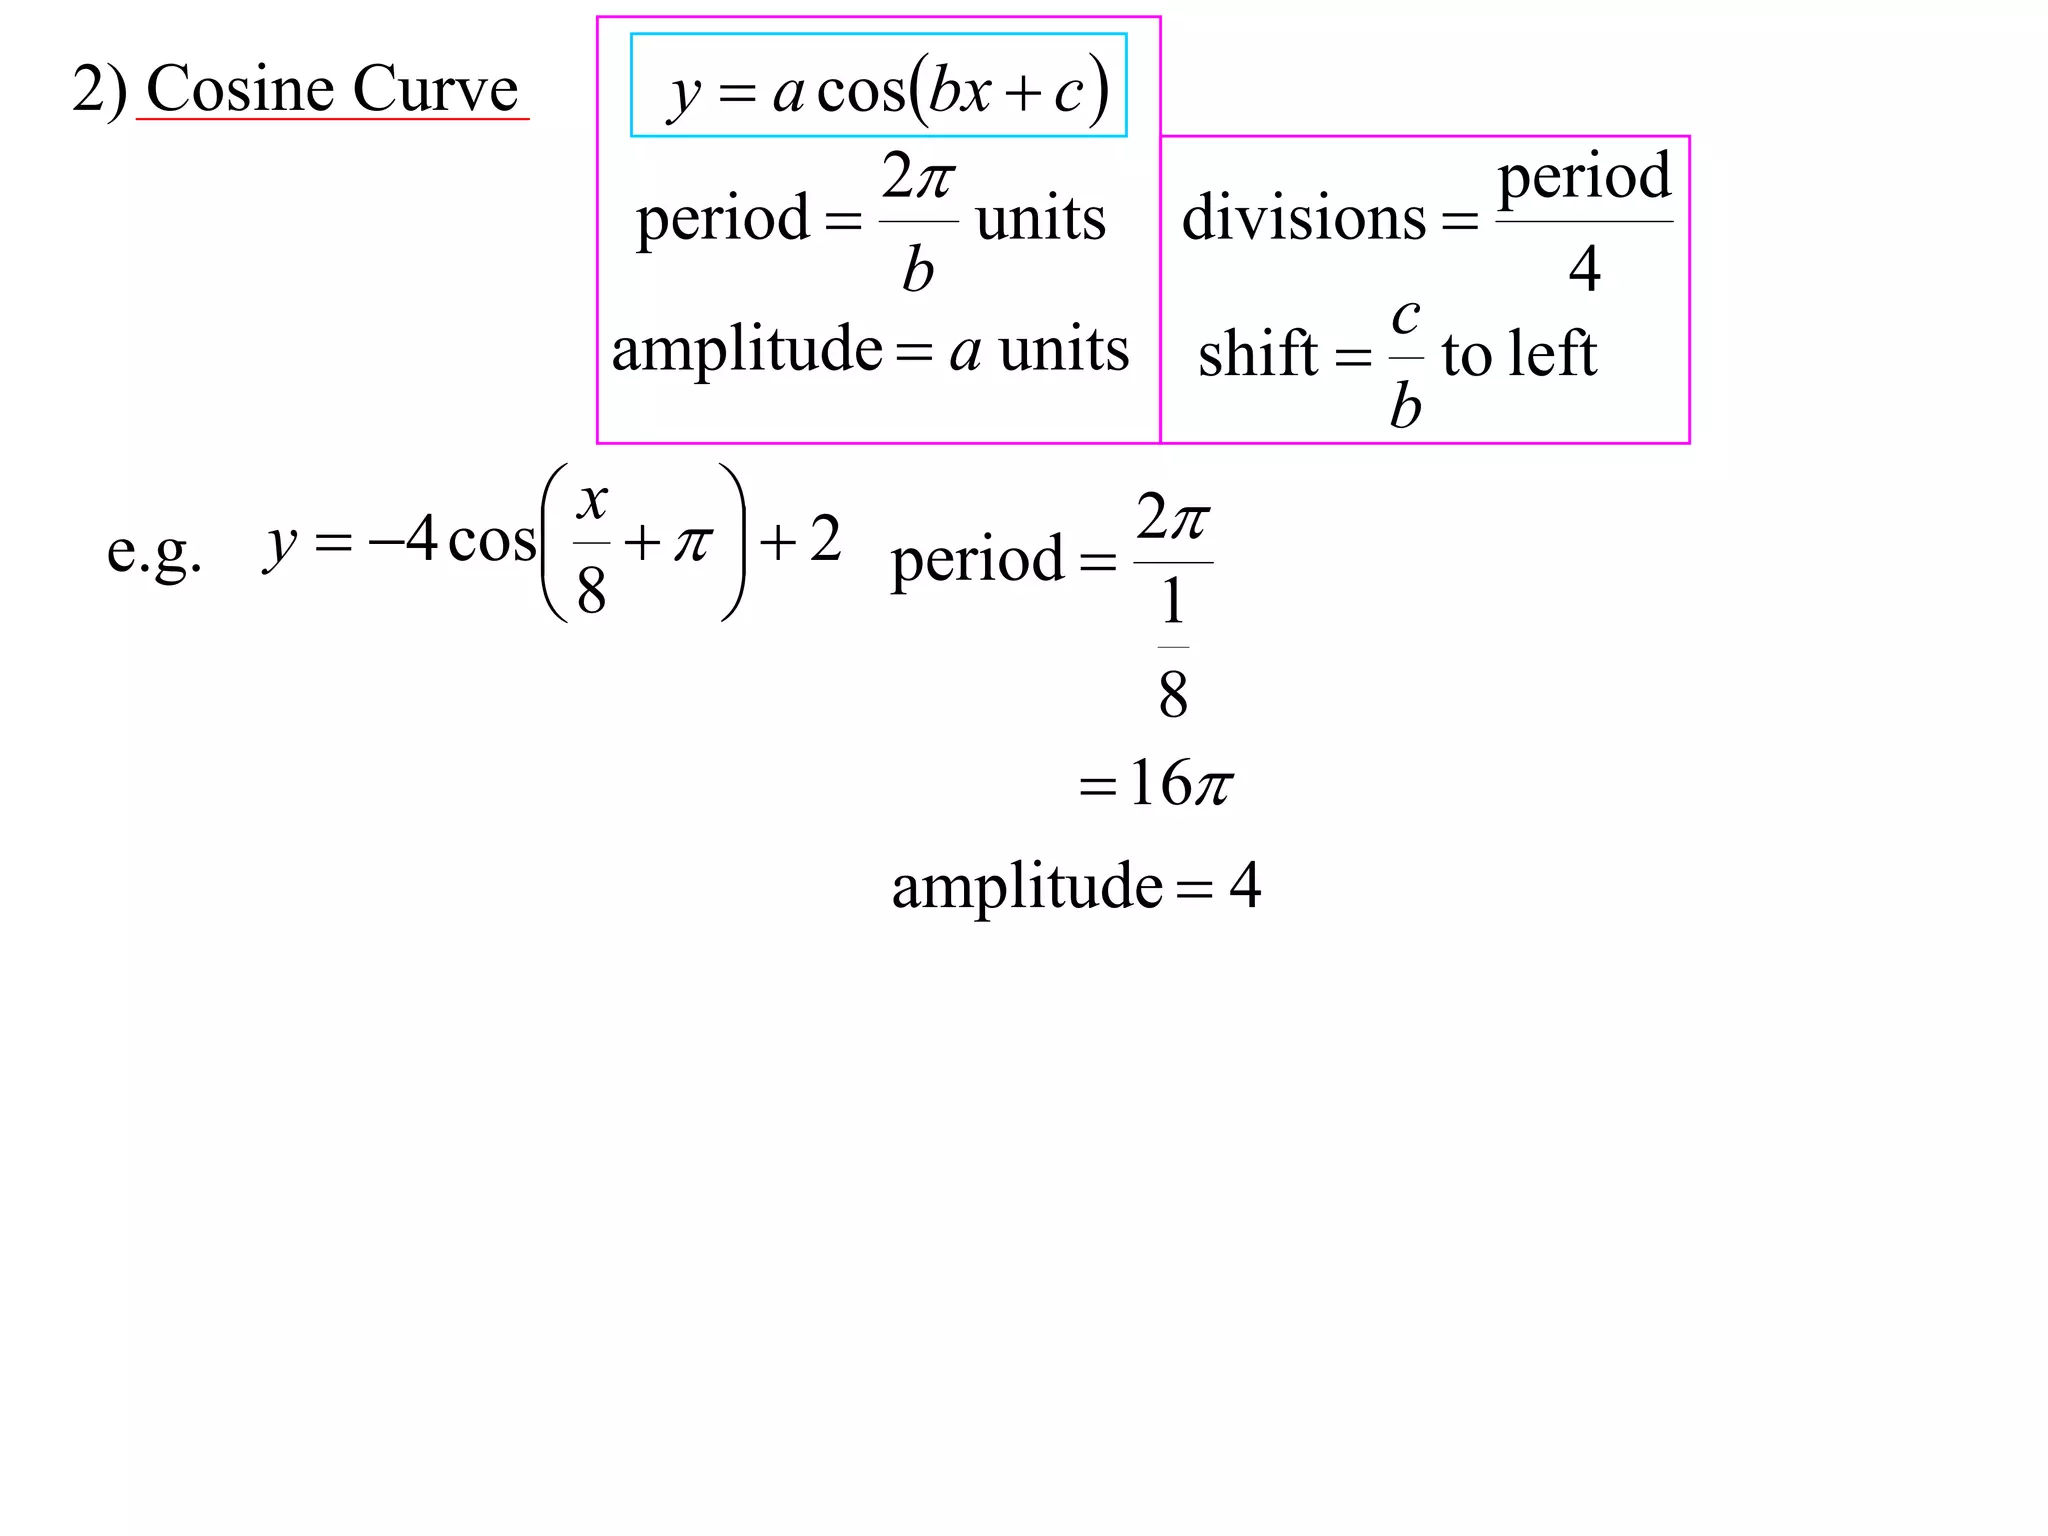
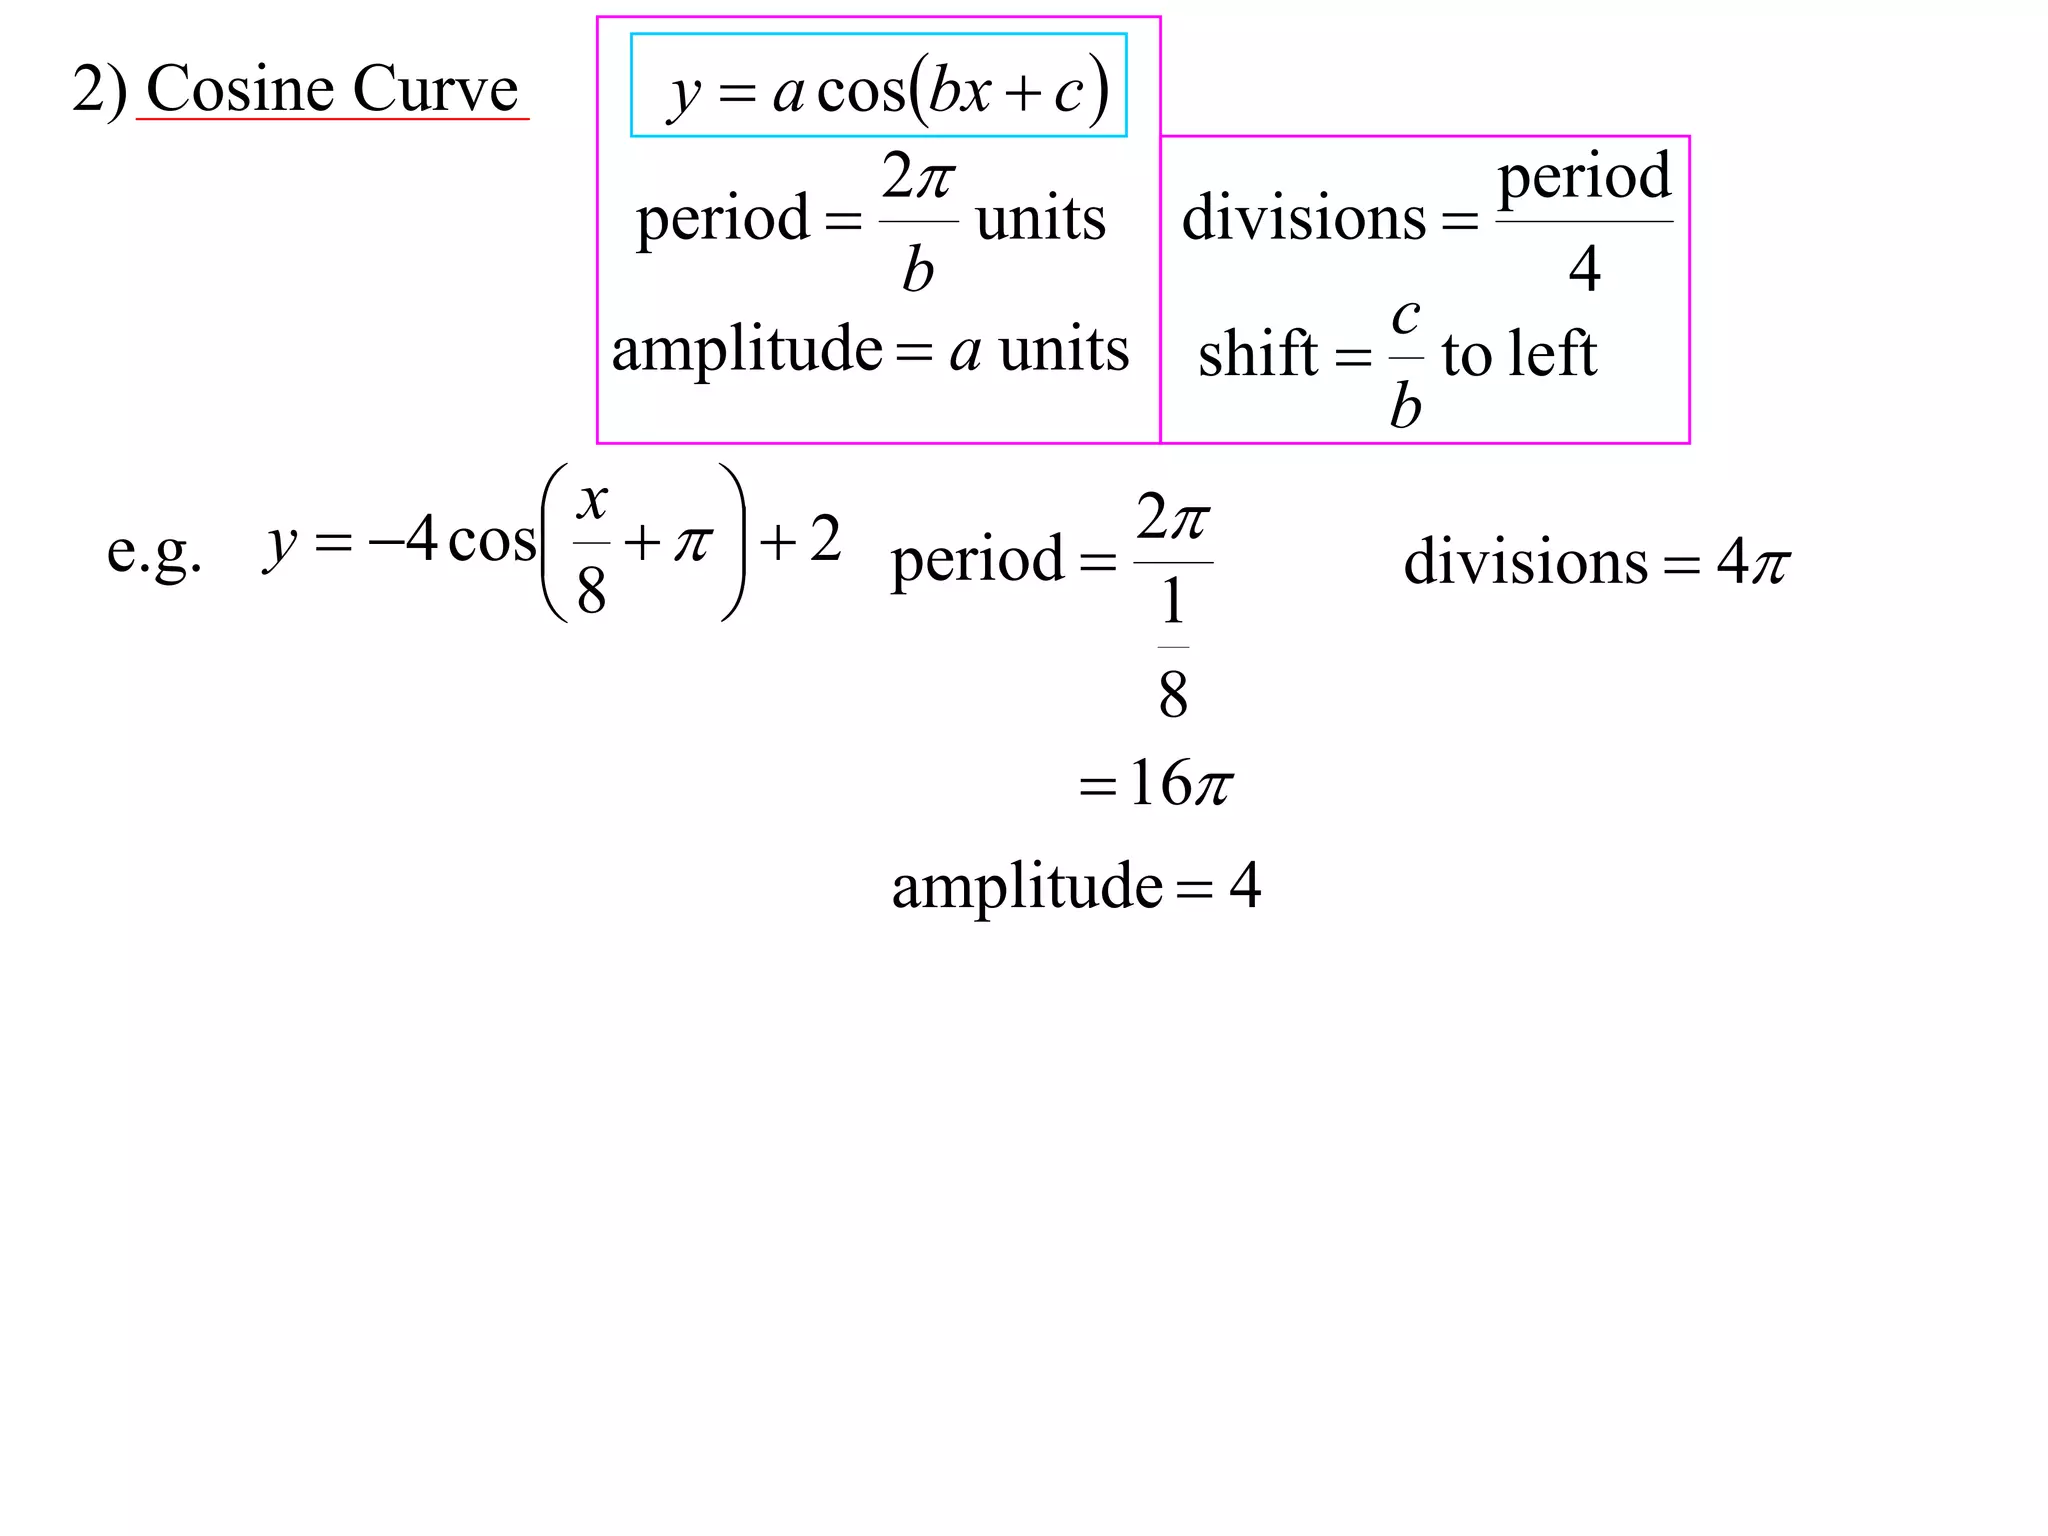
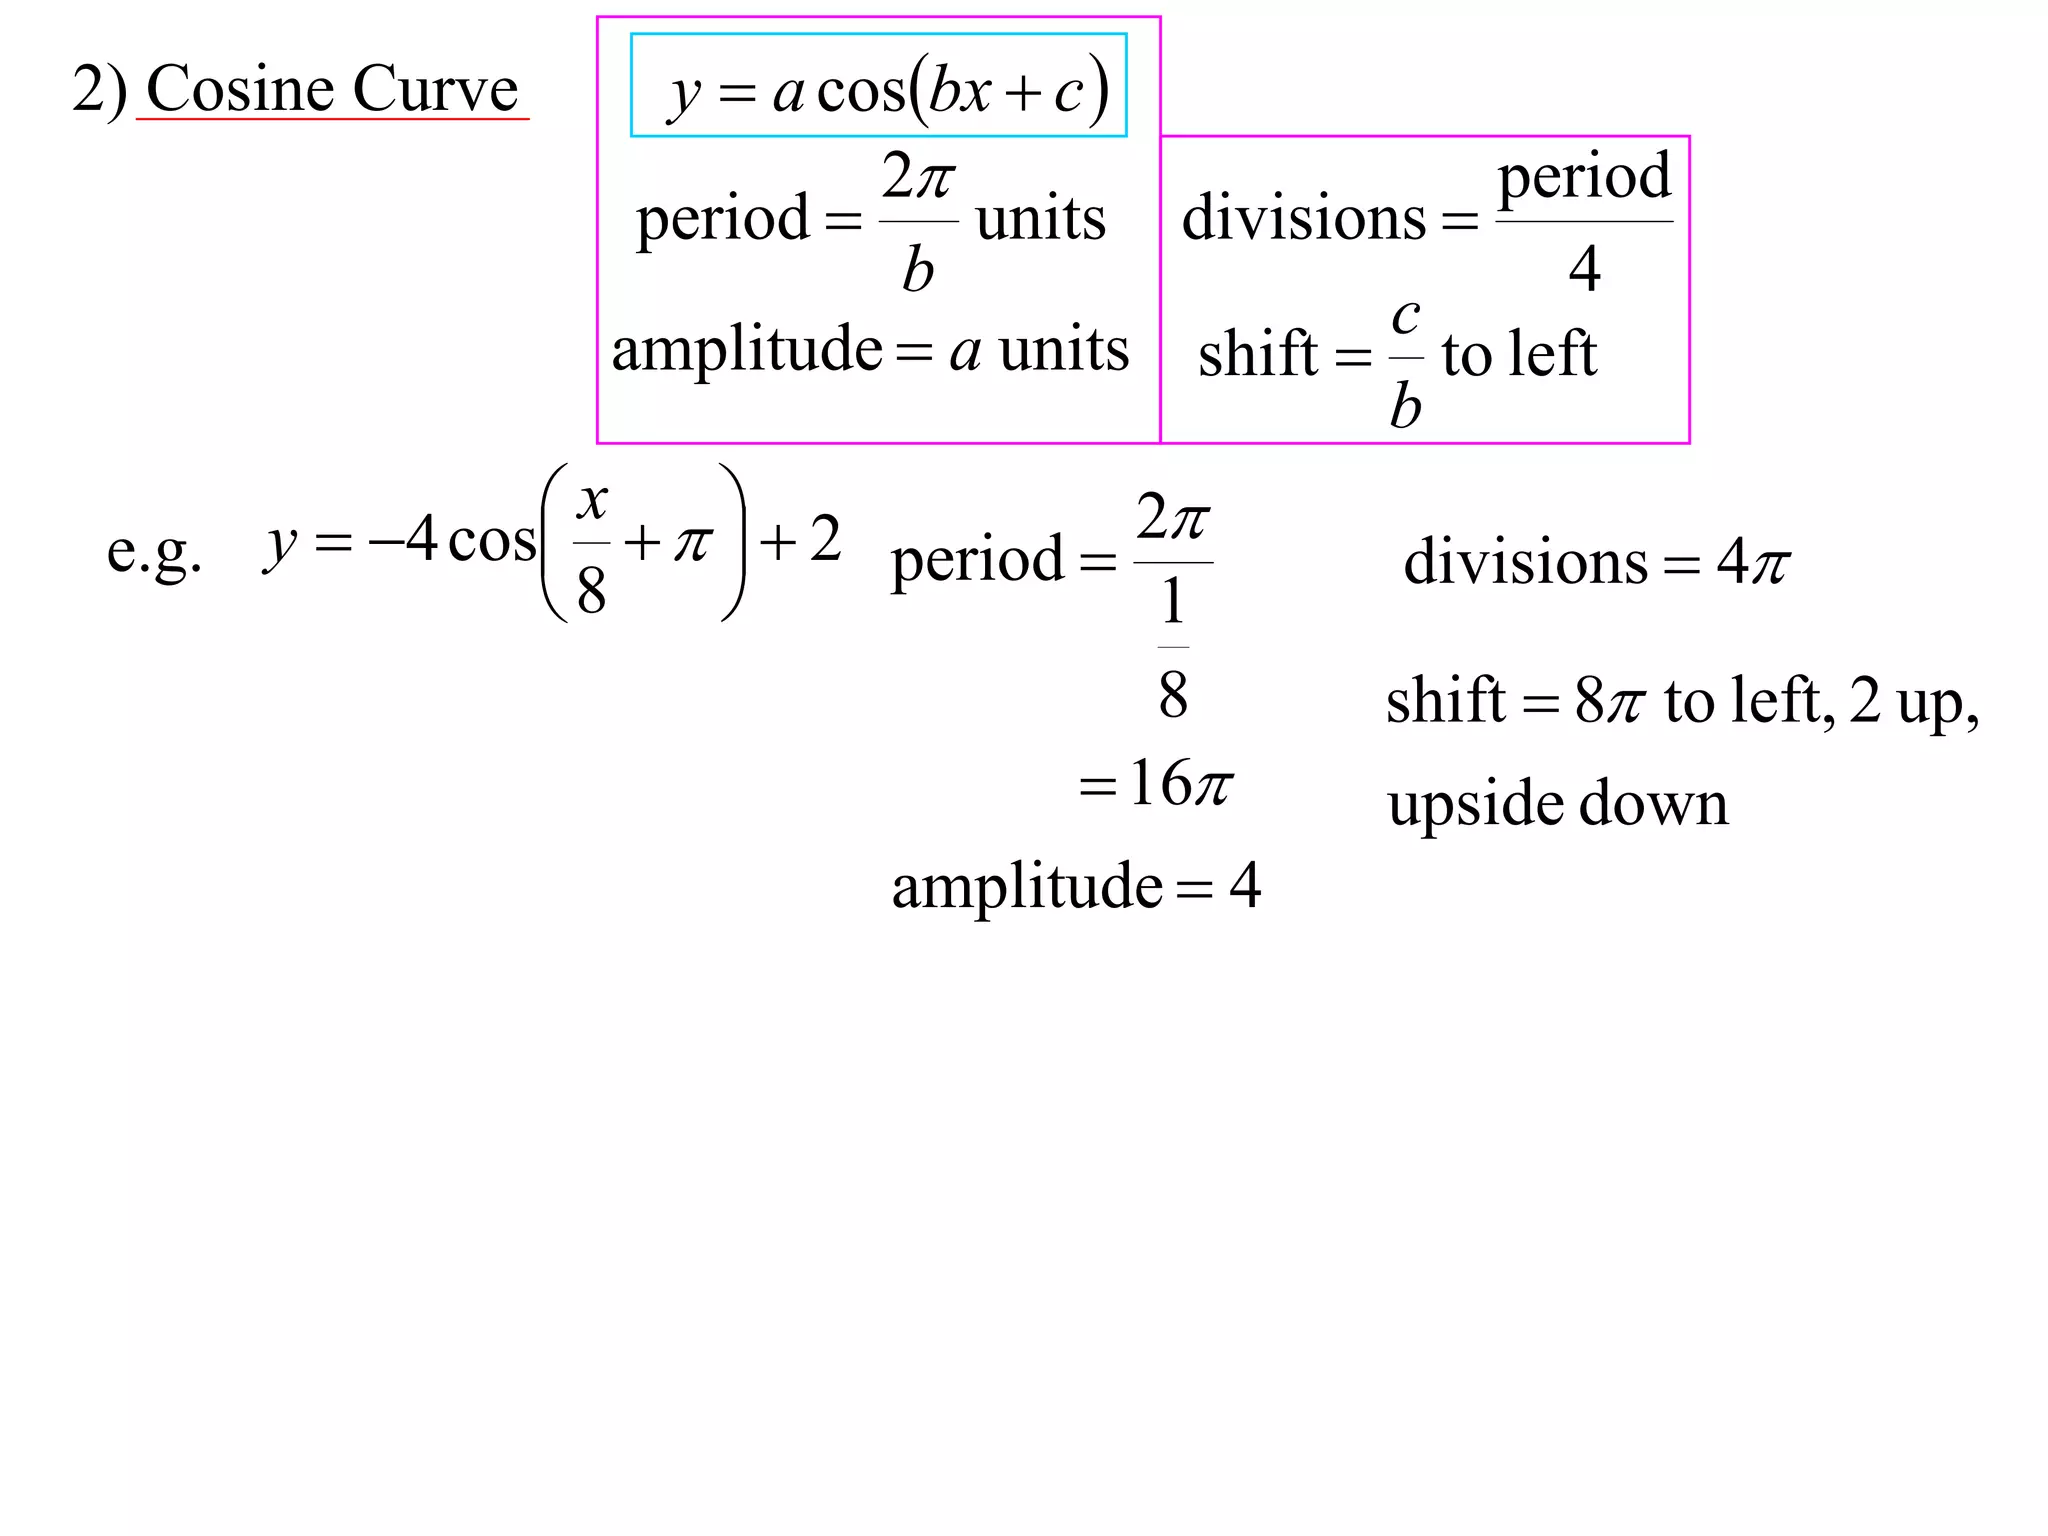
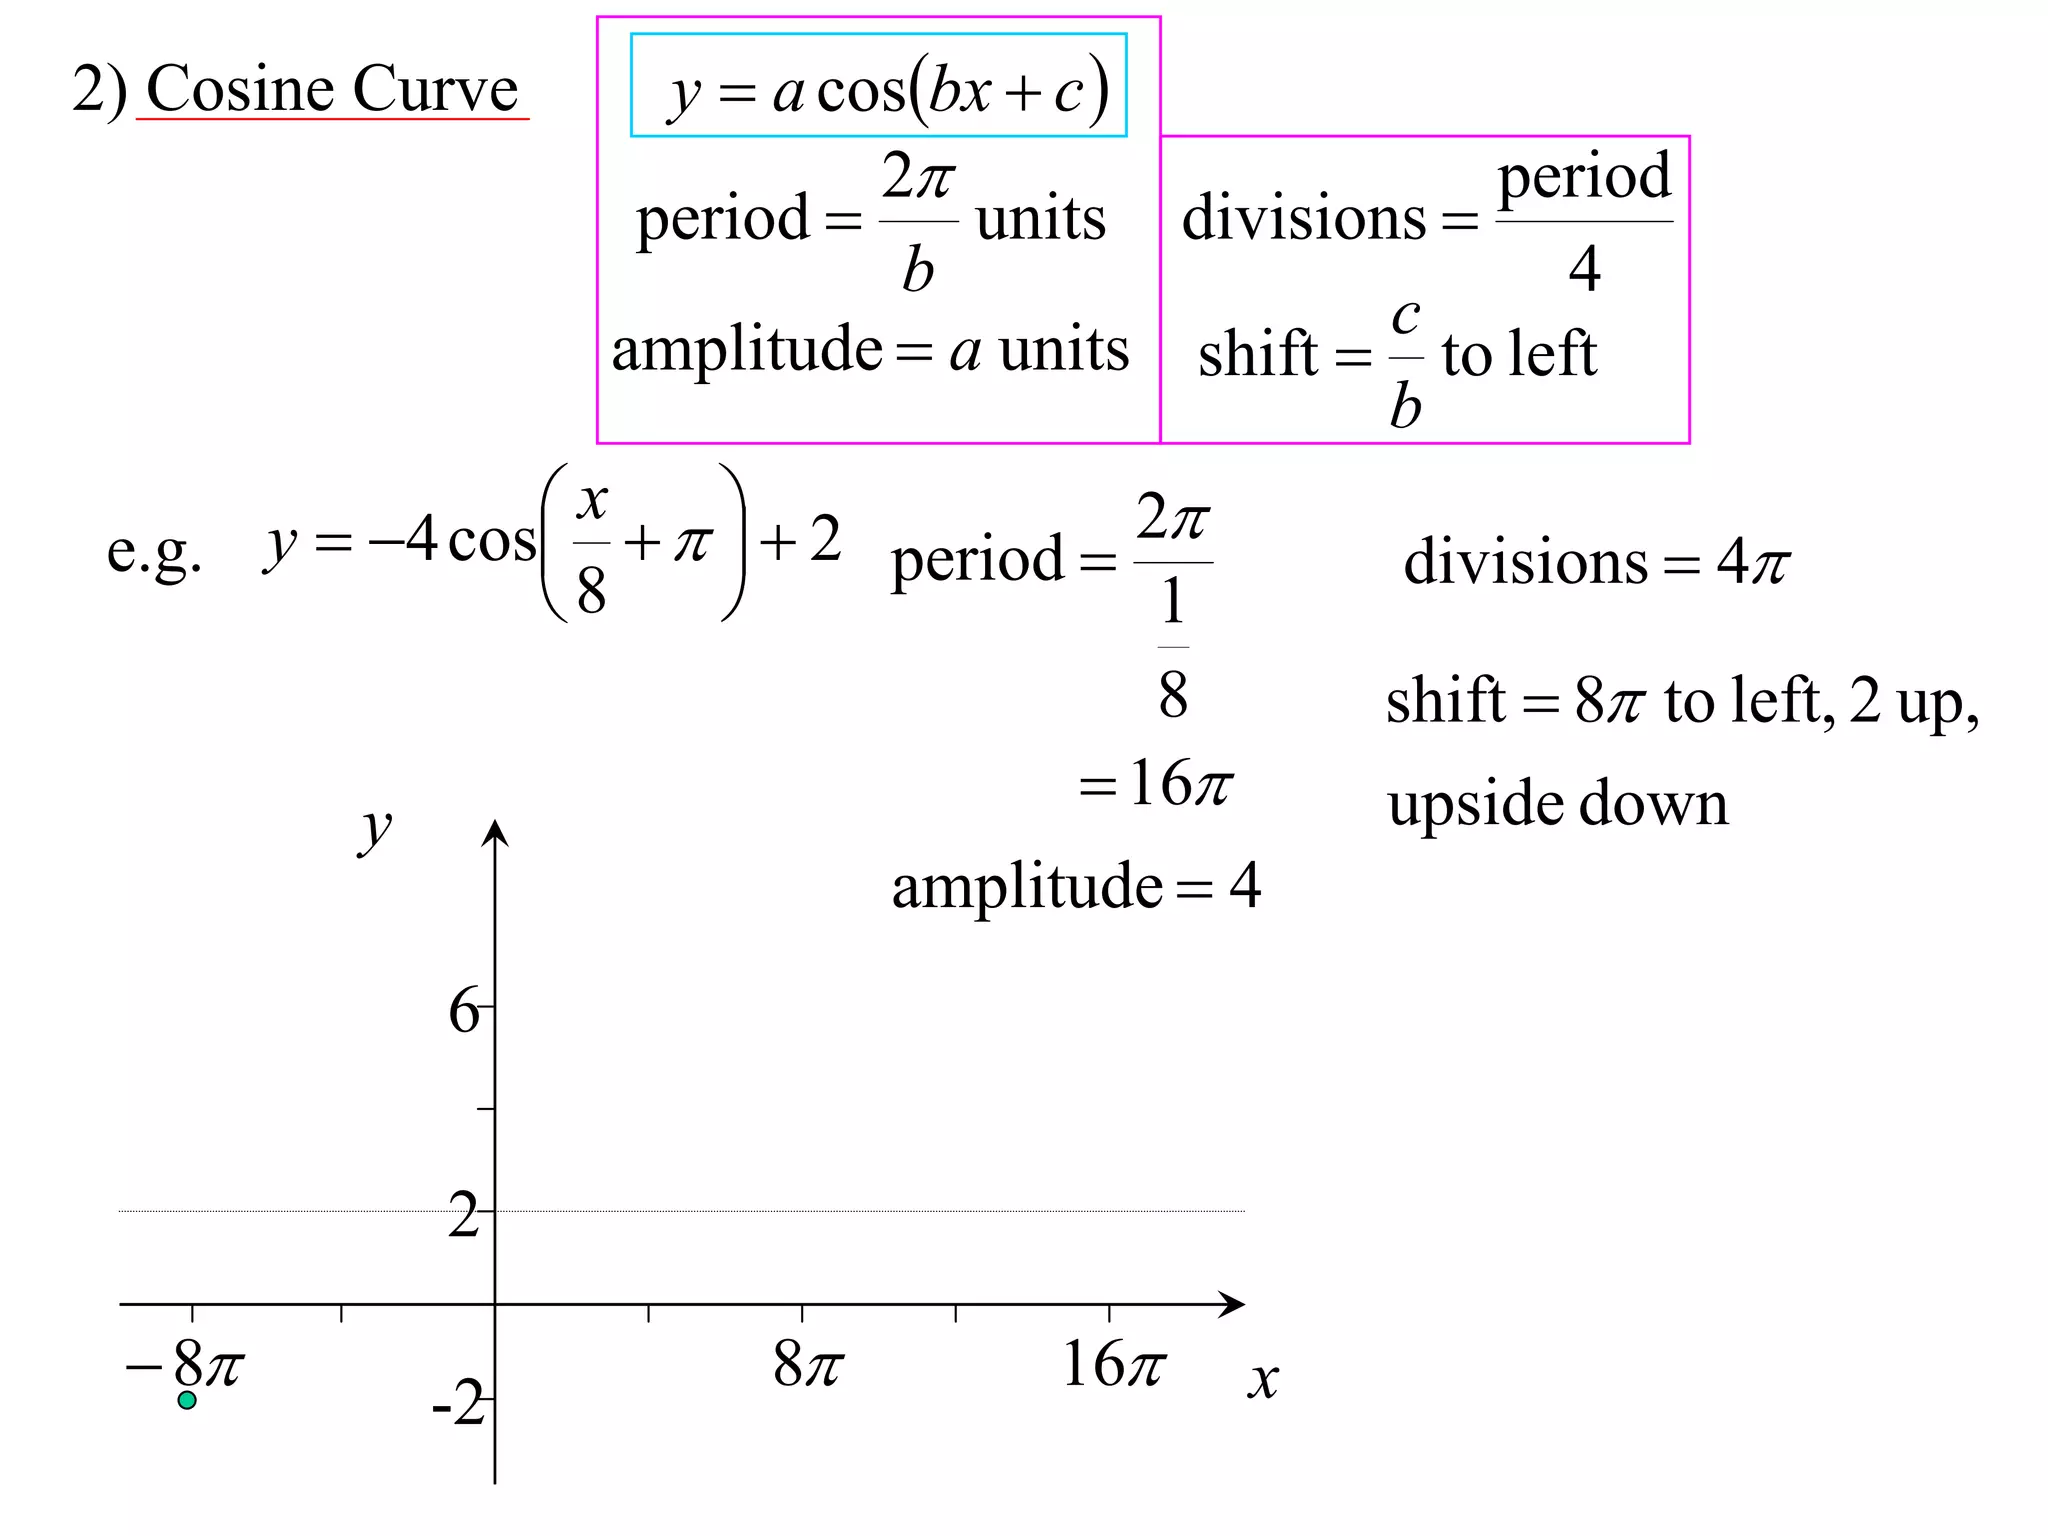
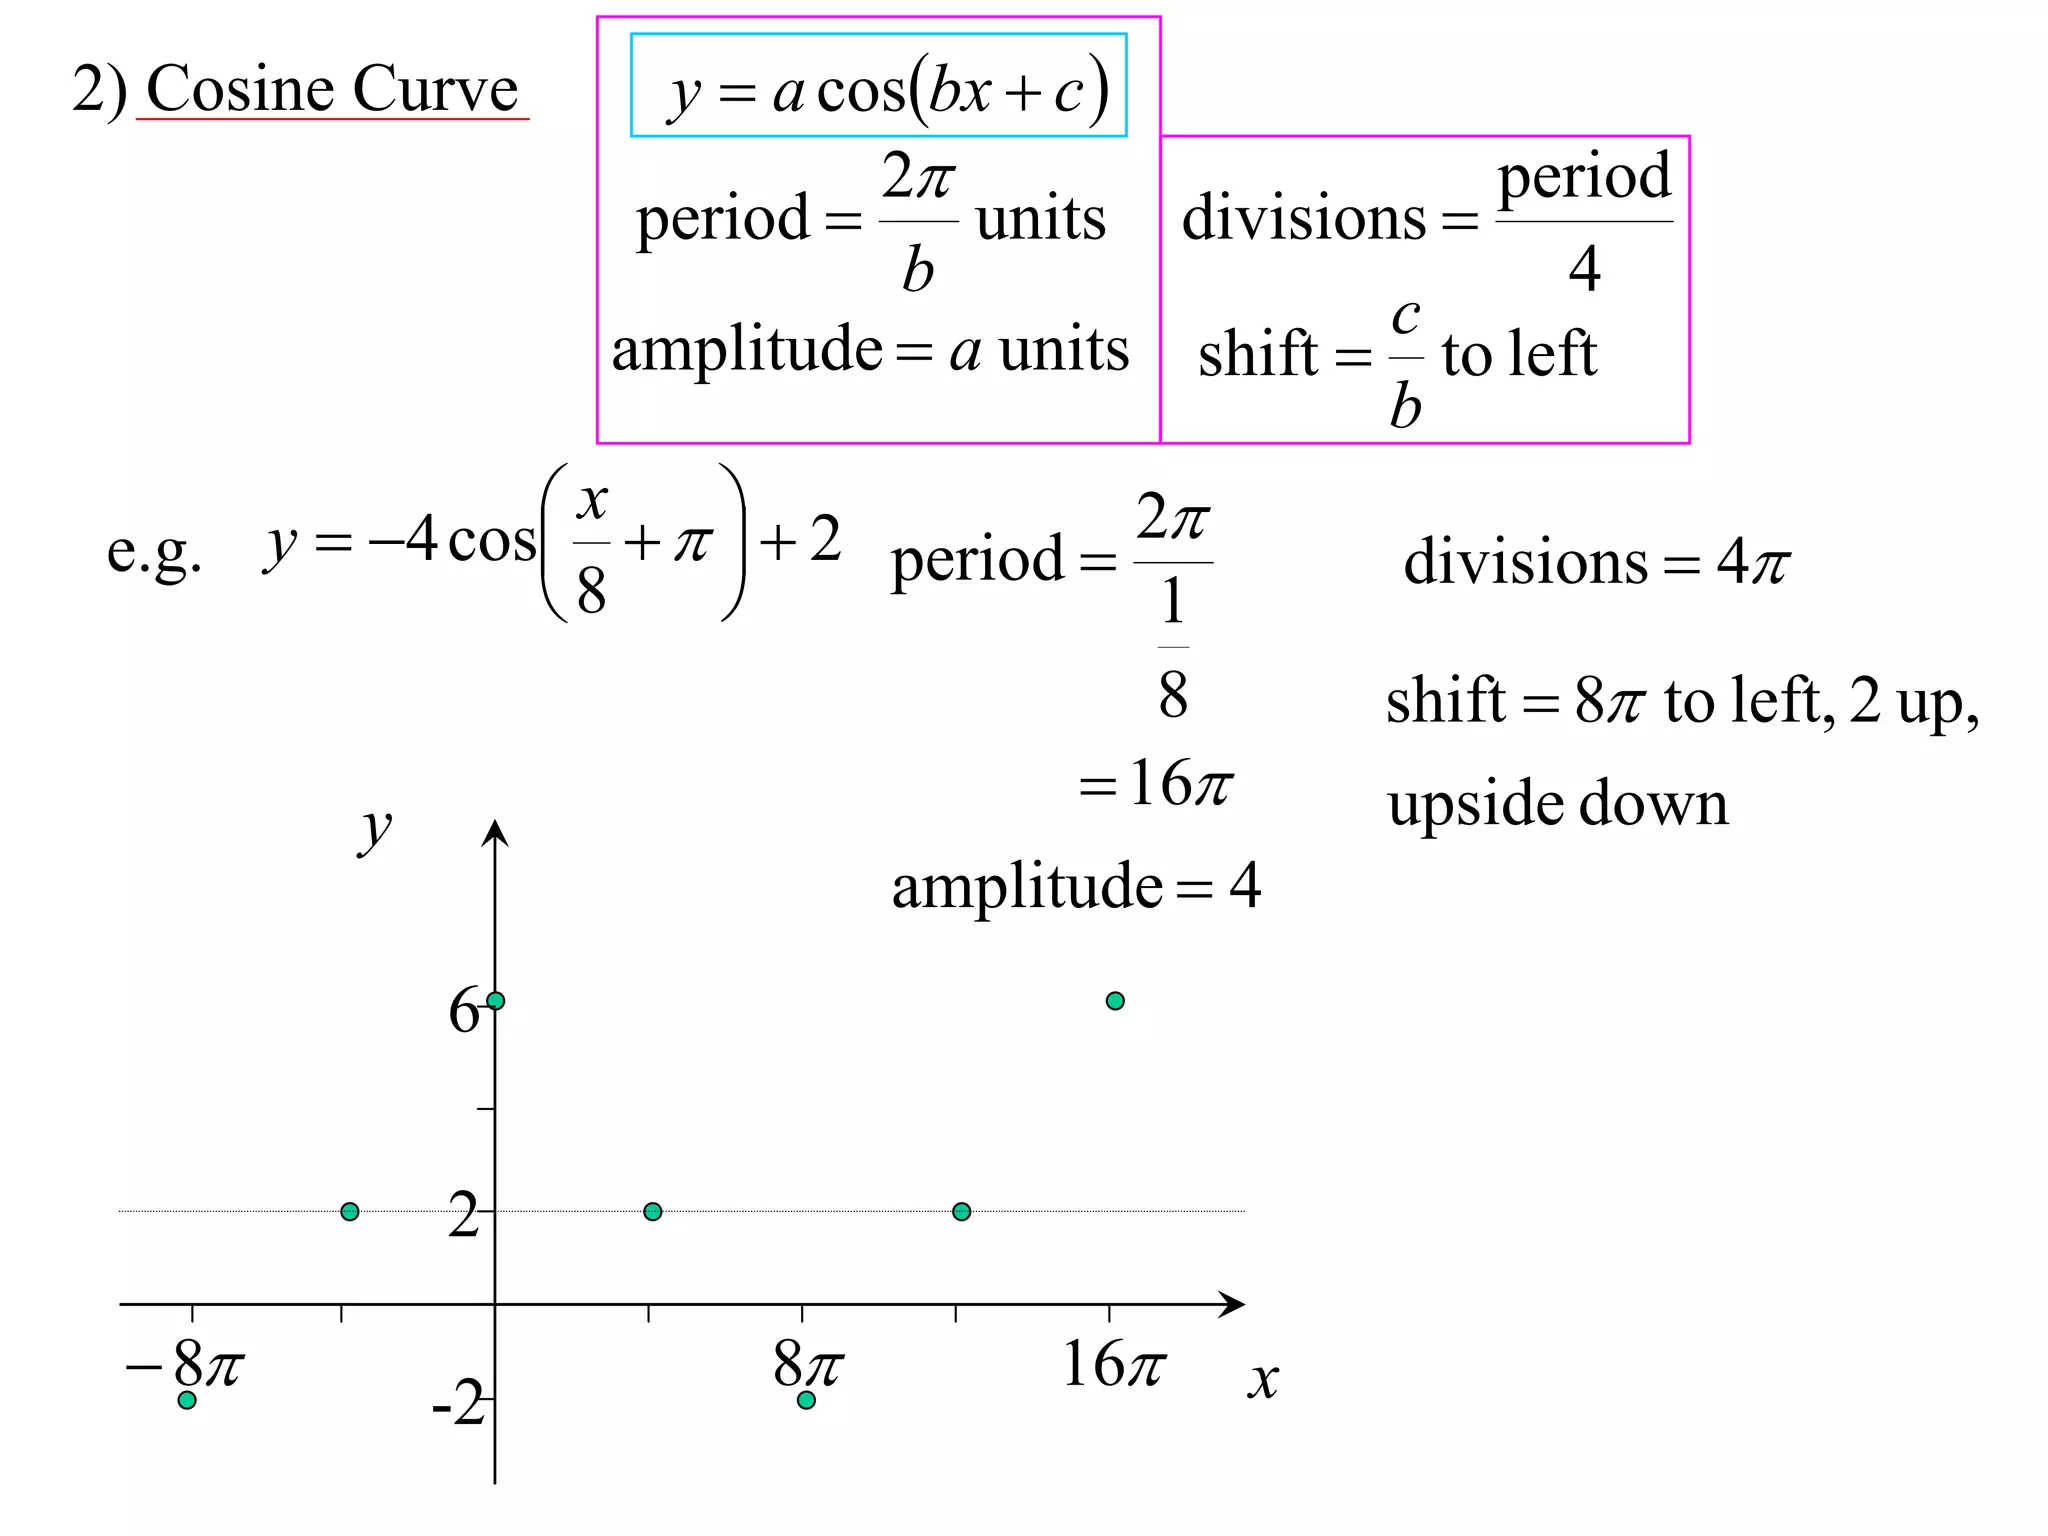
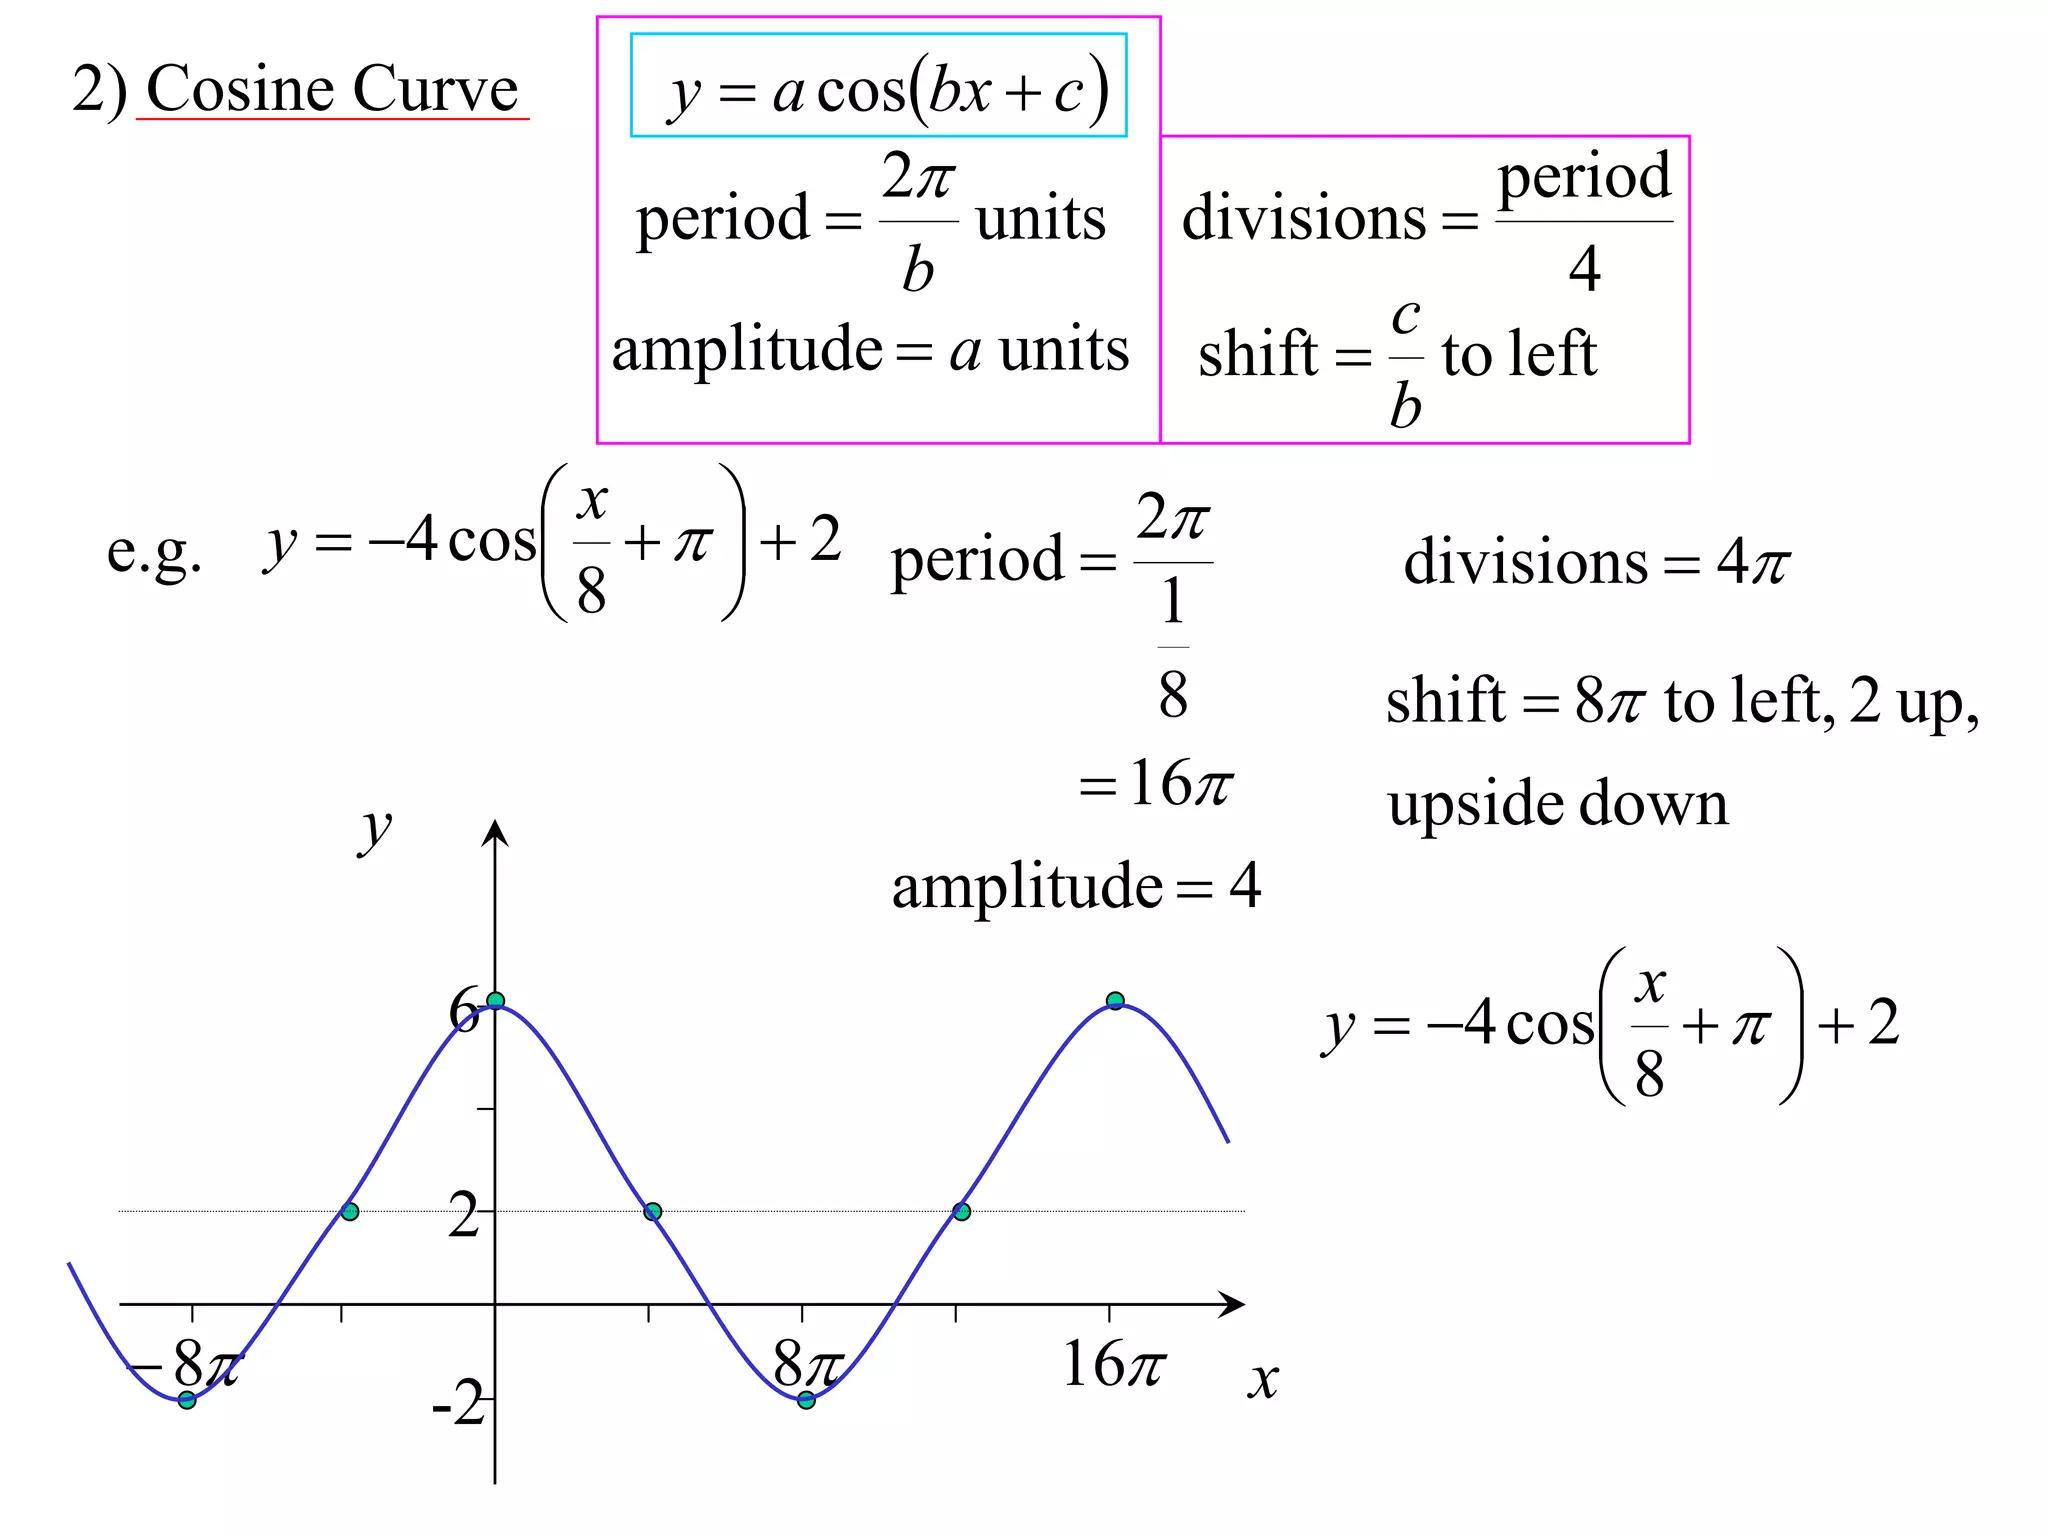
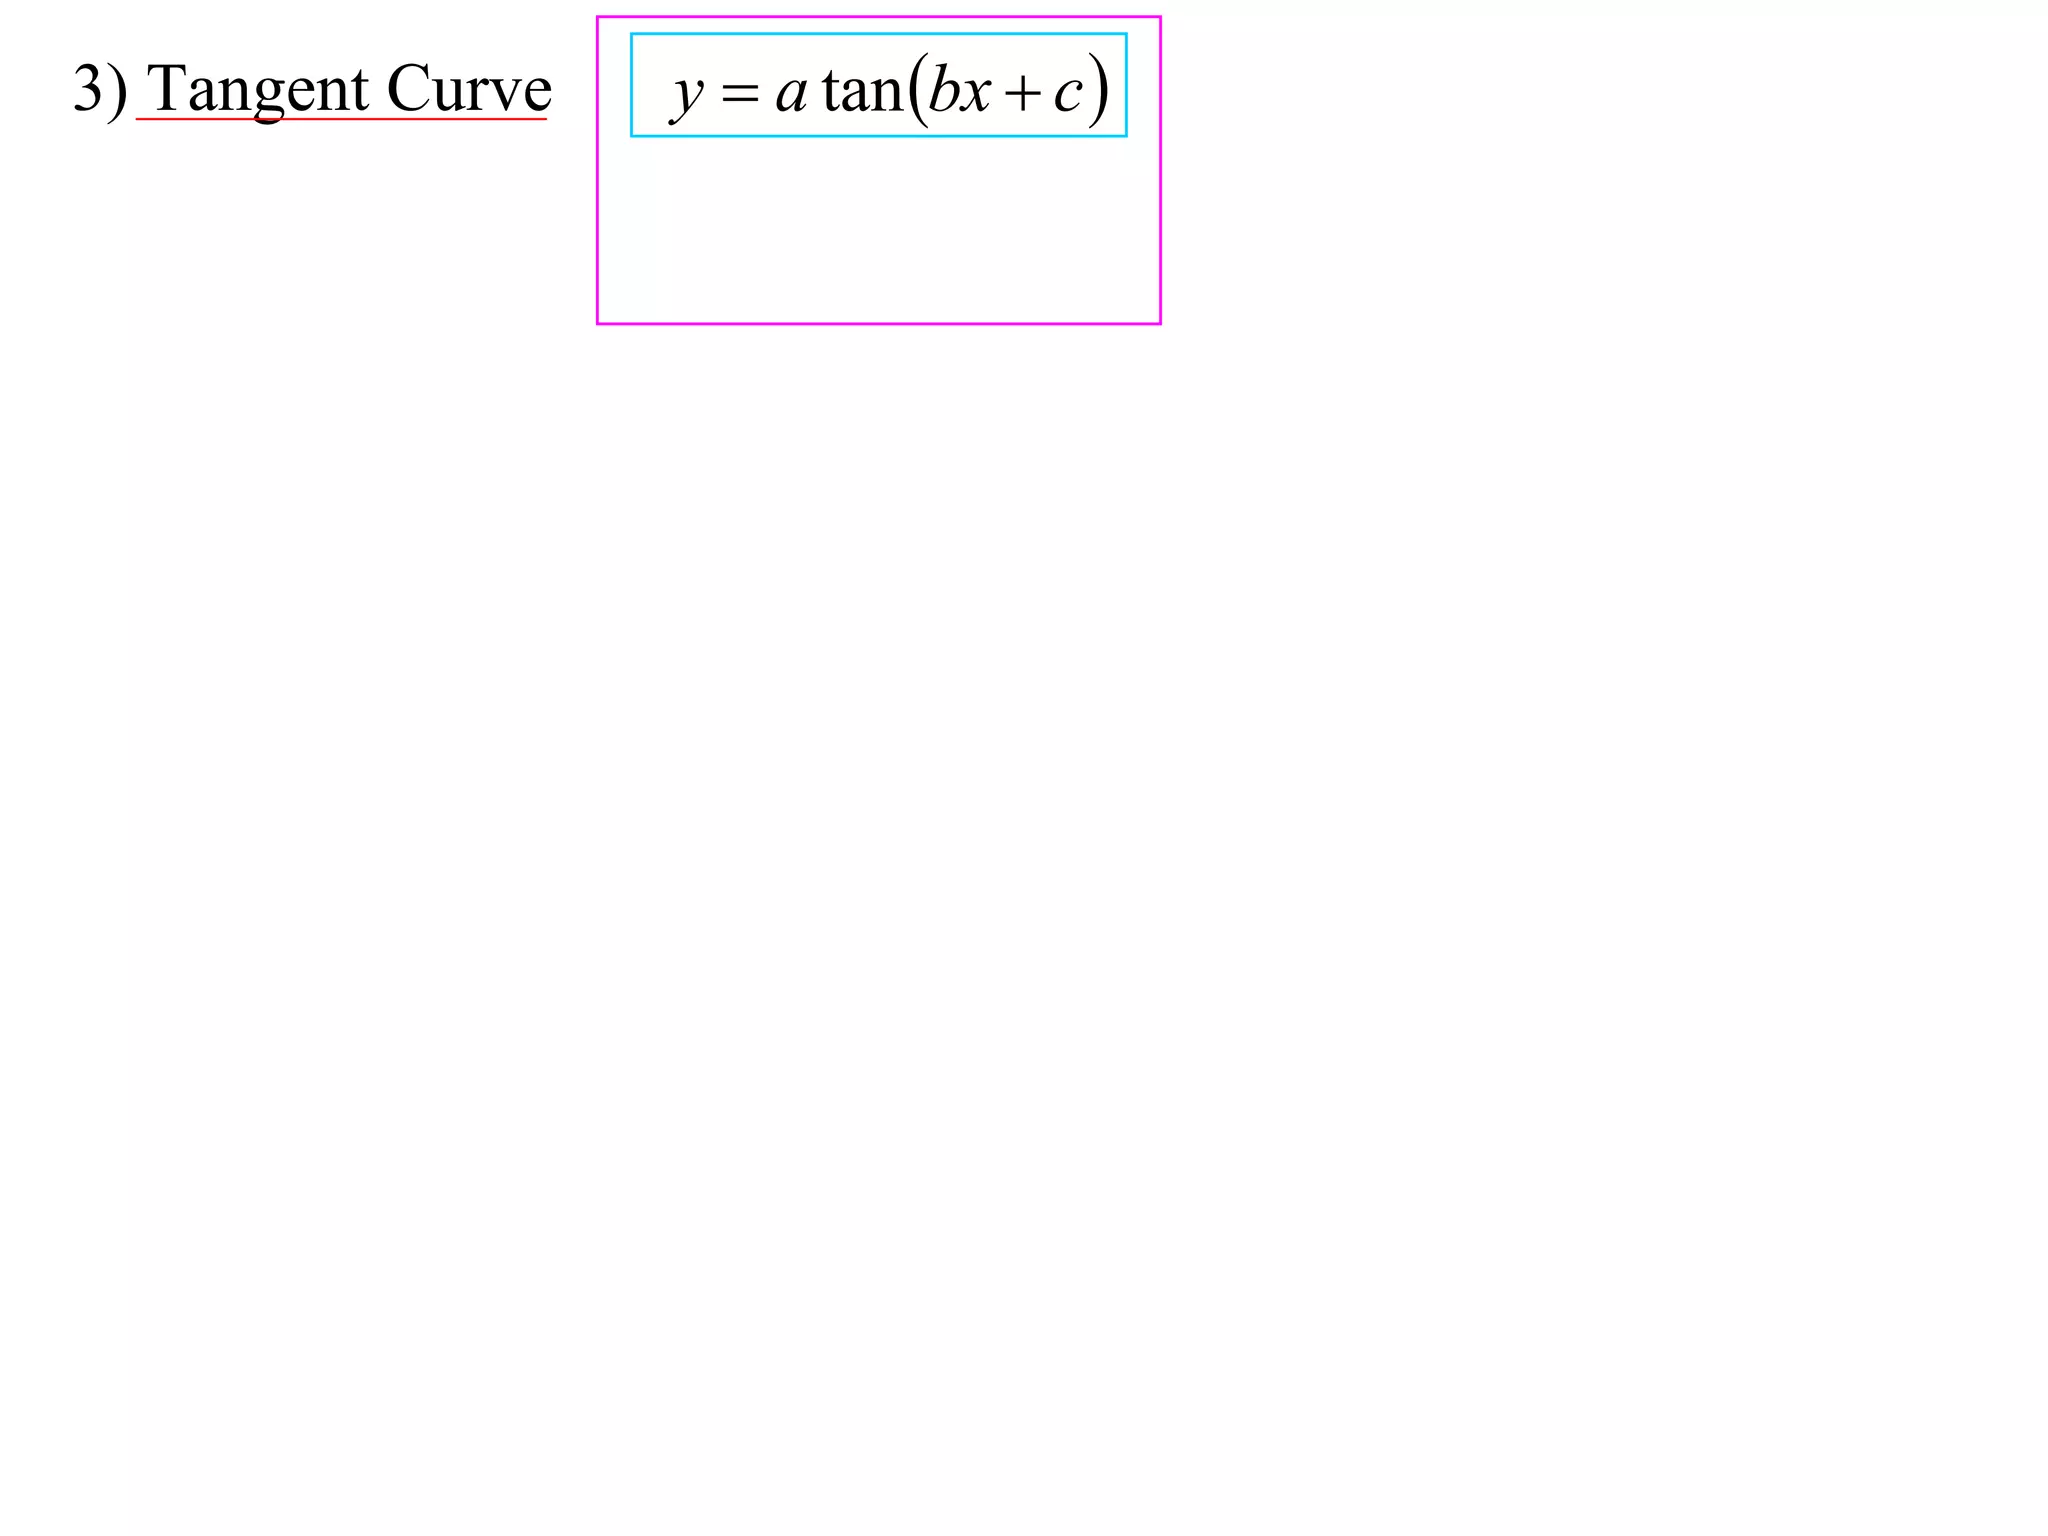
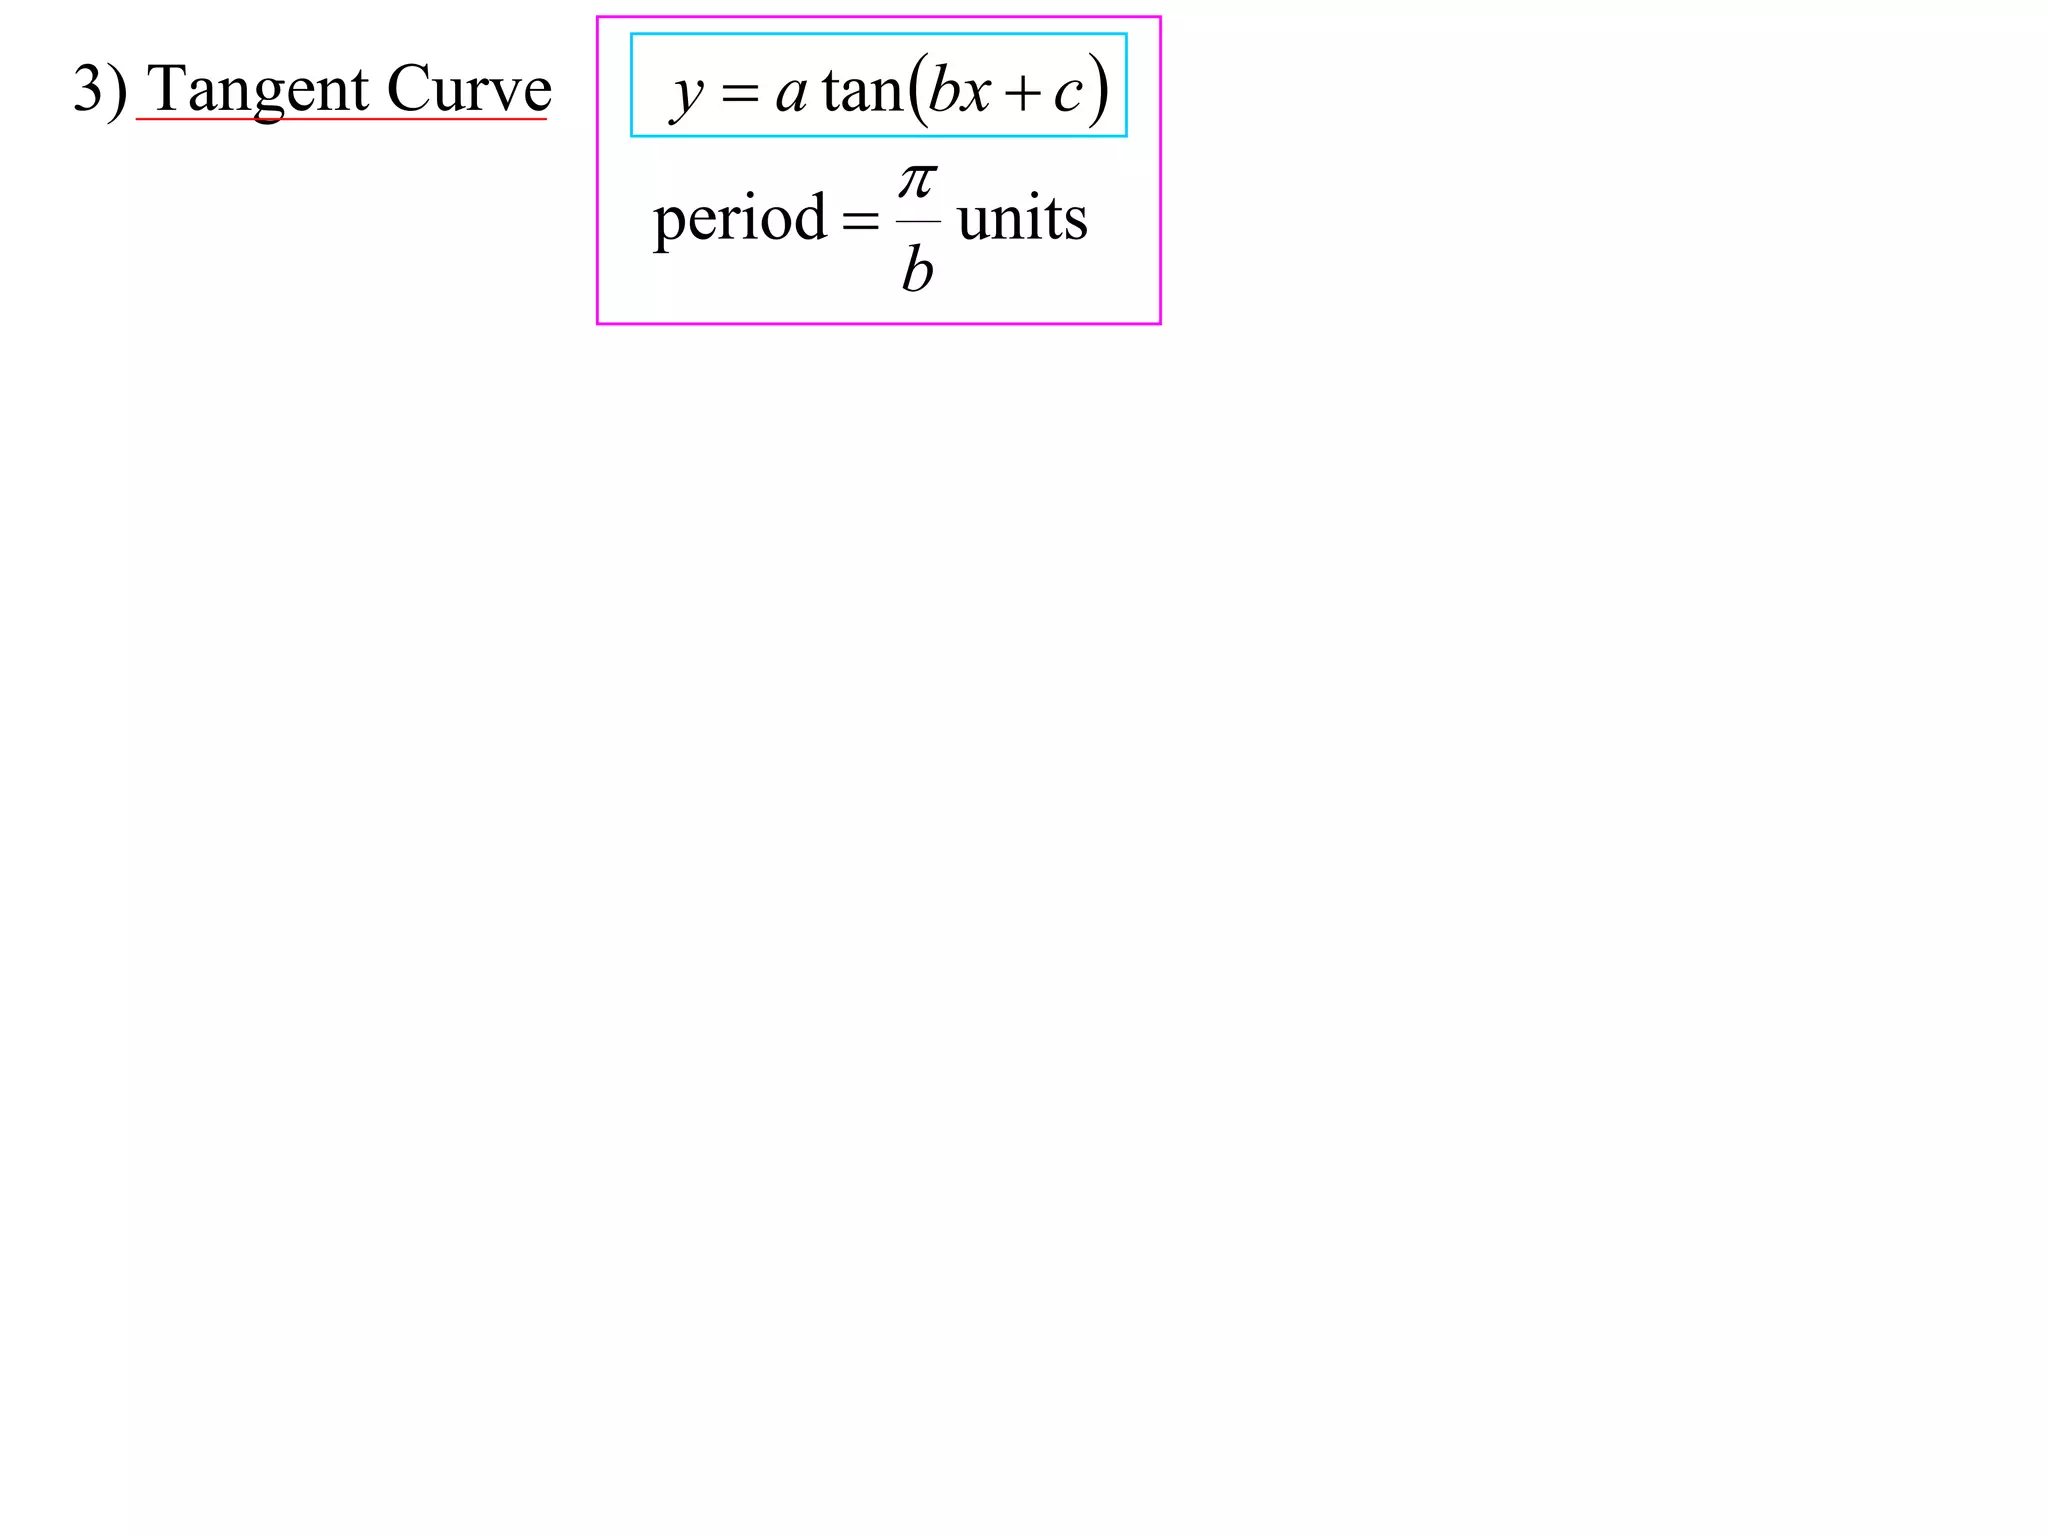
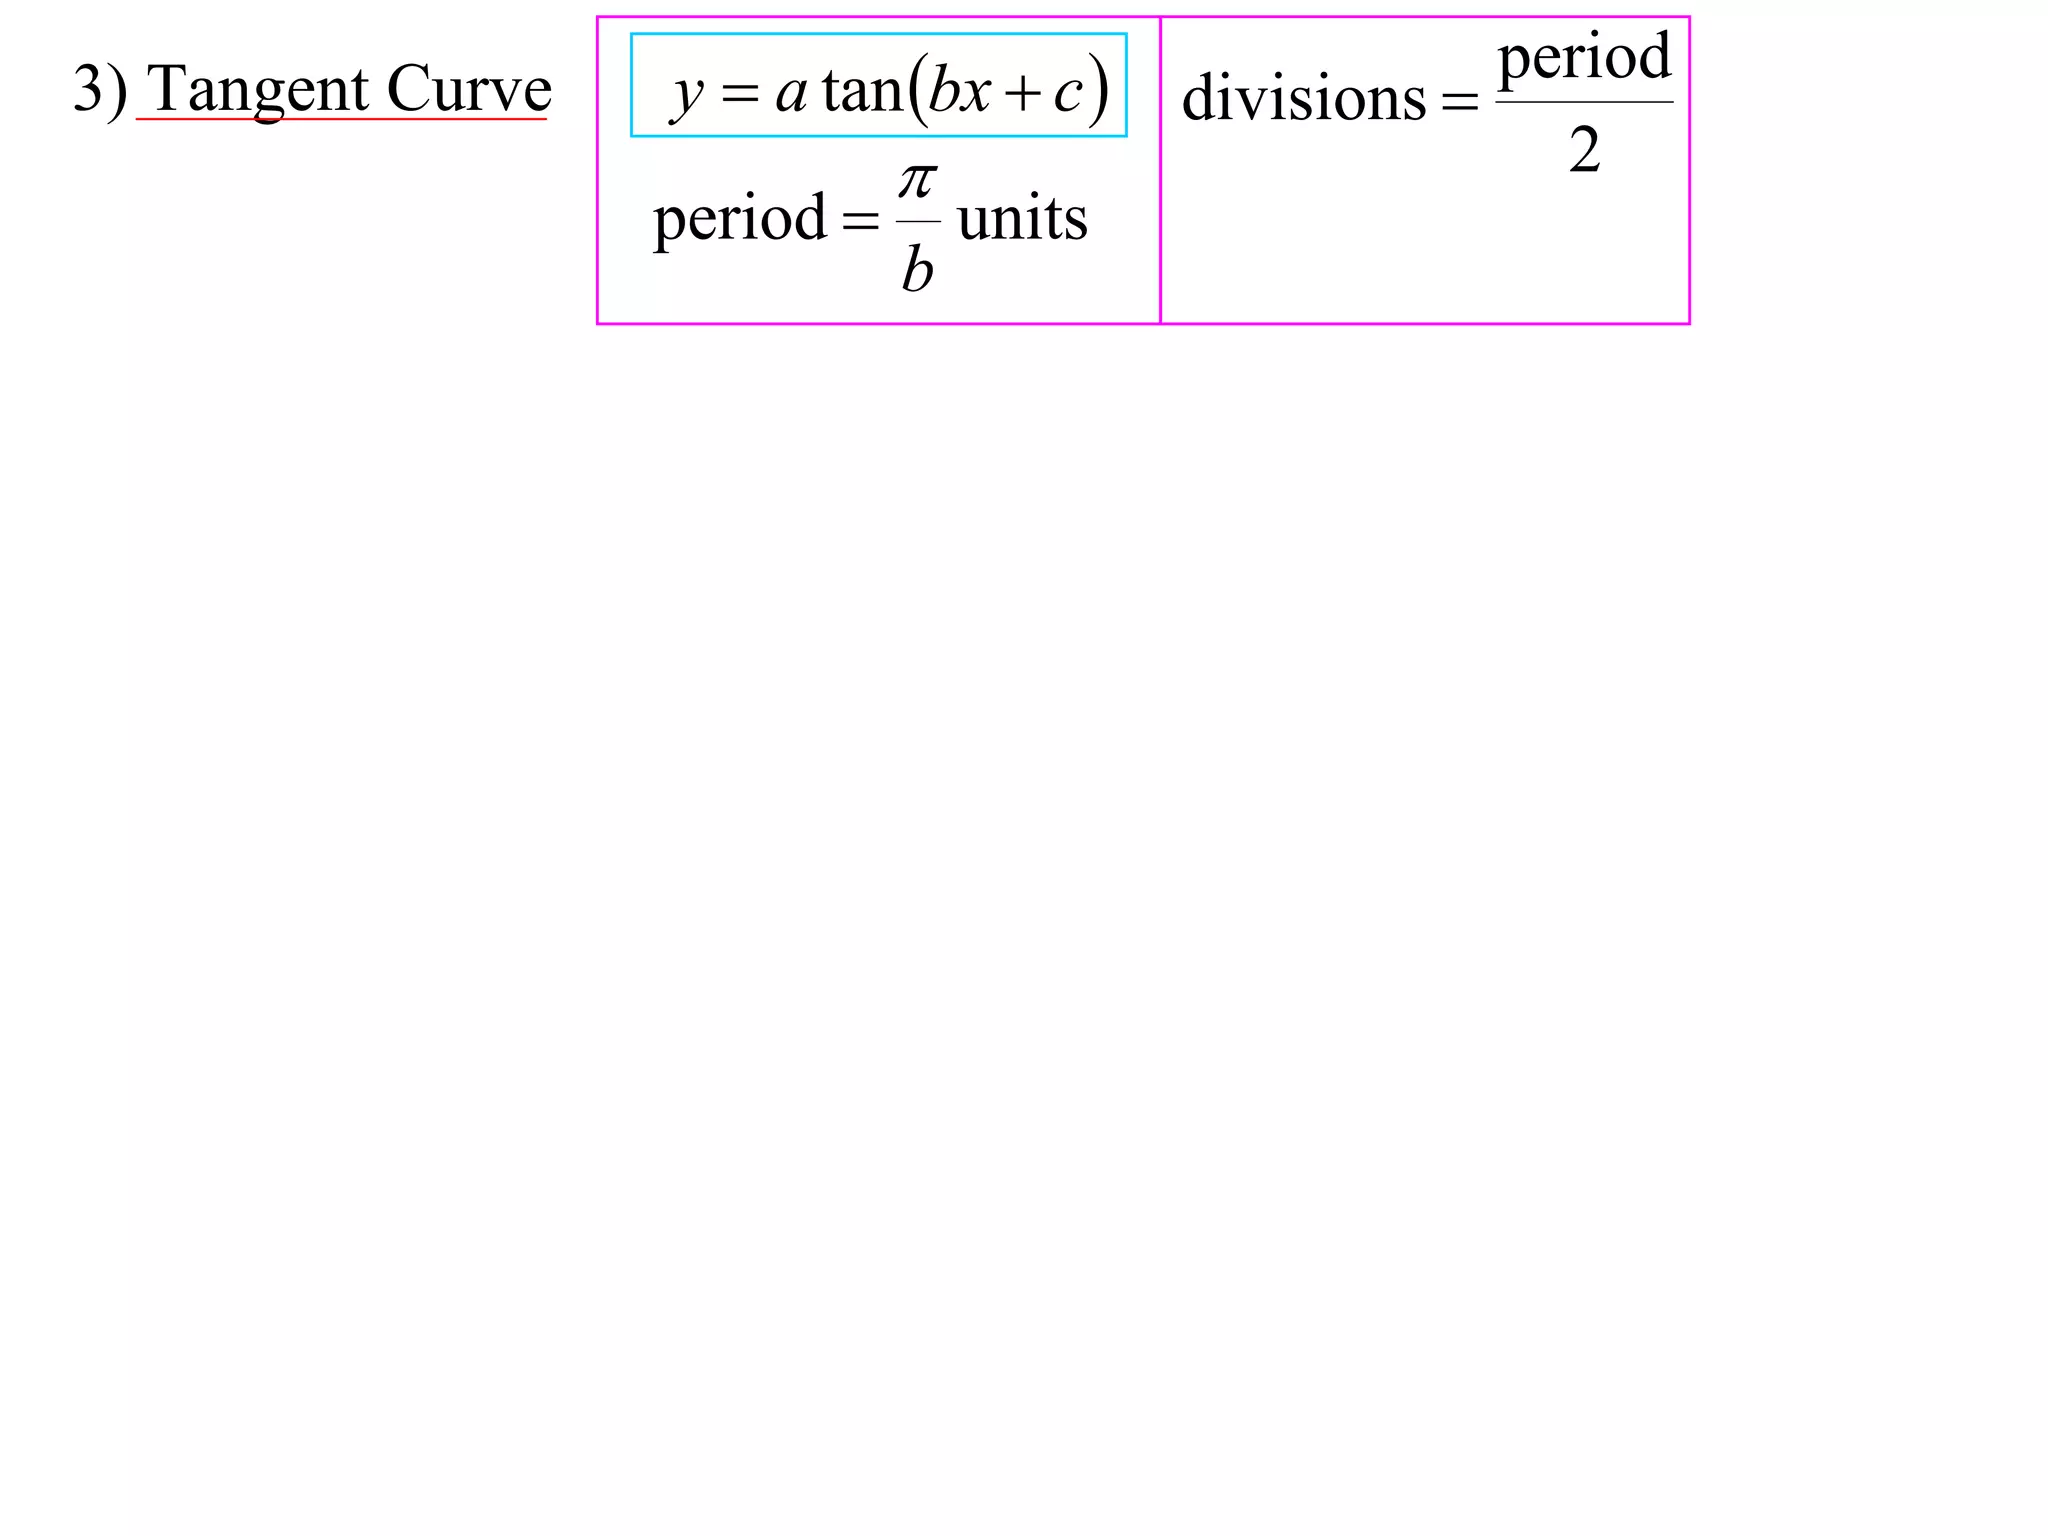
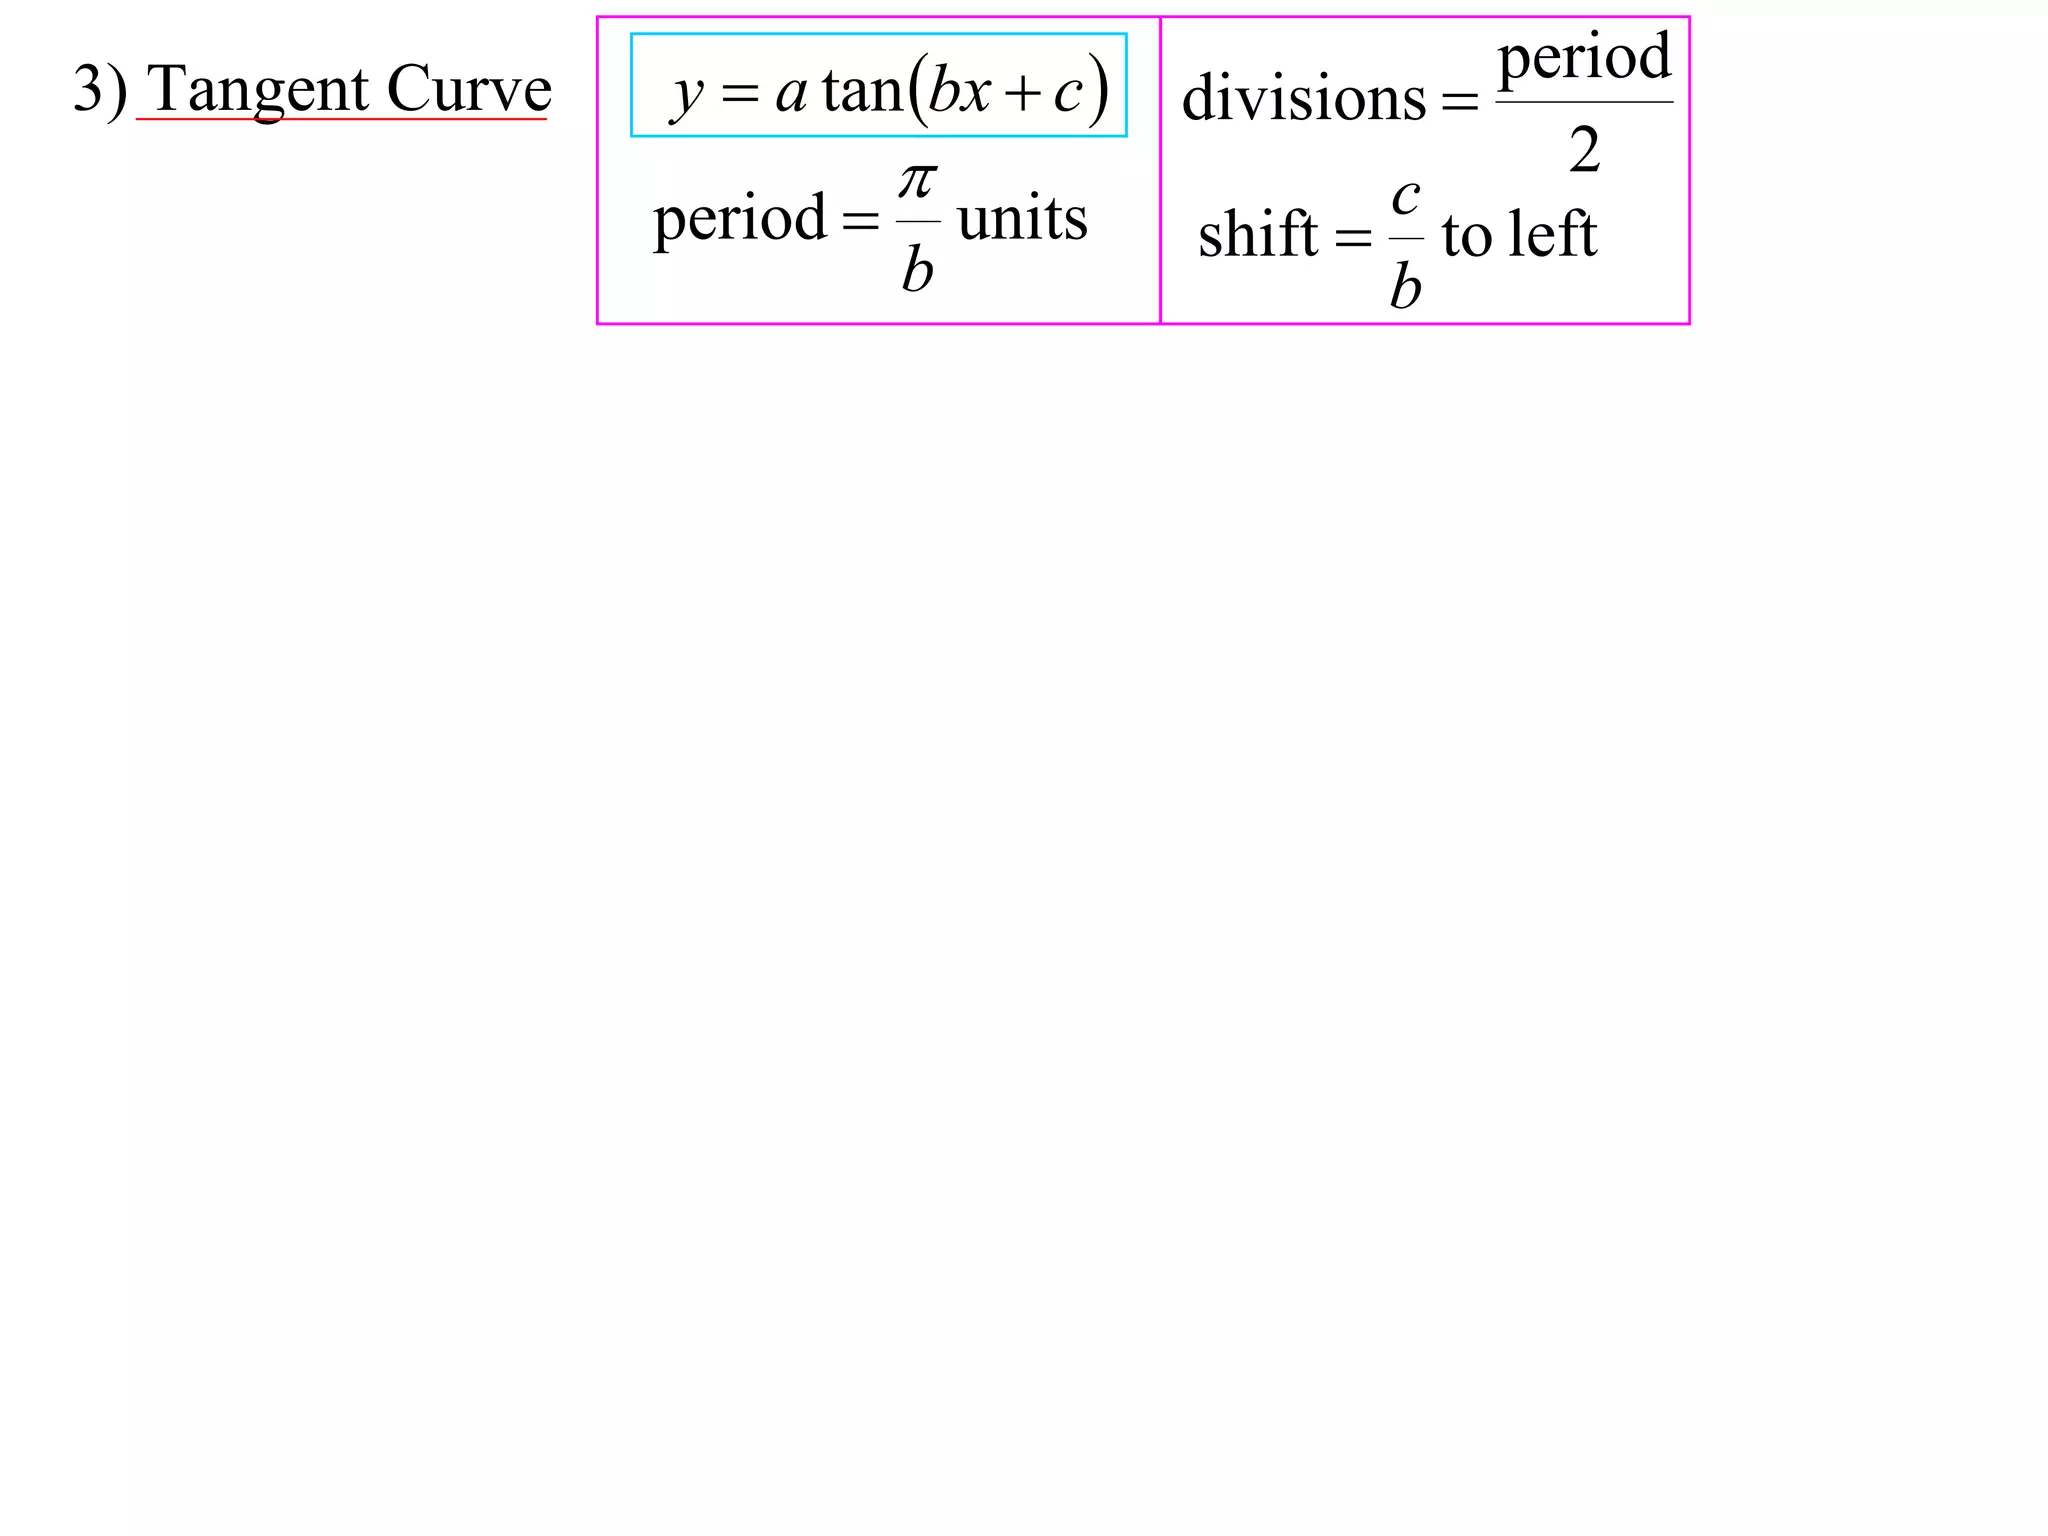
The document discusses graphing trigonometric functions like sine and cosine curves. It explains that a sine curve is defined by the equation y = a sin(bx + c), where the period is 2π/b units, the amplitude is a units, and c shifts the curve left or right. A worked example graphs y = 5 sin(9x - π/2) with a period of 2π/9 units and amplitude of 5 units, shifted π/18 units to the right. The cosine curve is similarly defined by y = a cos(bx + c) with the same period, amplitude, and shift properties. An example graphs y = -4 cos((x + π)/8 + 2