Downloaded 161 times


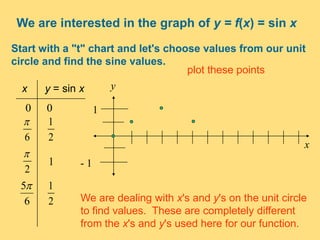
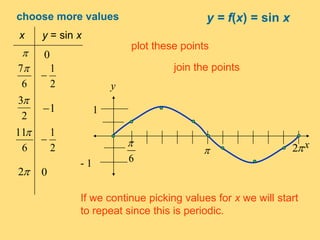
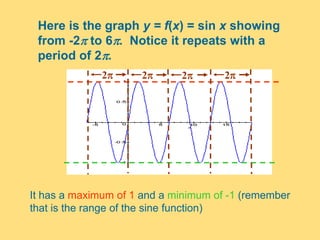
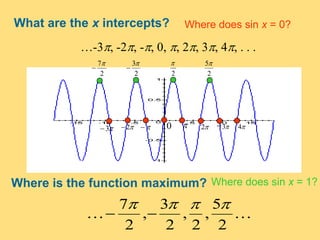
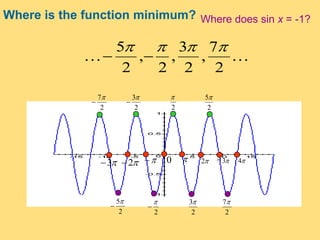
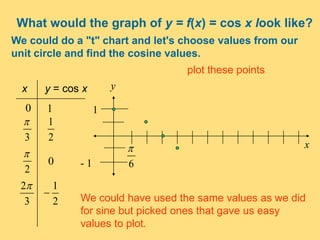
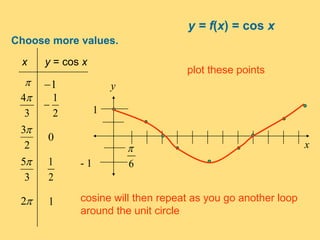
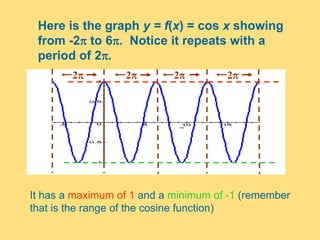
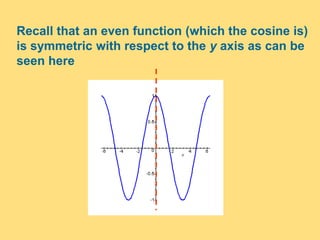
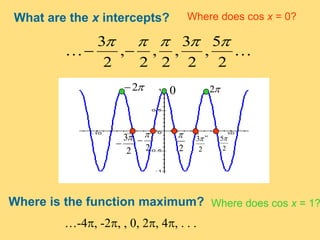
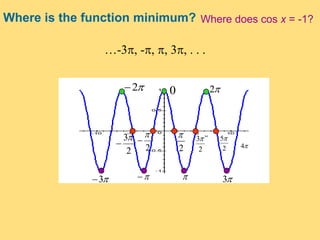
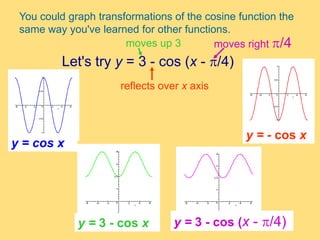
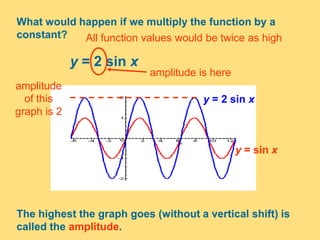
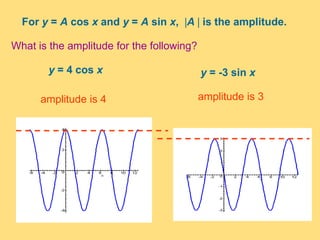
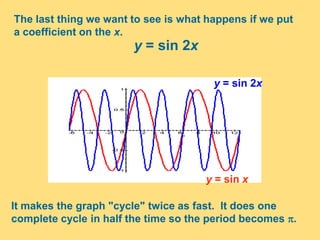
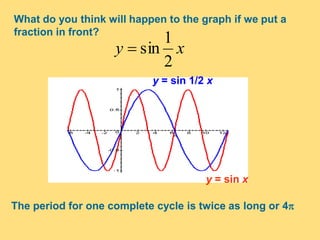
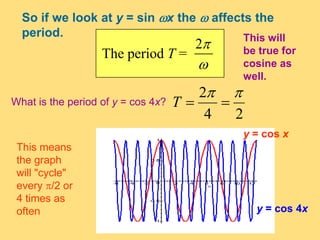
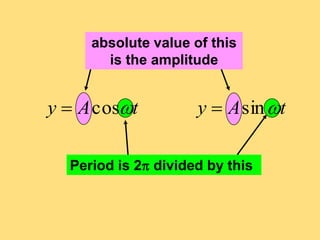
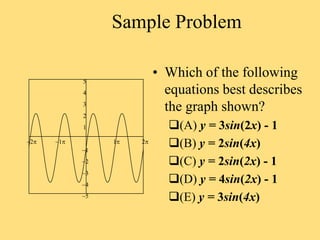
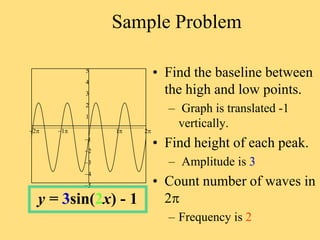
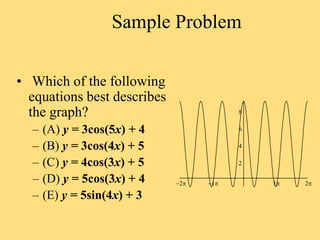
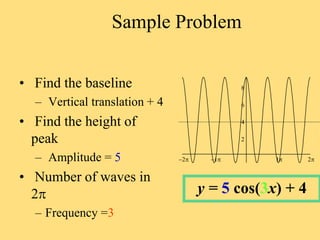


The document provides a detailed explanation of the graphs of sine and cosine functions, including their characteristics such as periodicity, maximum and minimum values, and transformations. It discusses the amplitude, frequency, and transformations of these functions, along with sample problems for practice. Additionally, it emphasizes how coefficients affect the period and amplitude of the sine and cosine functions.