Downloaded 840 times
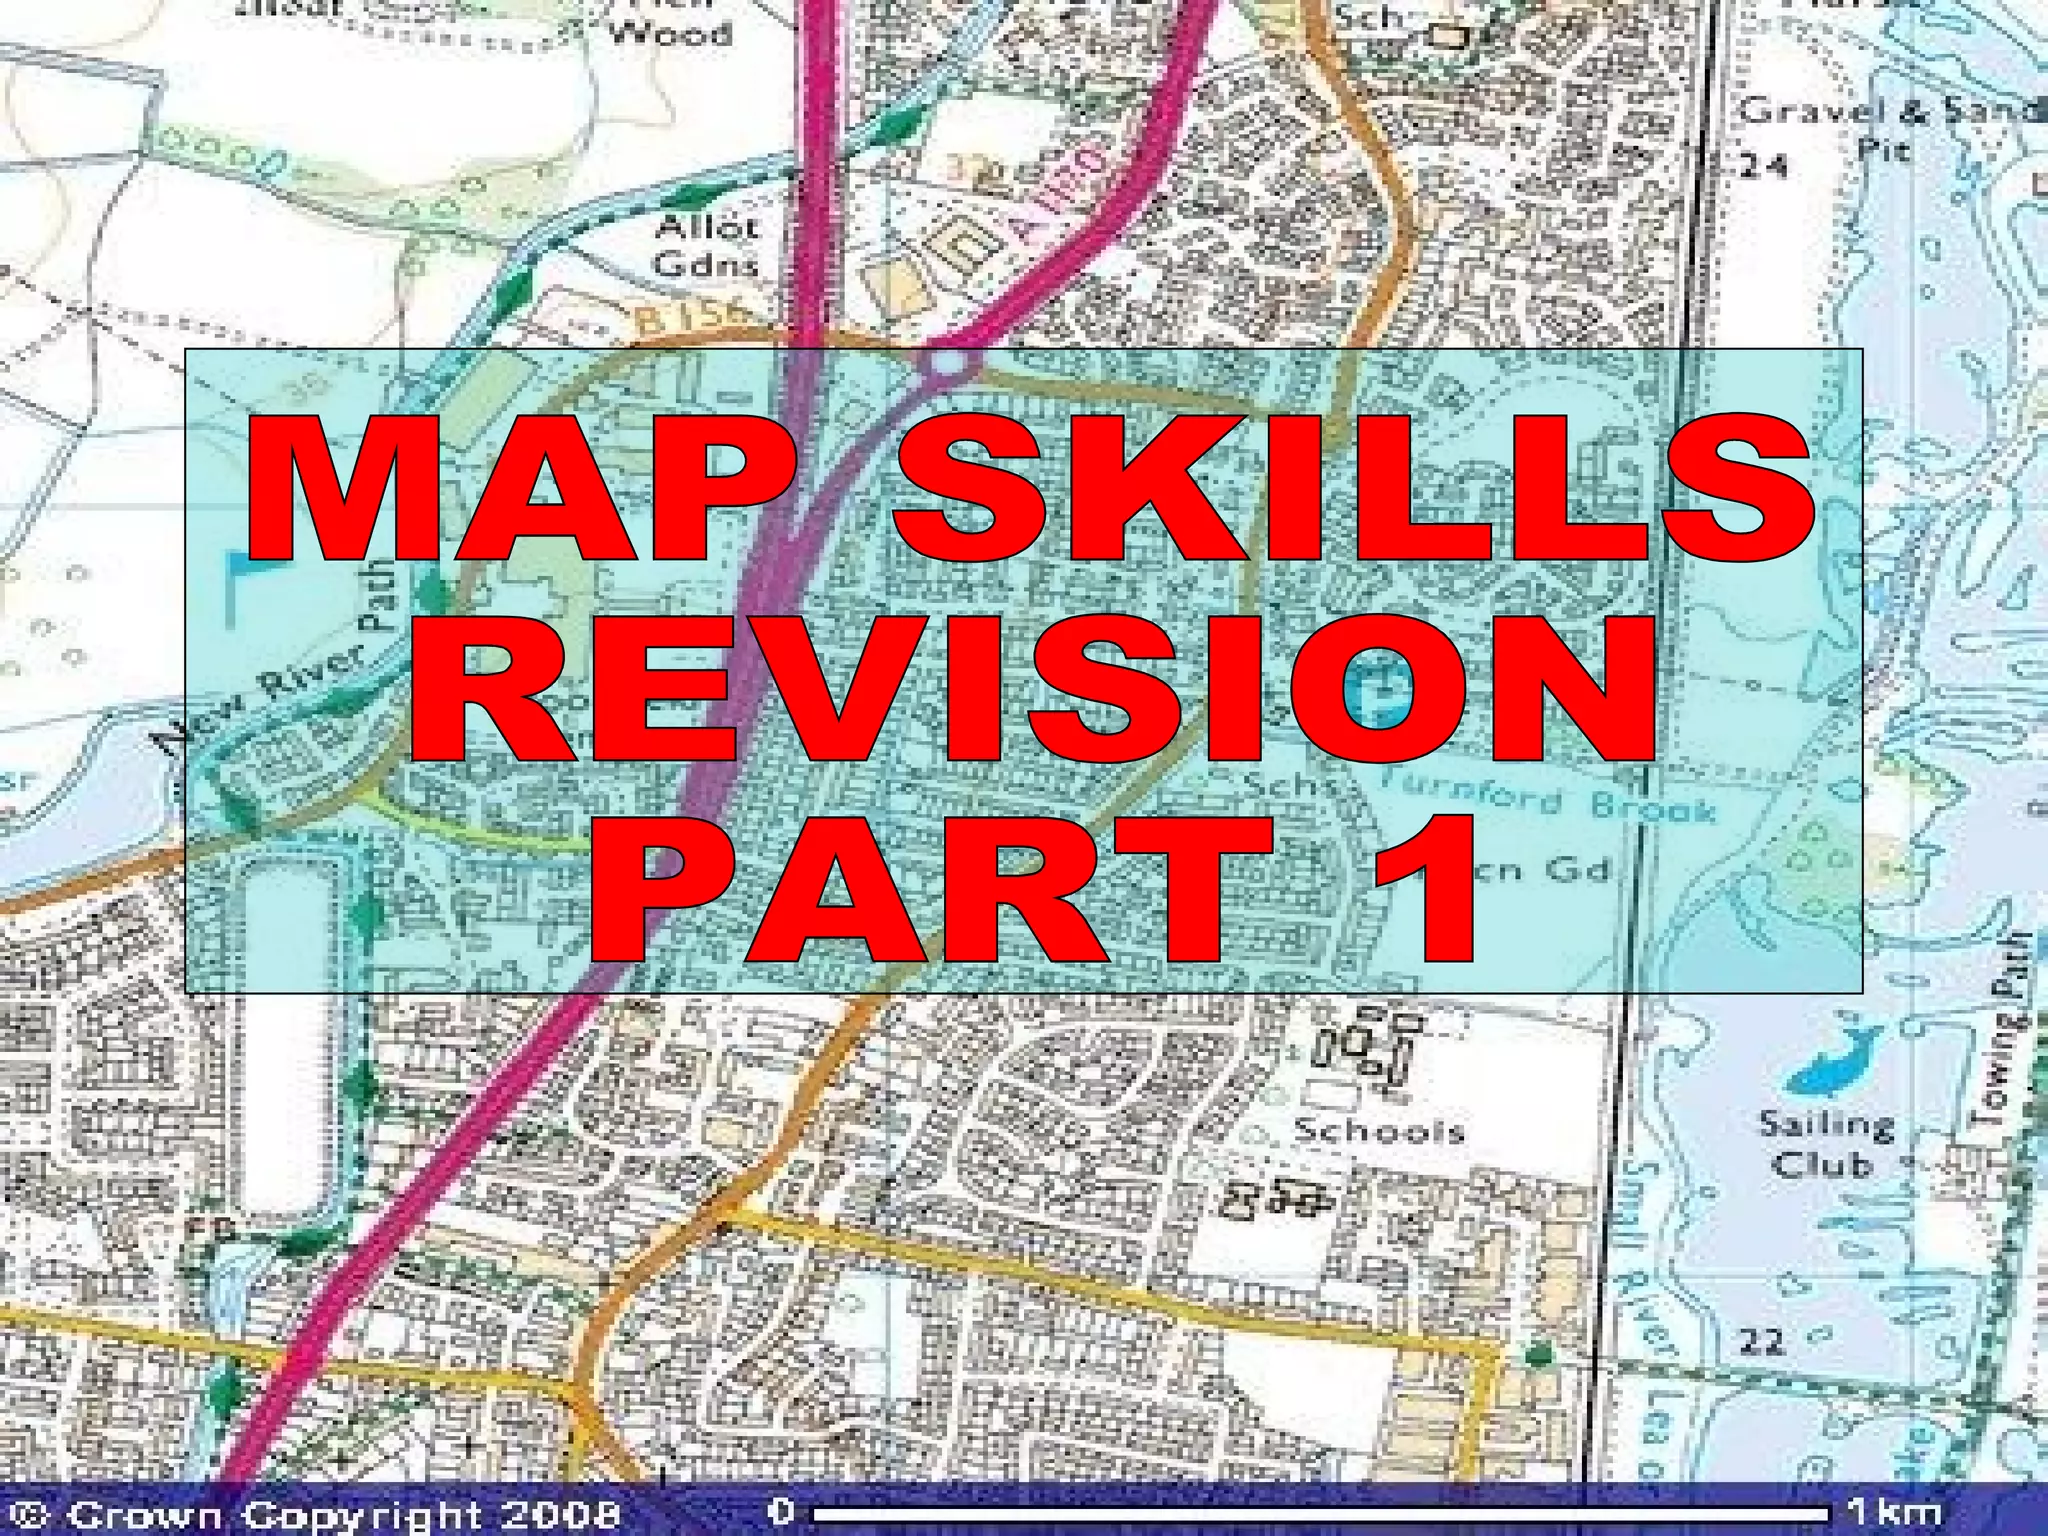

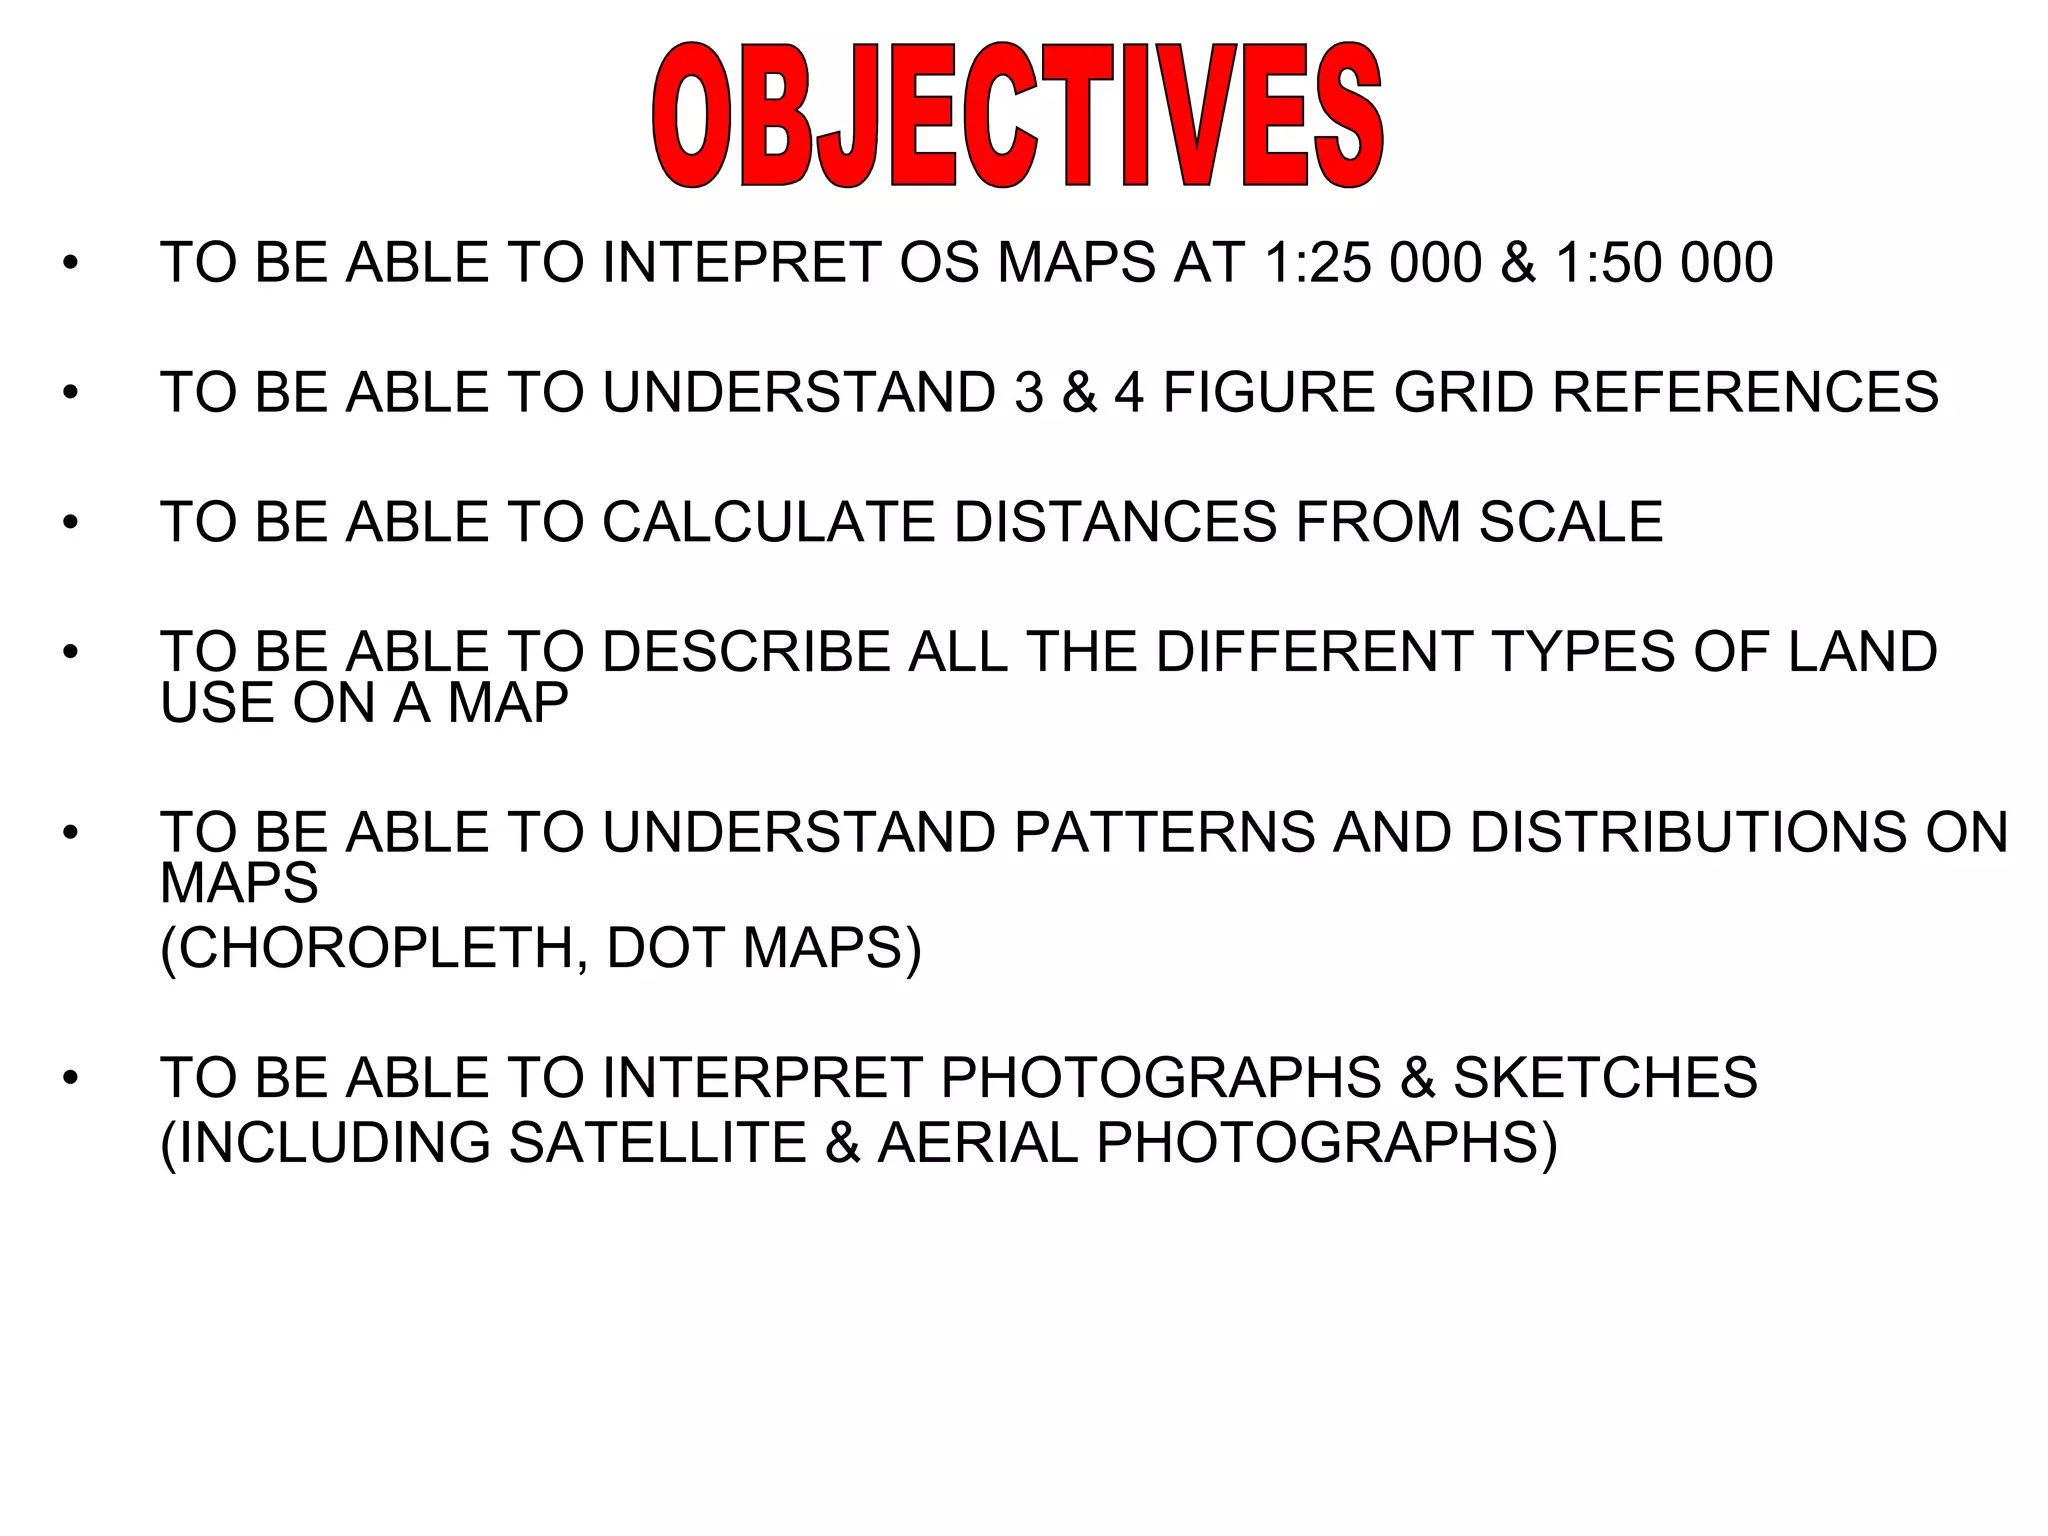

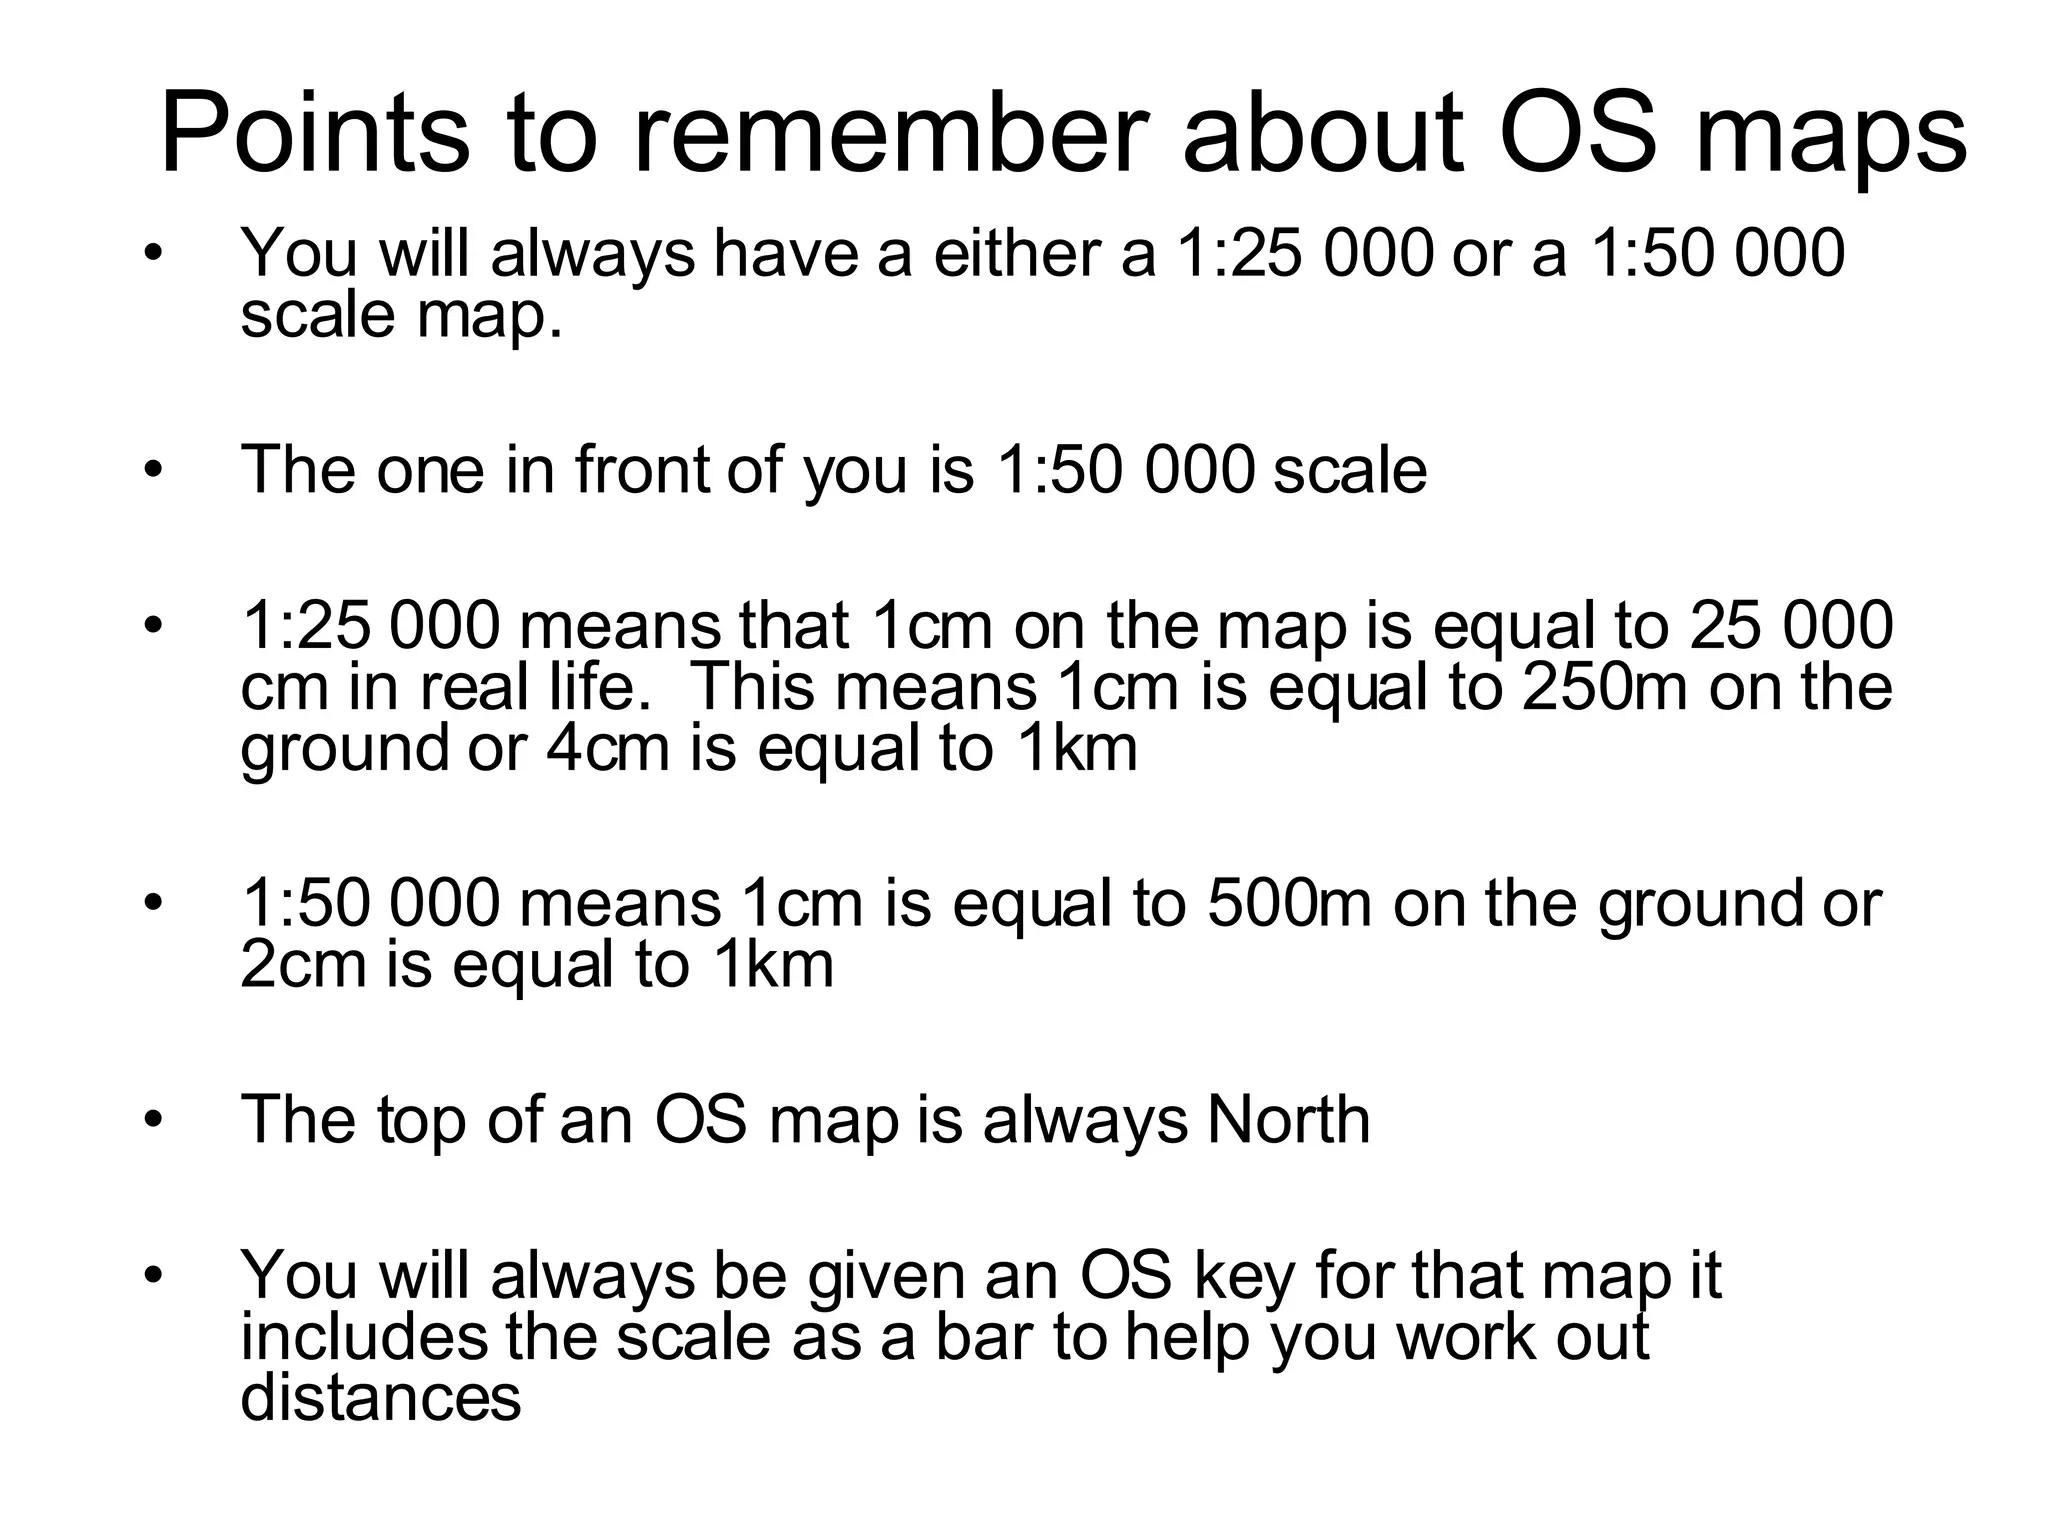
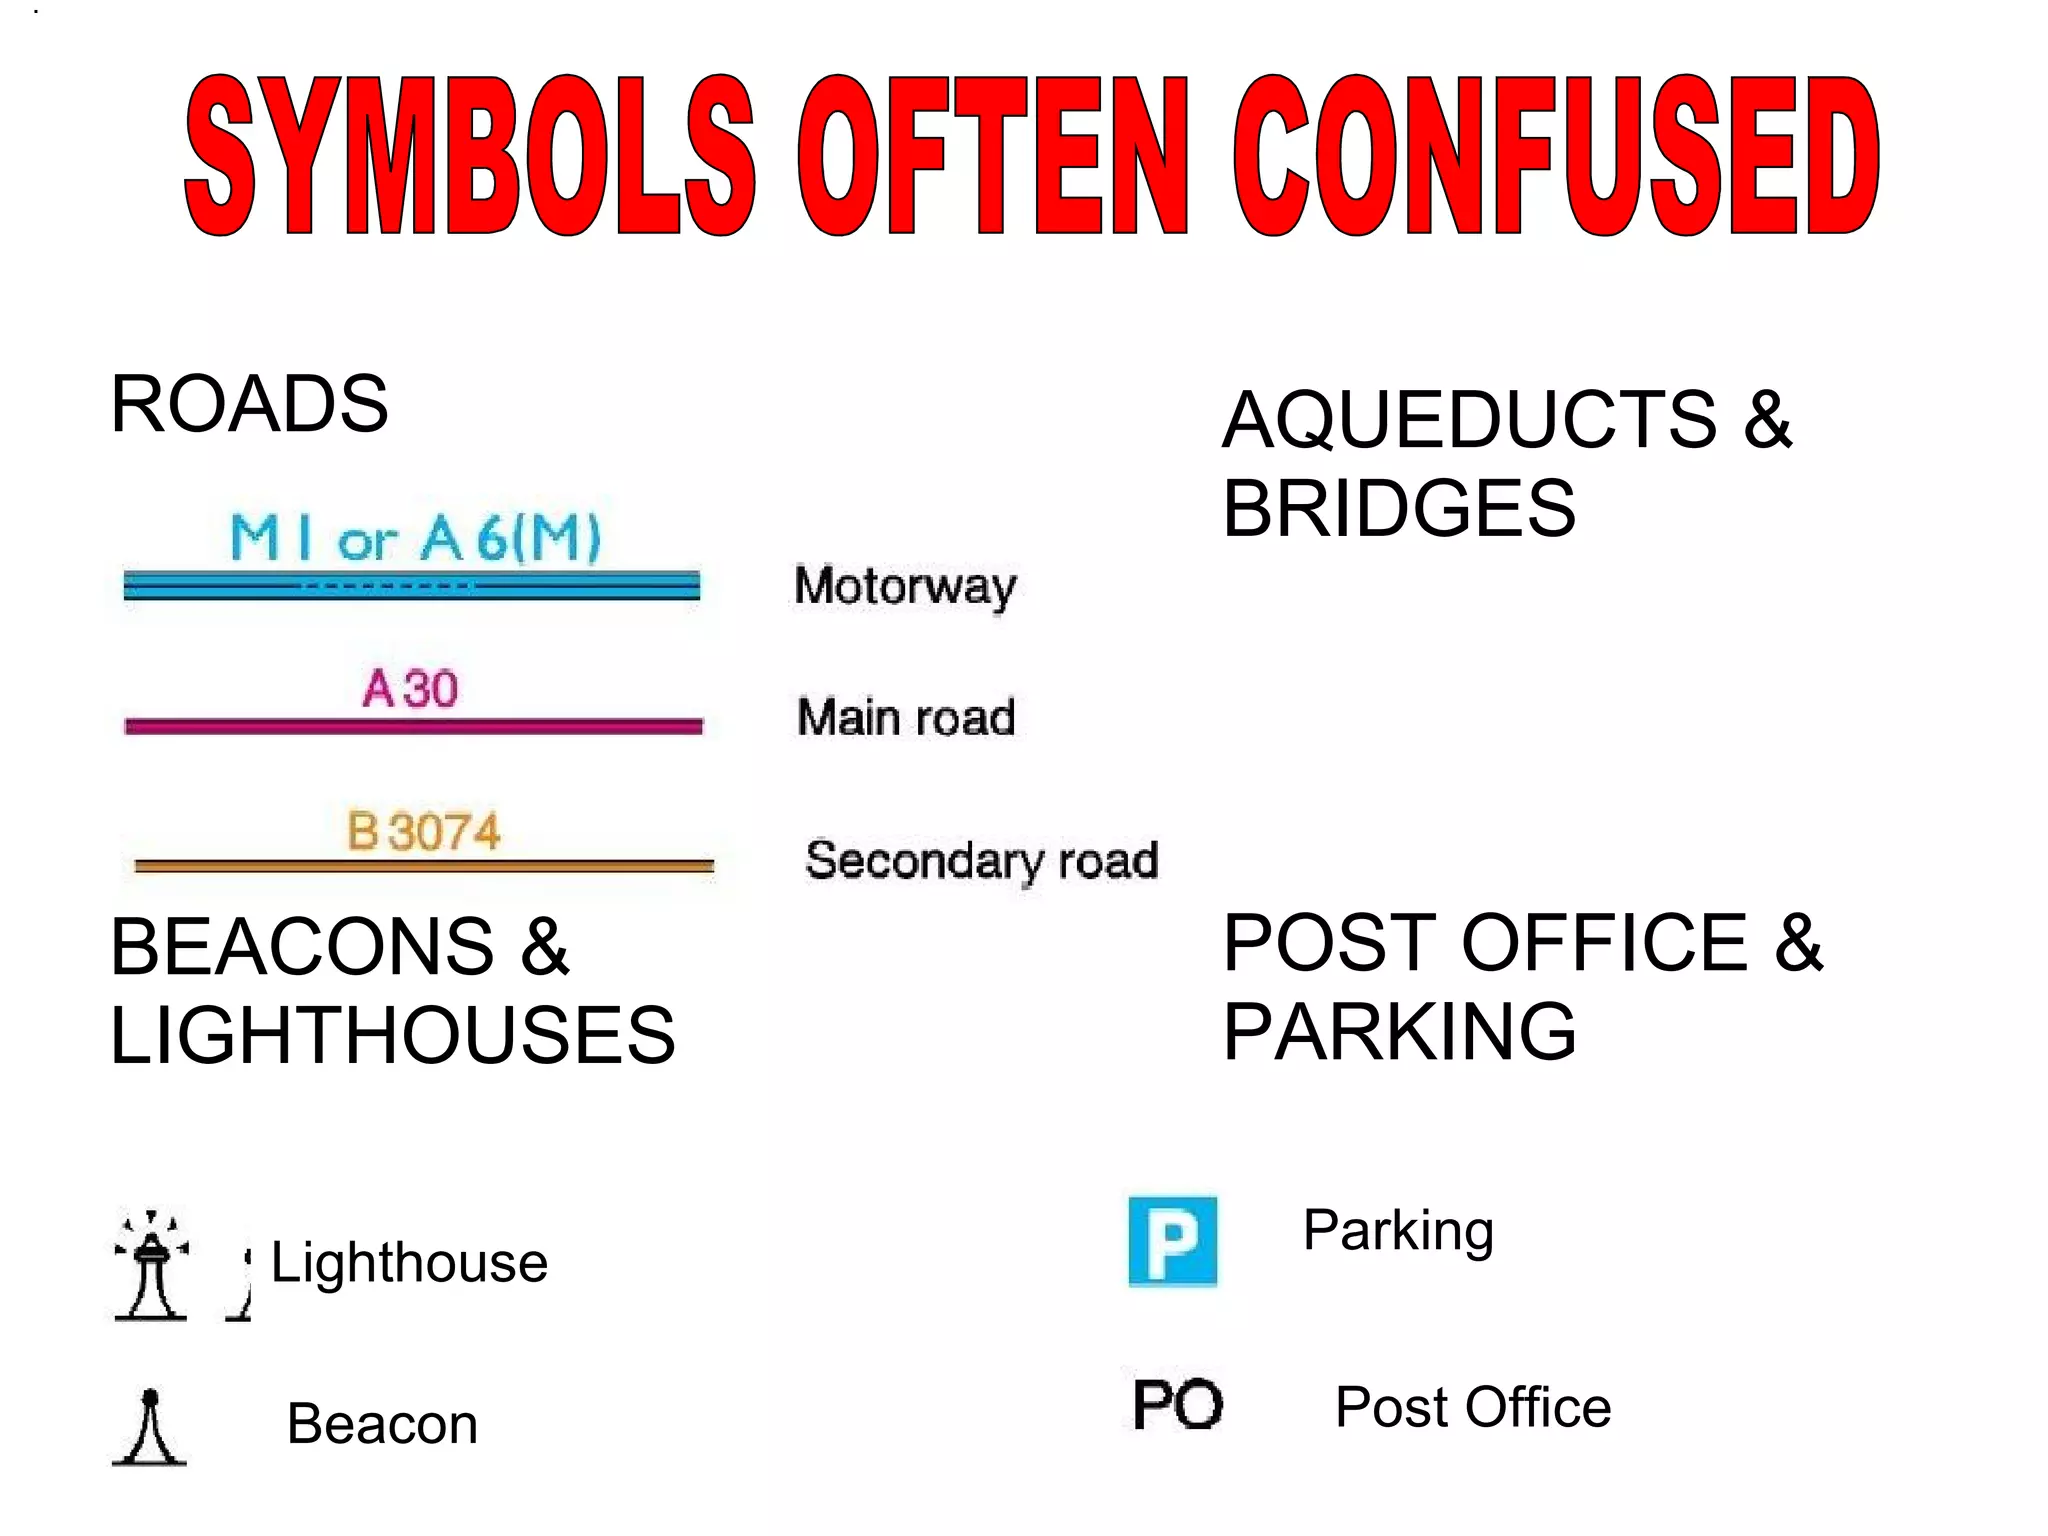


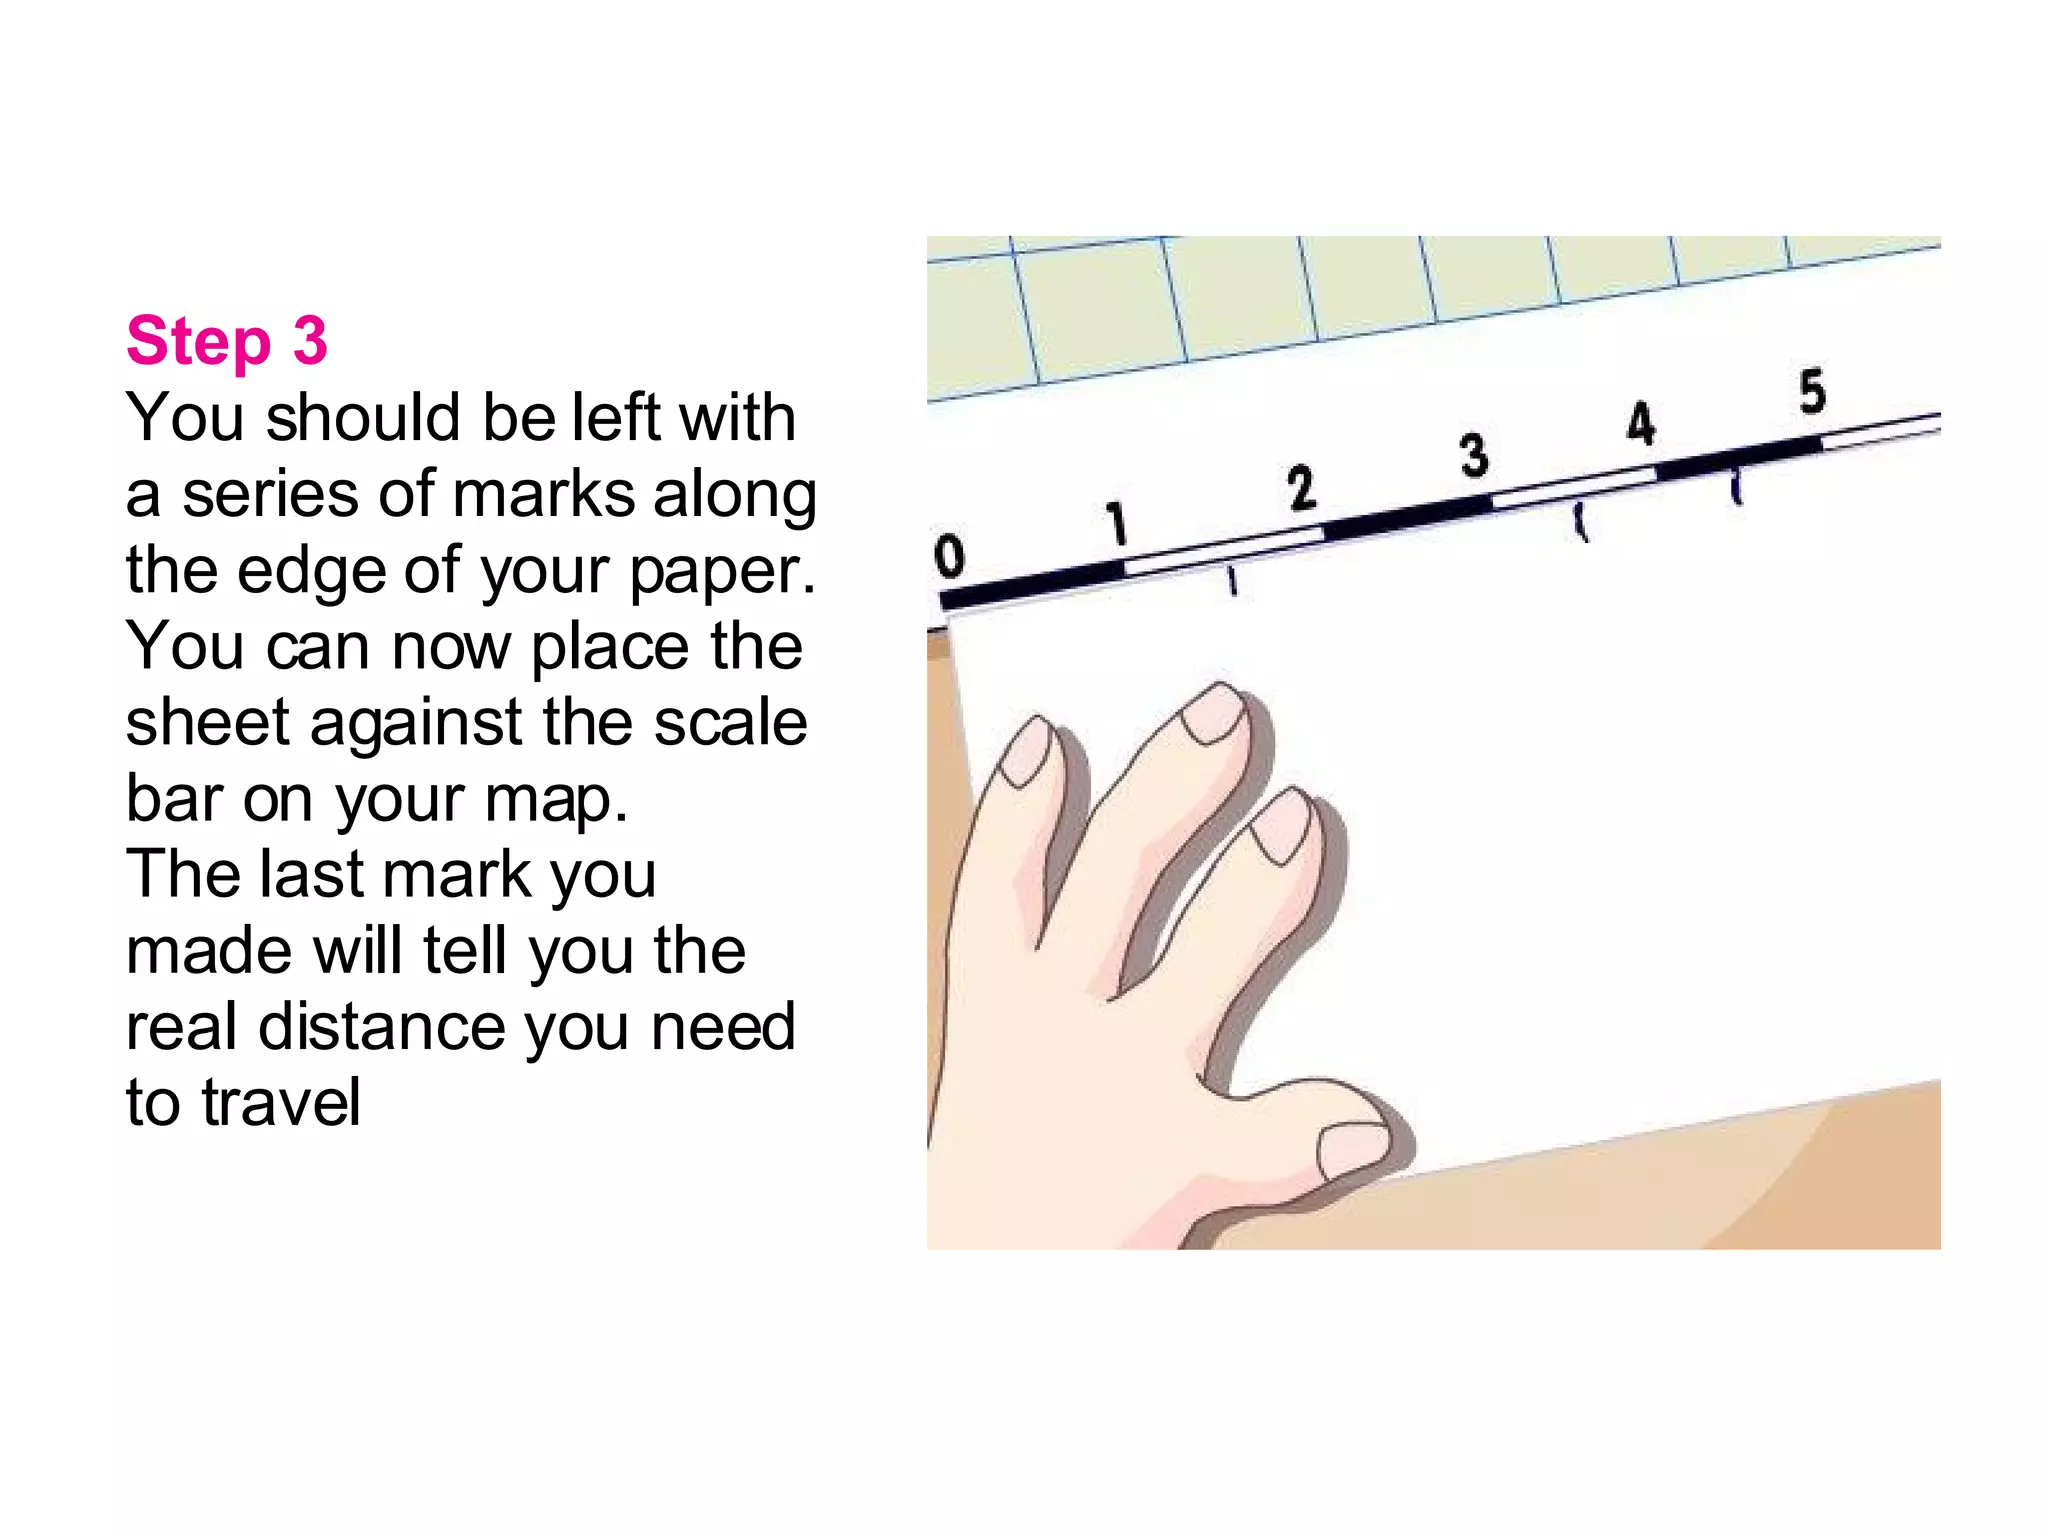
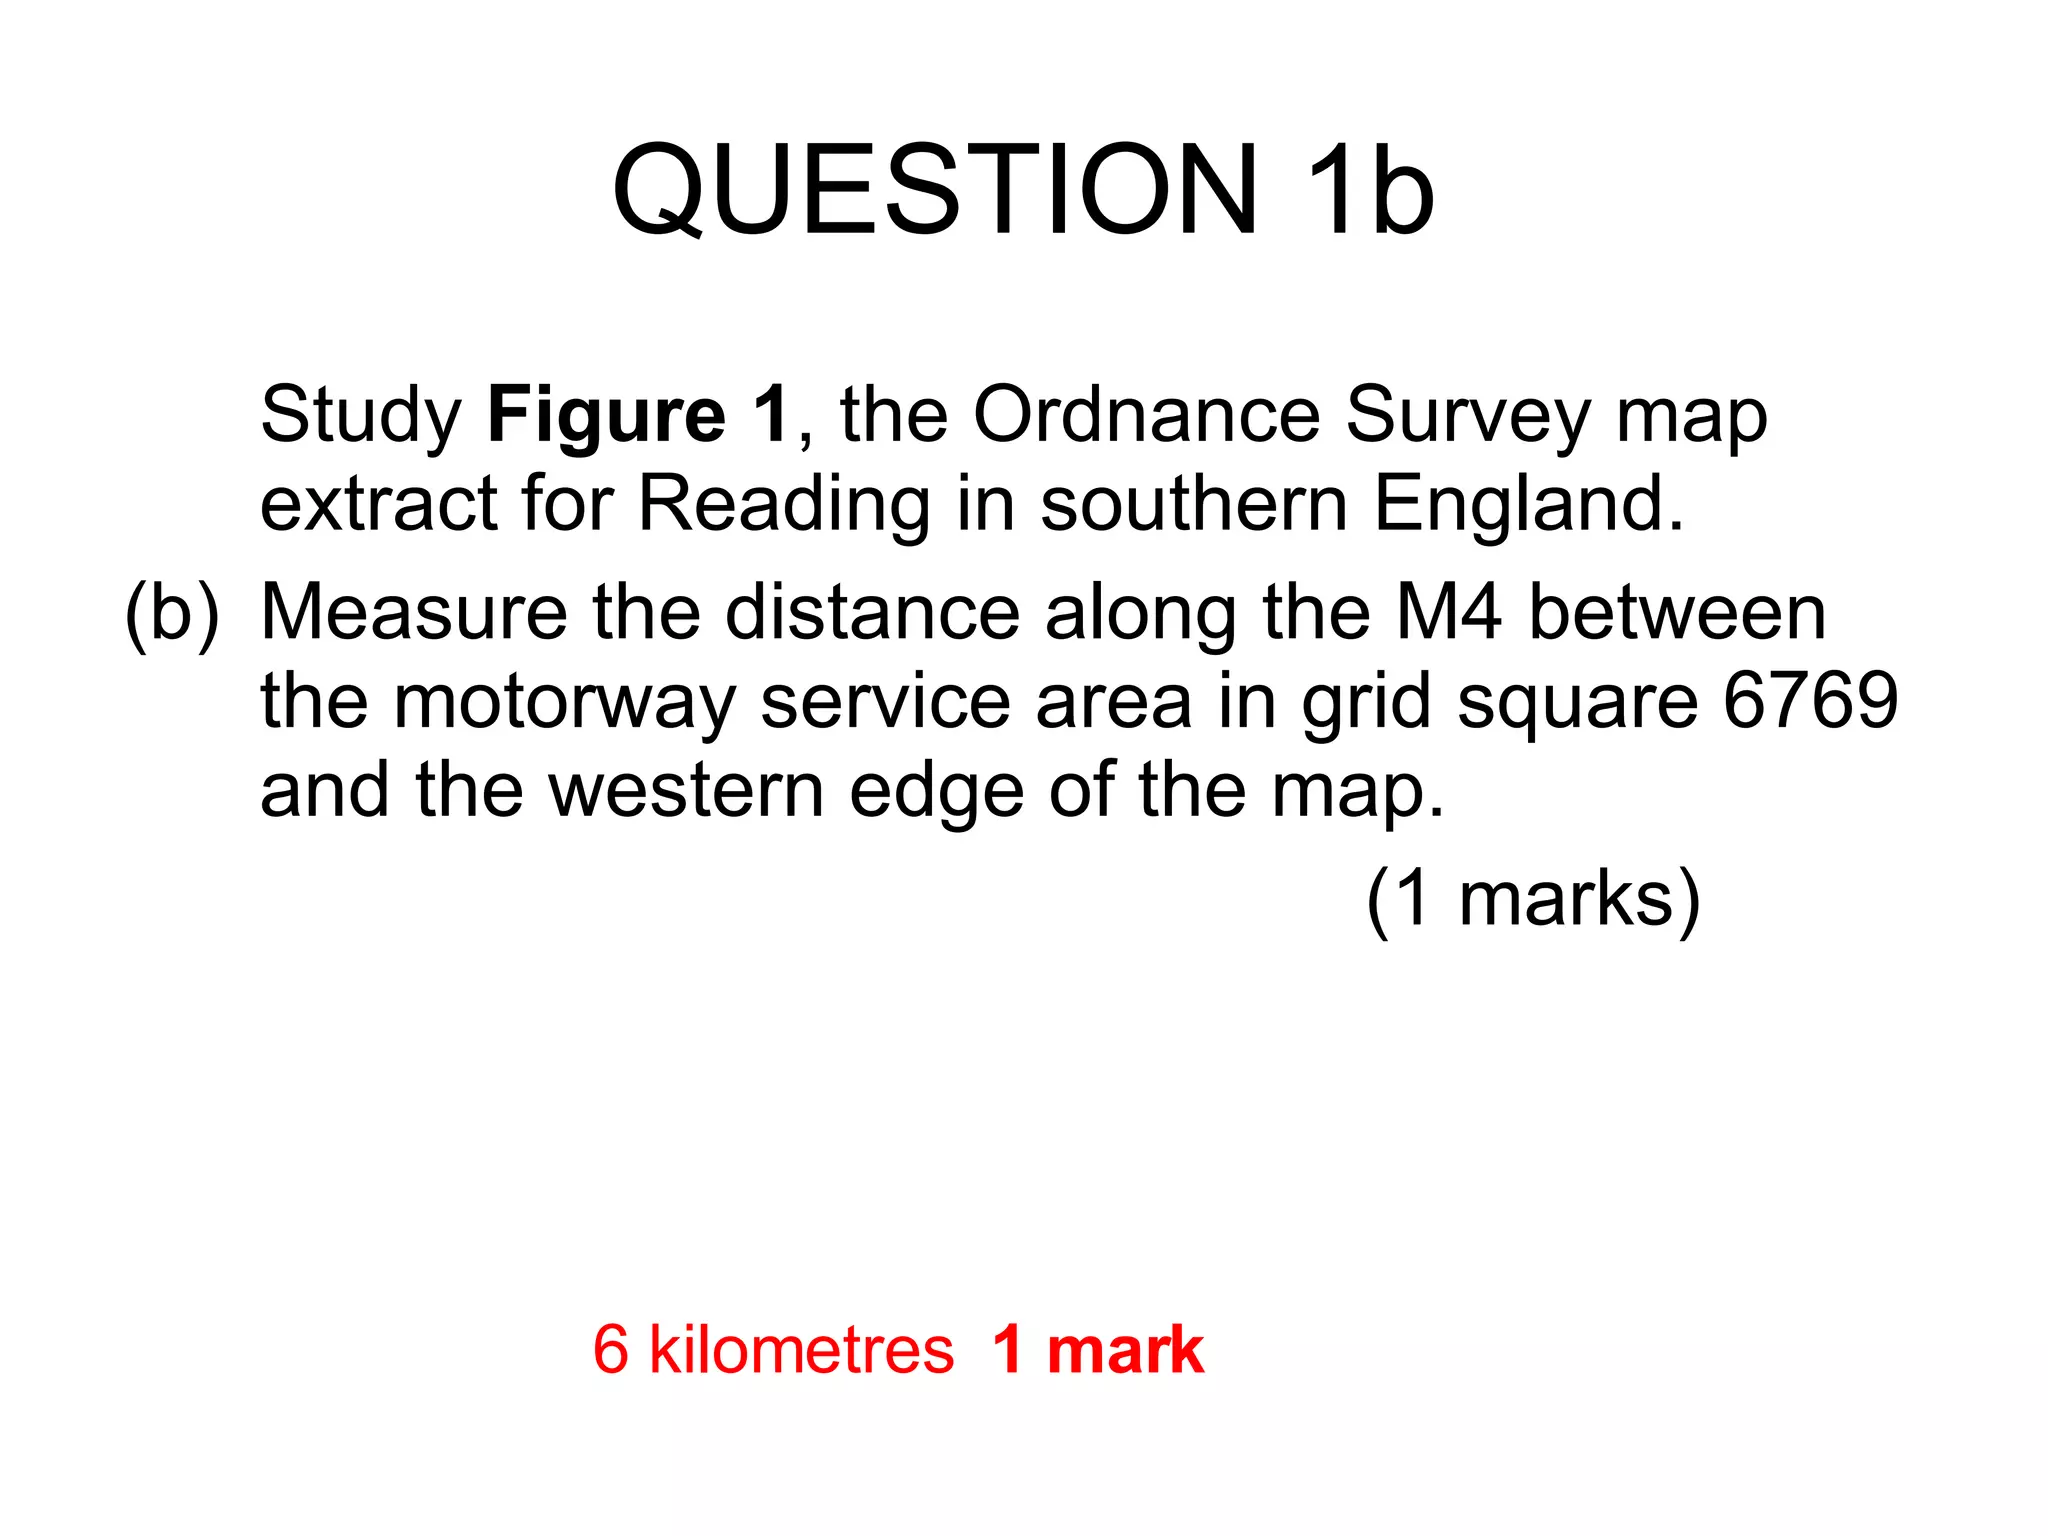

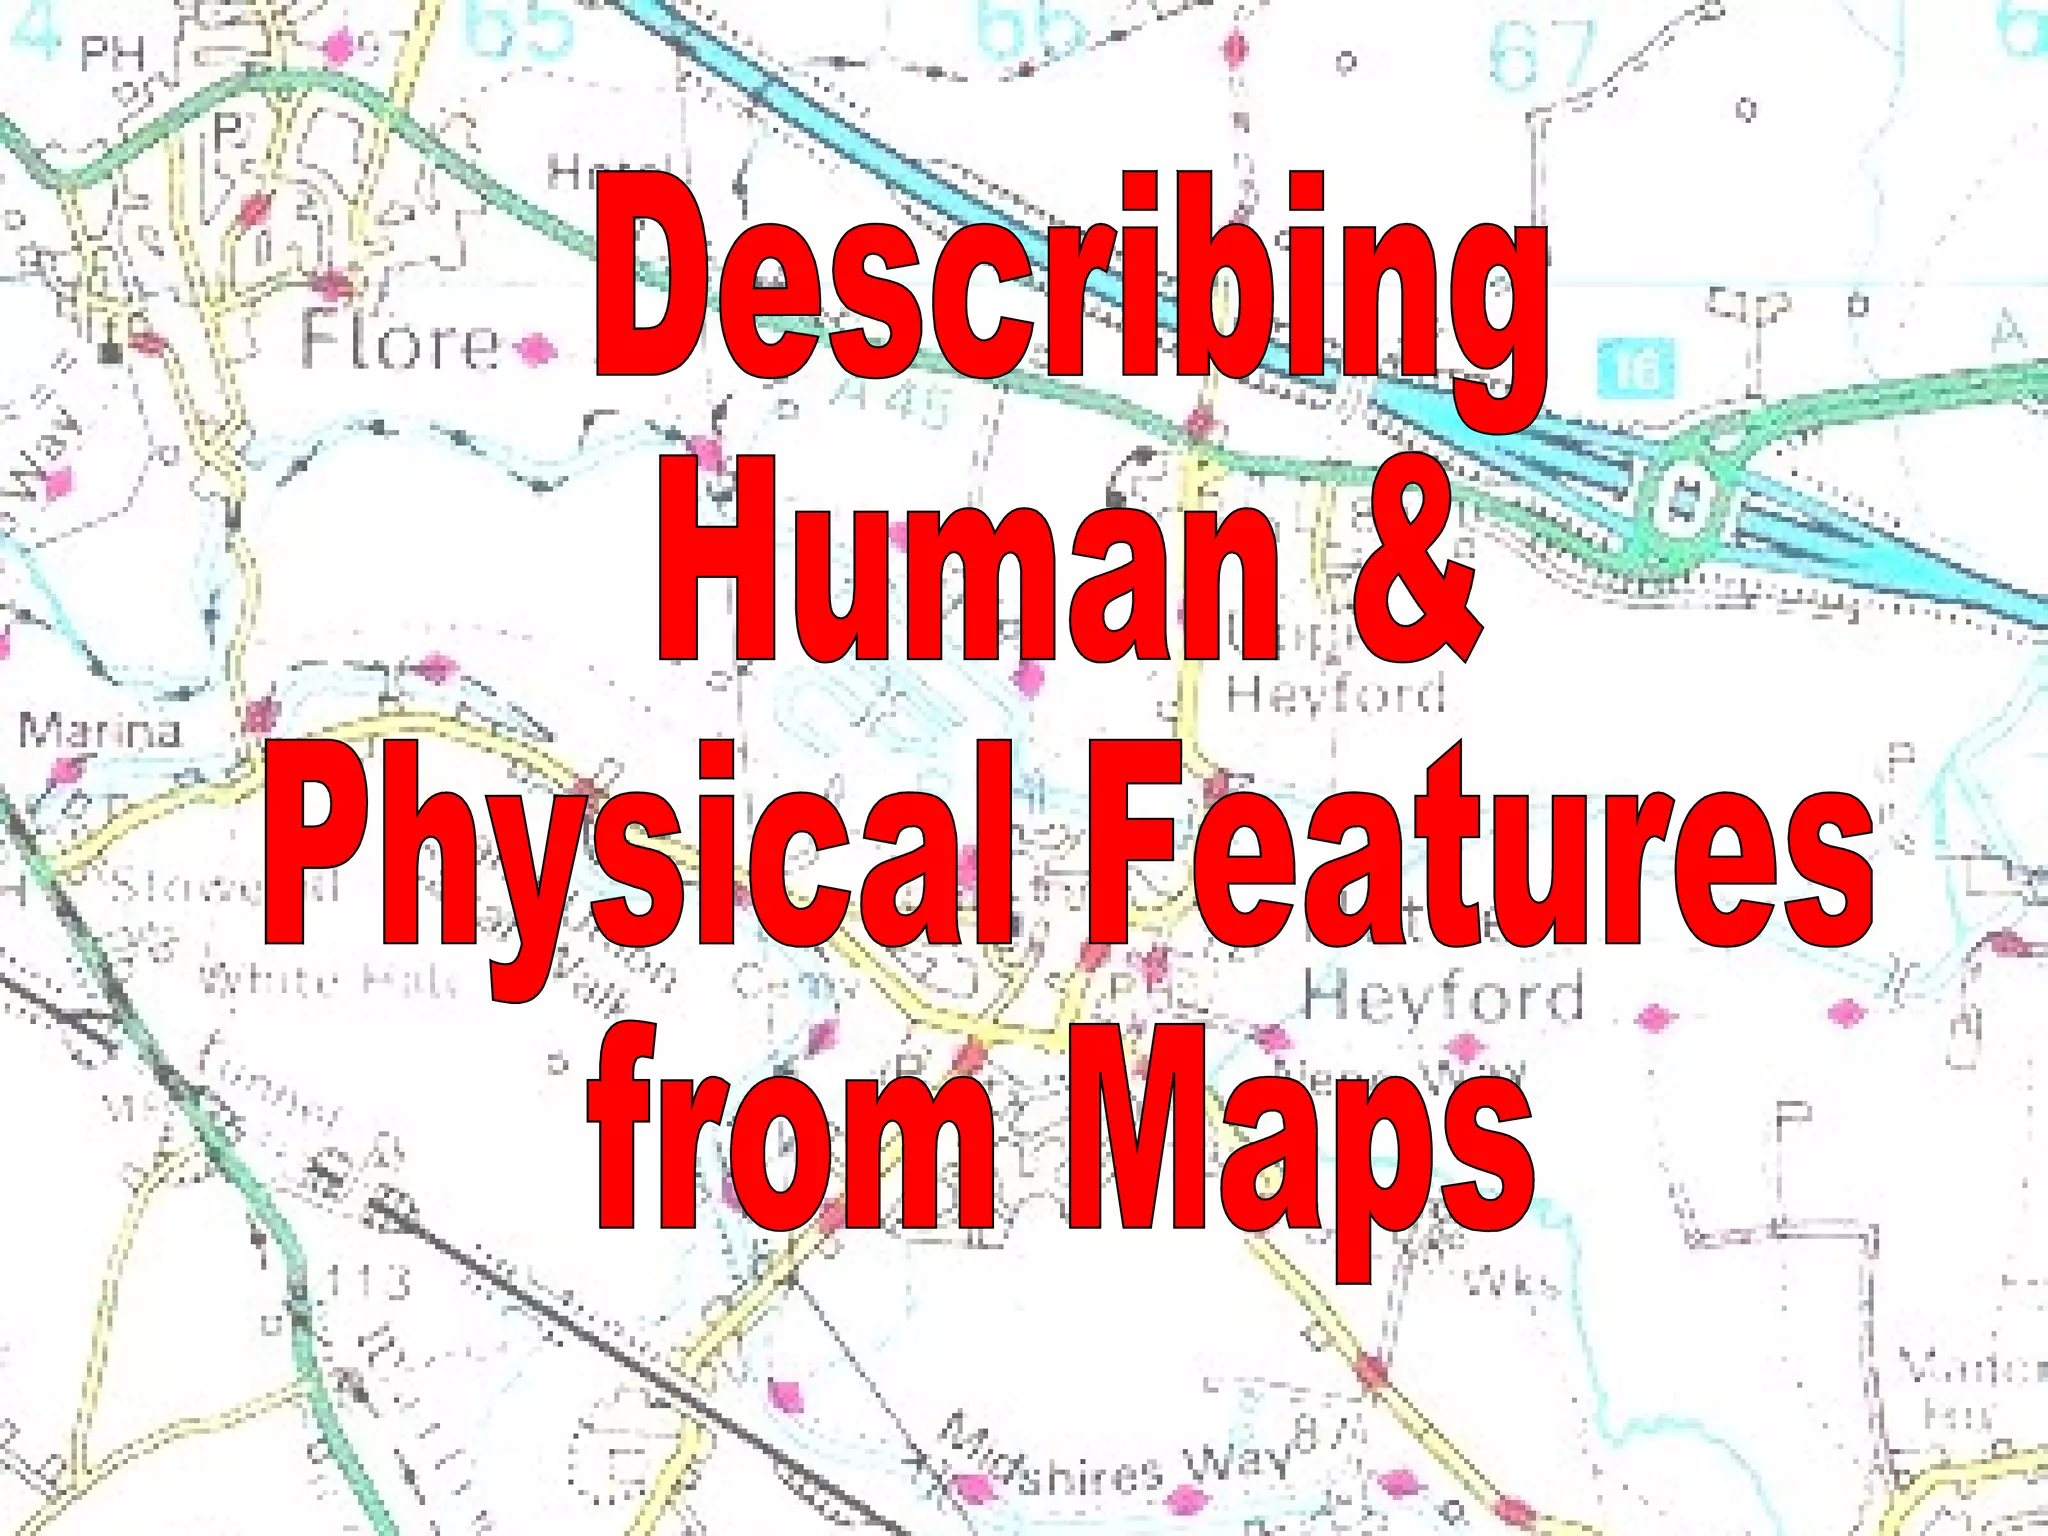

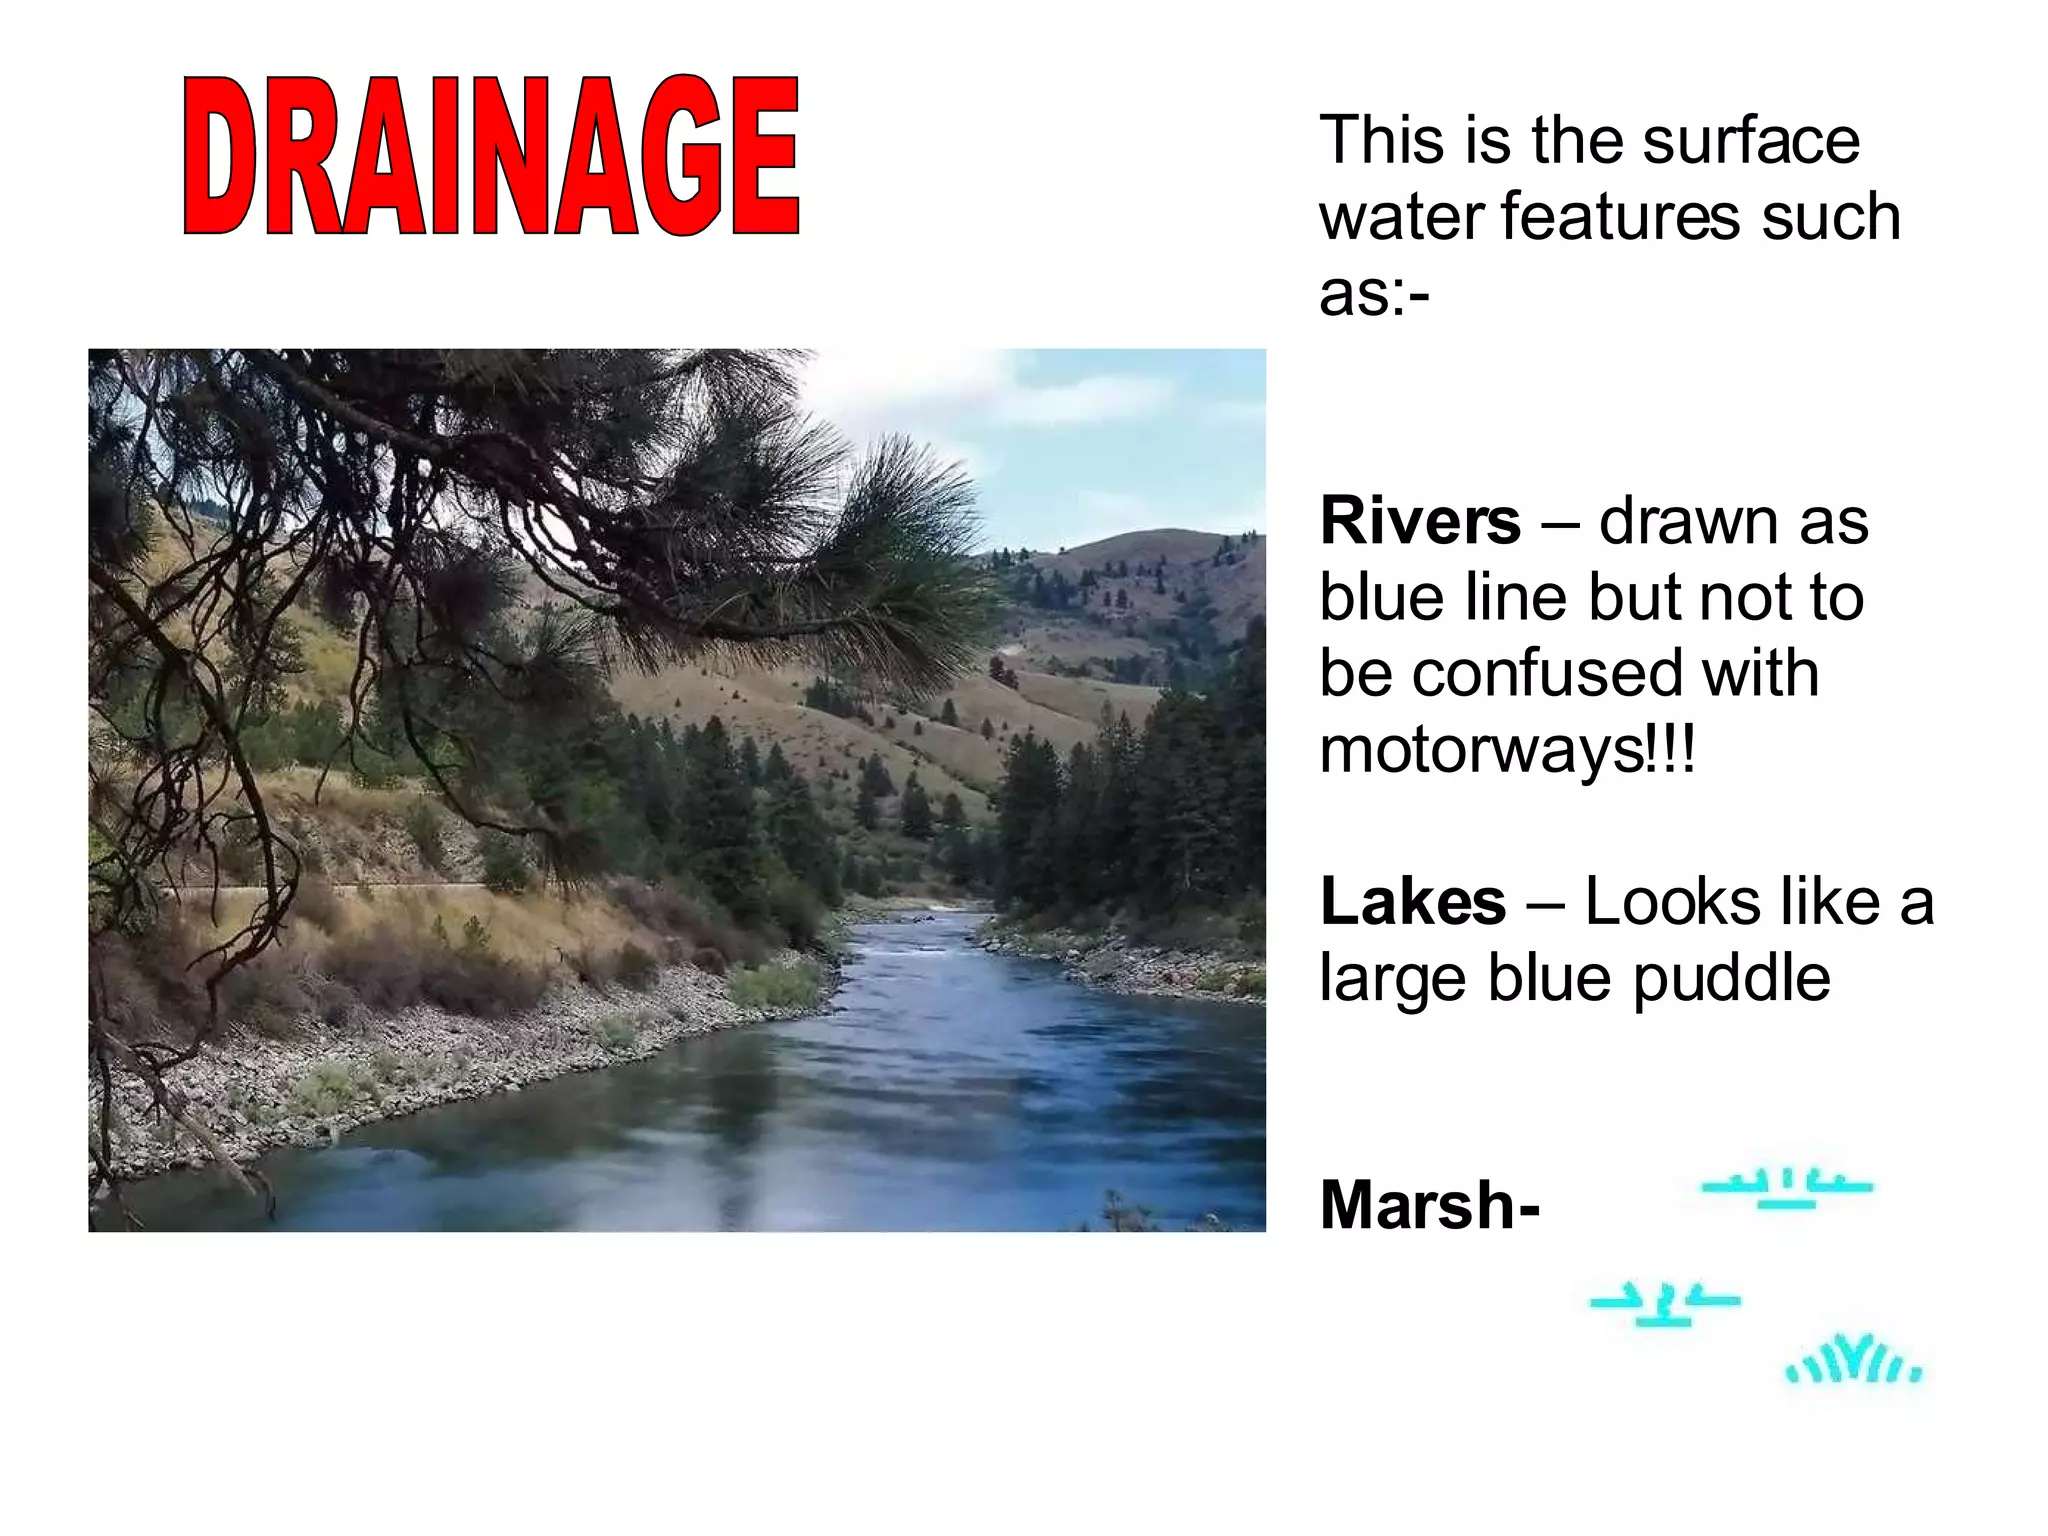


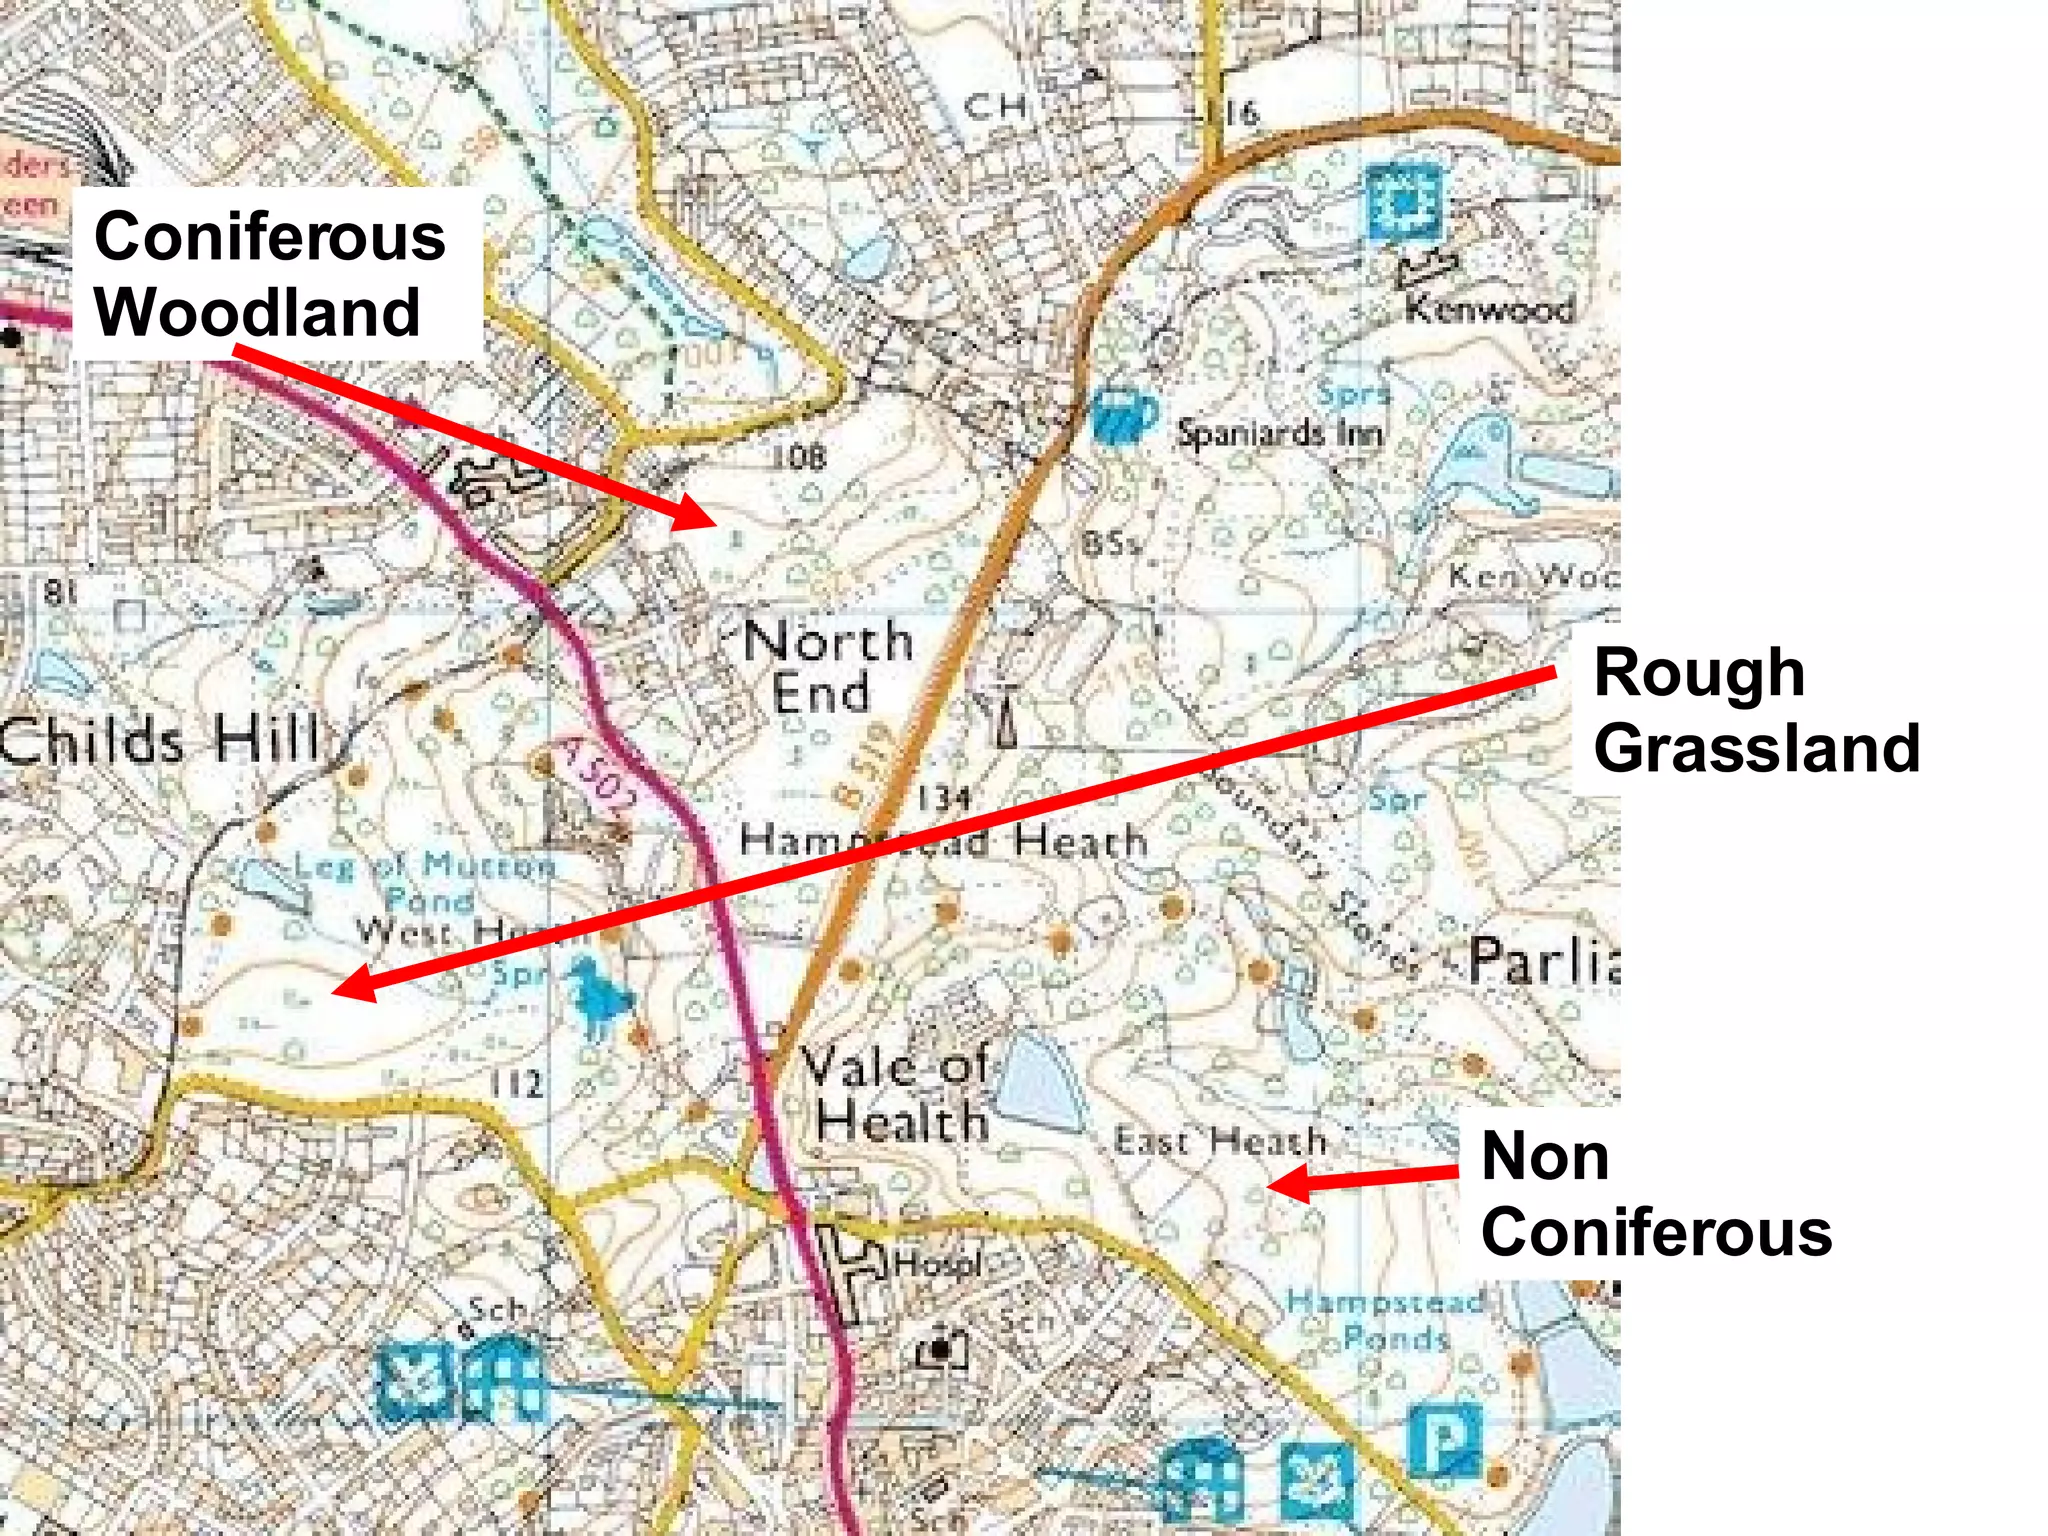


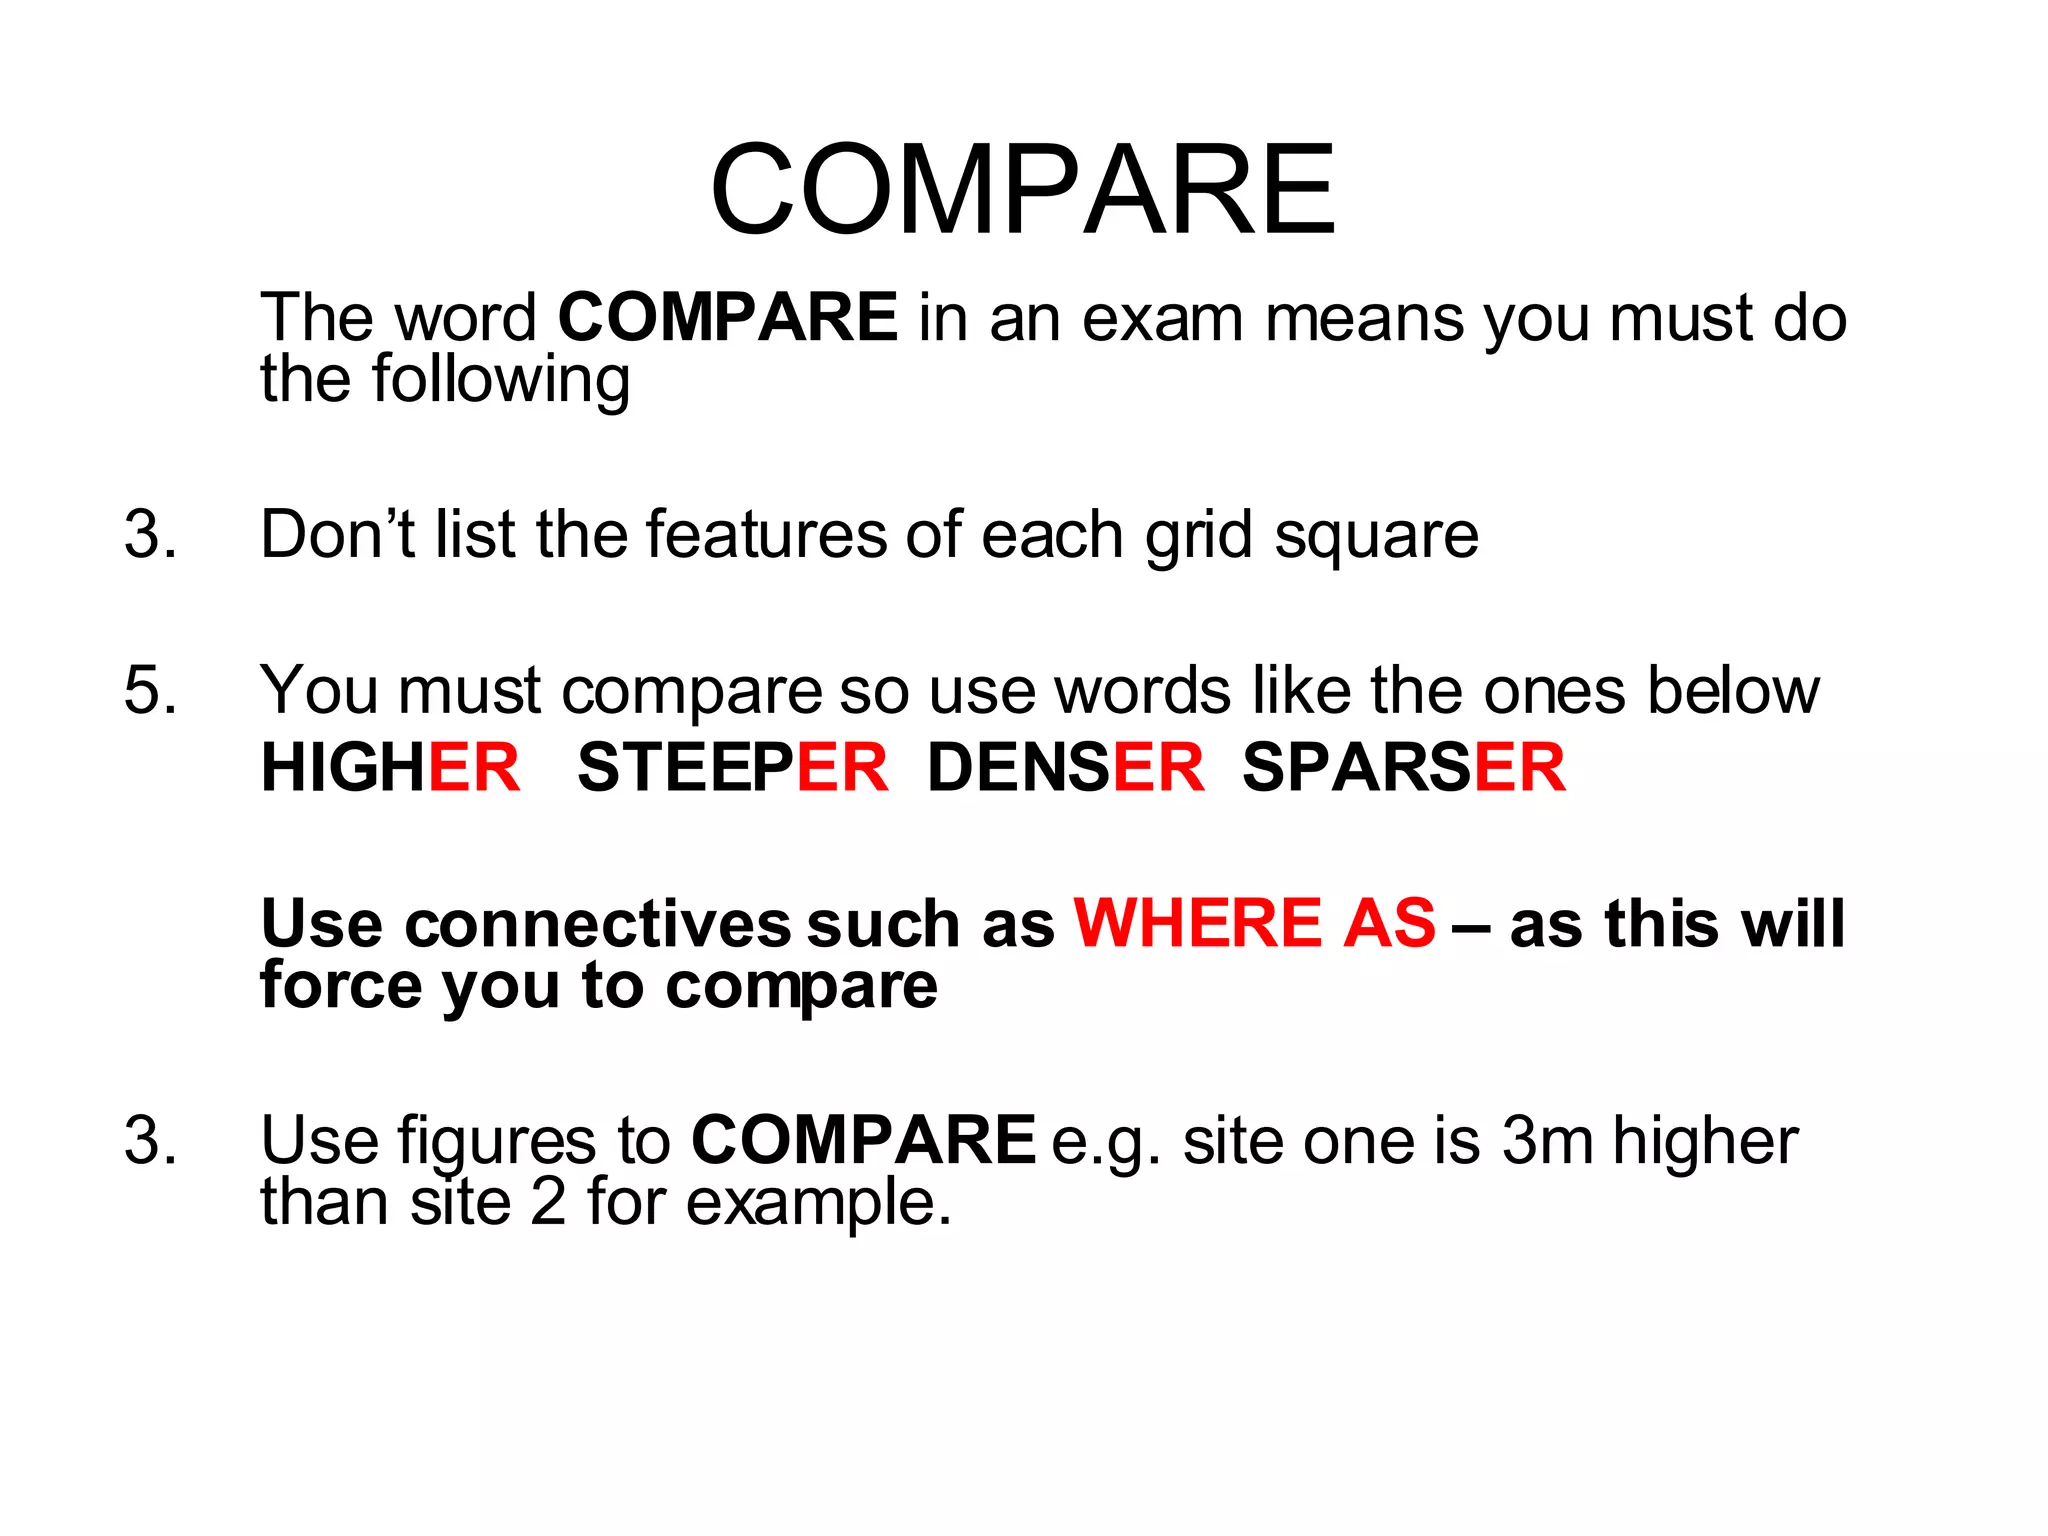
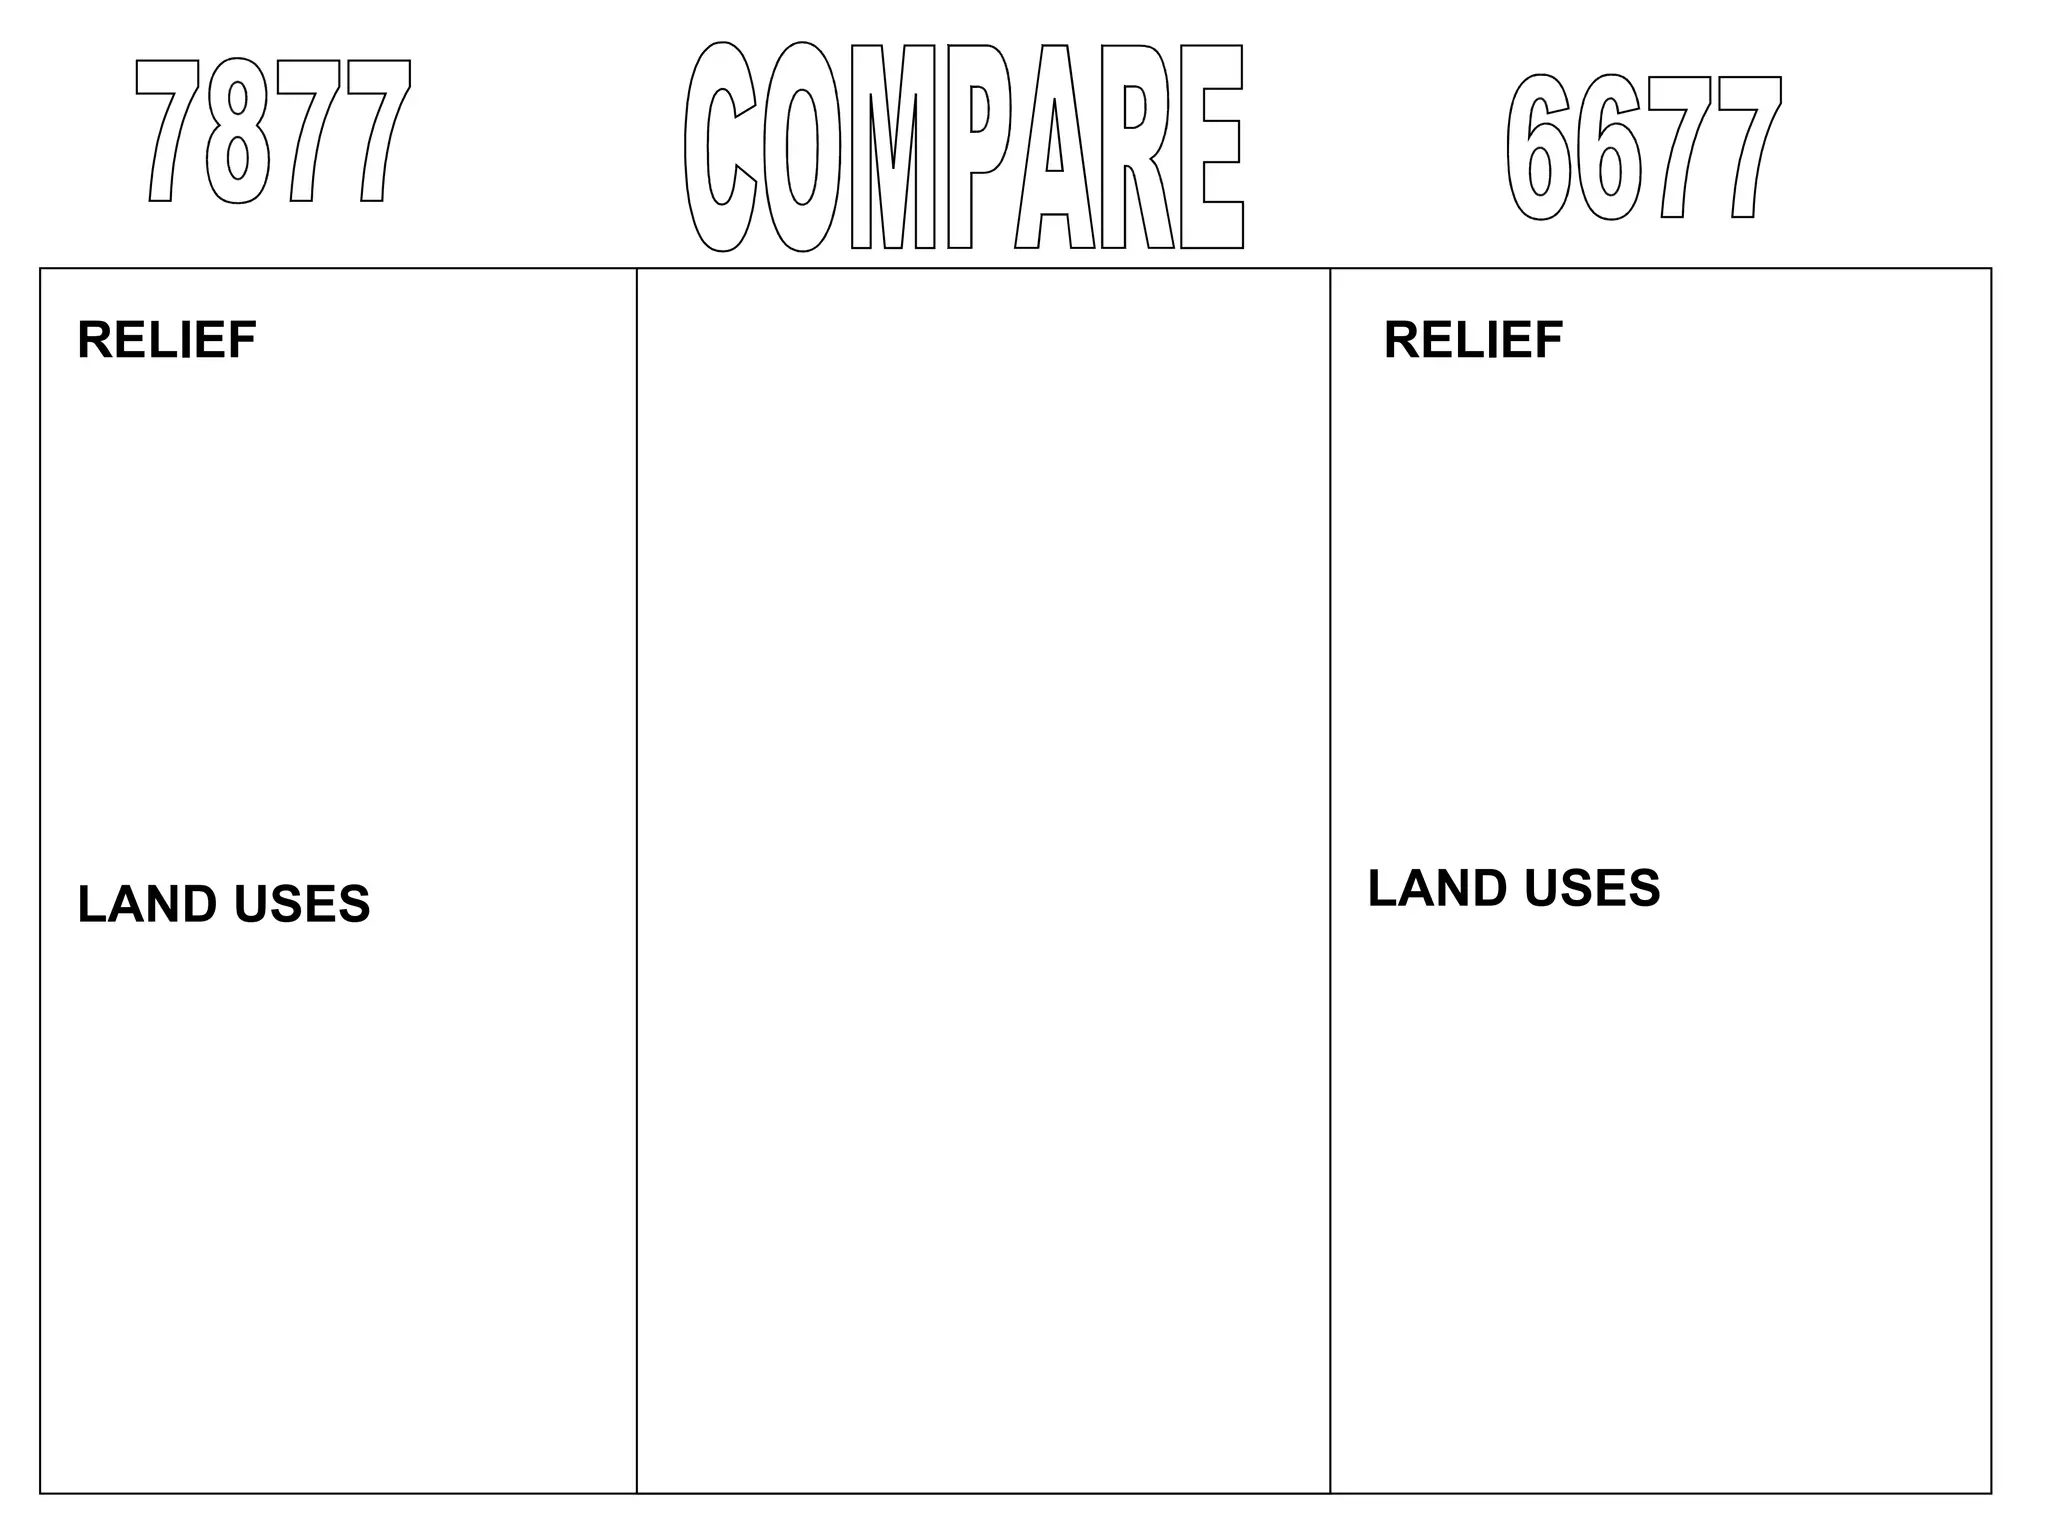
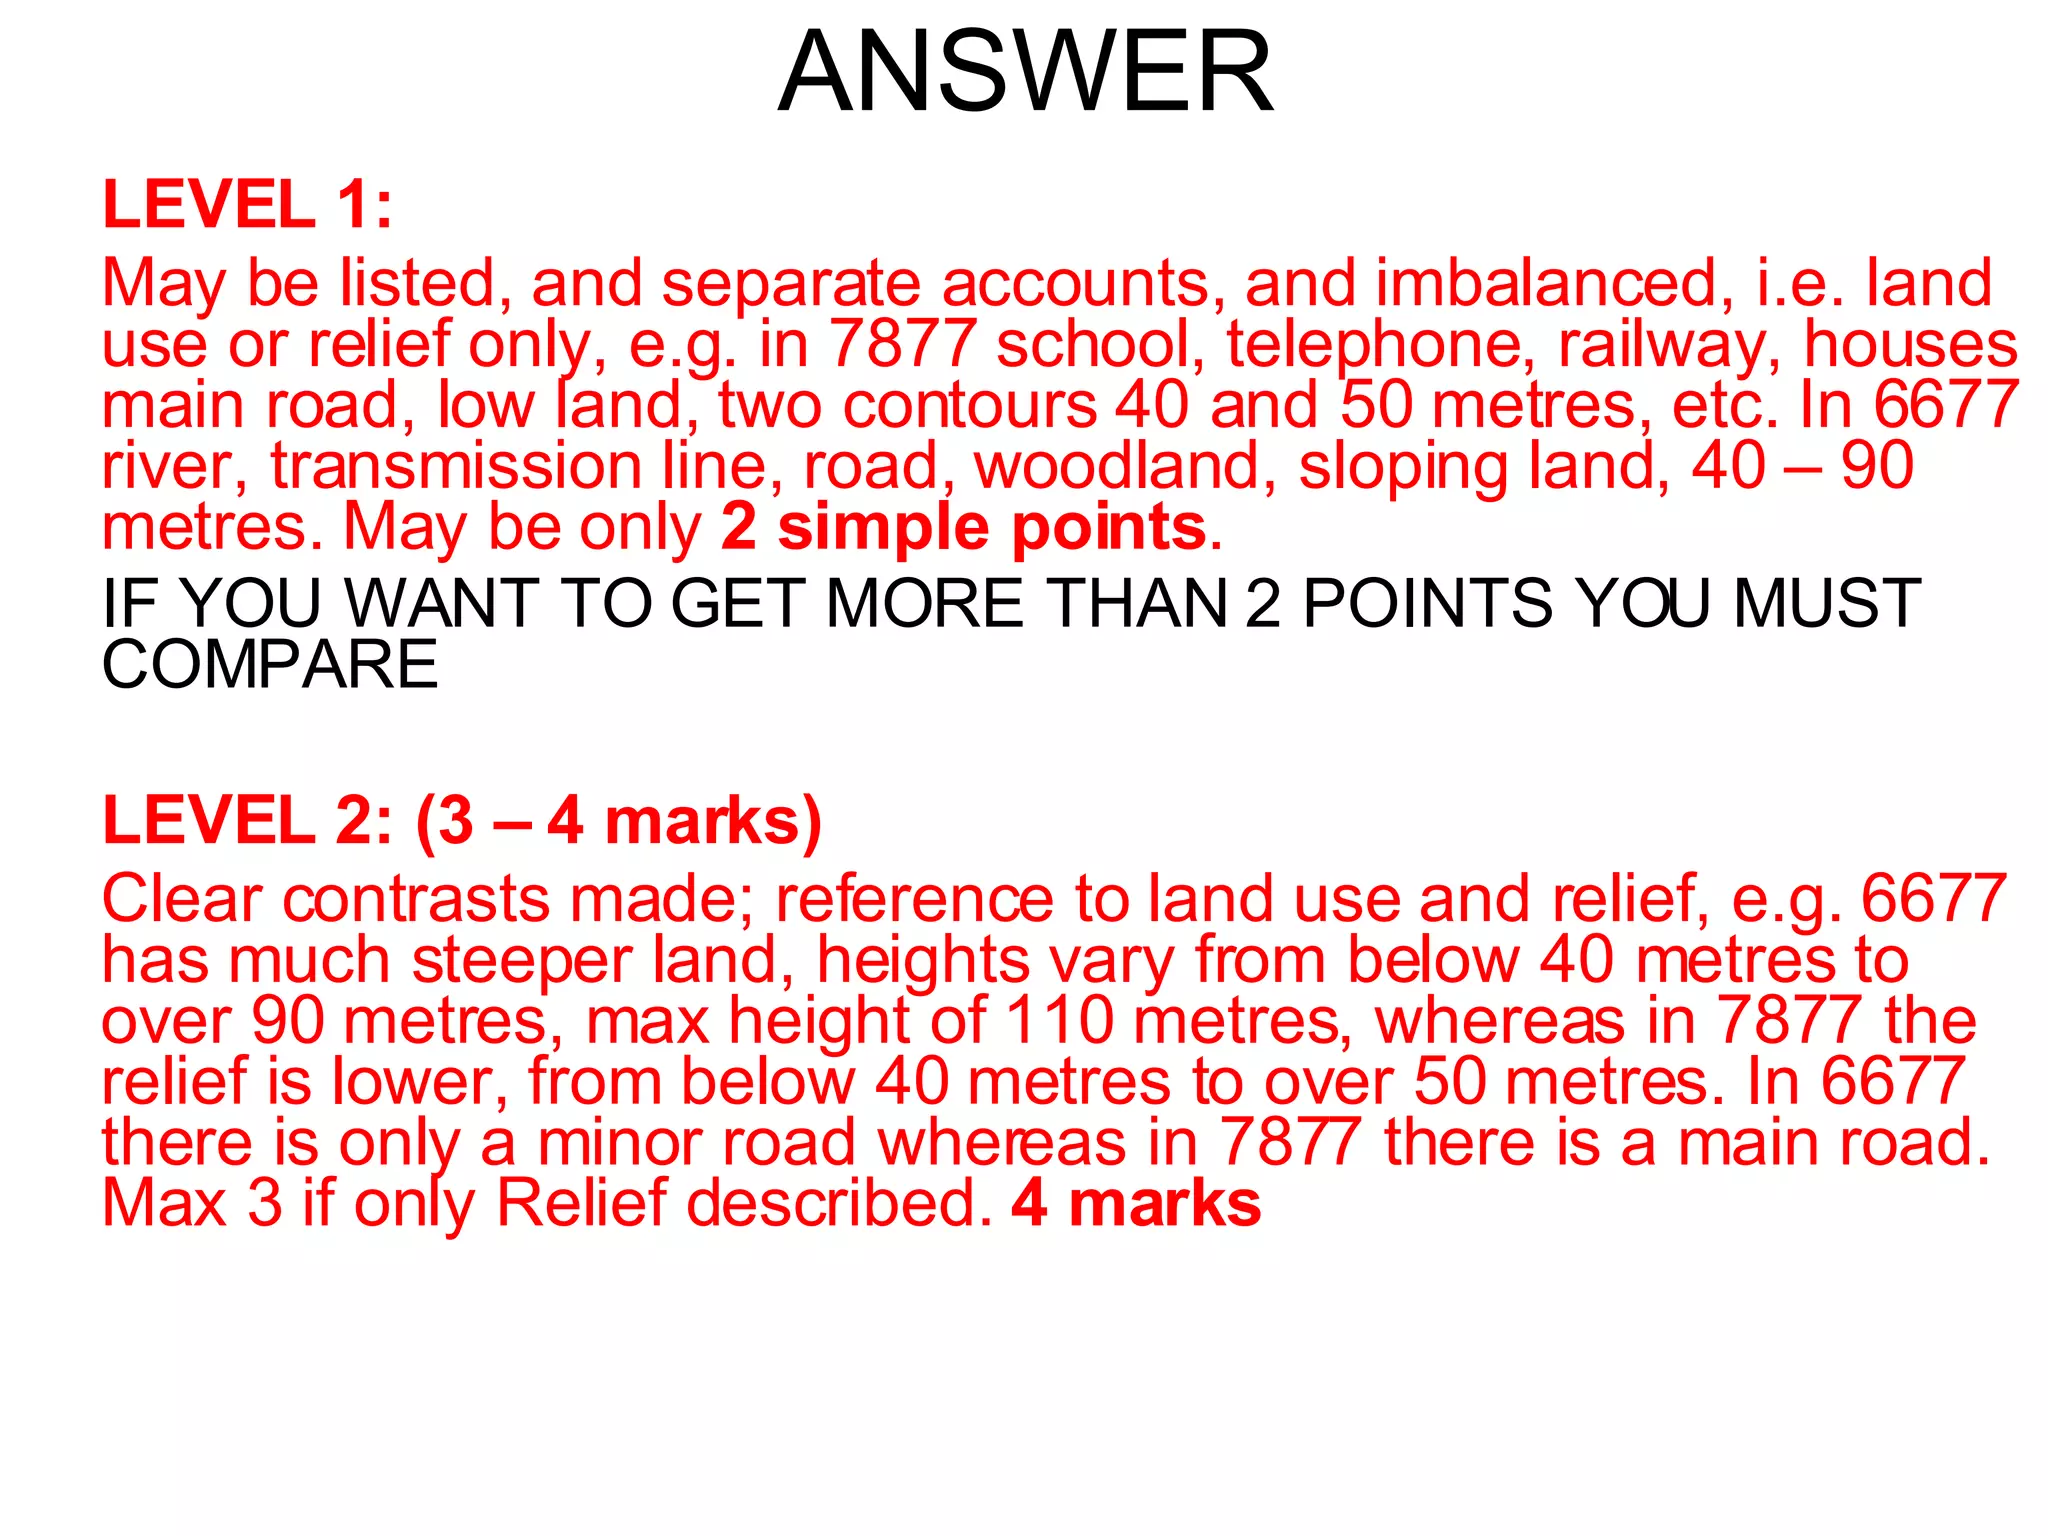

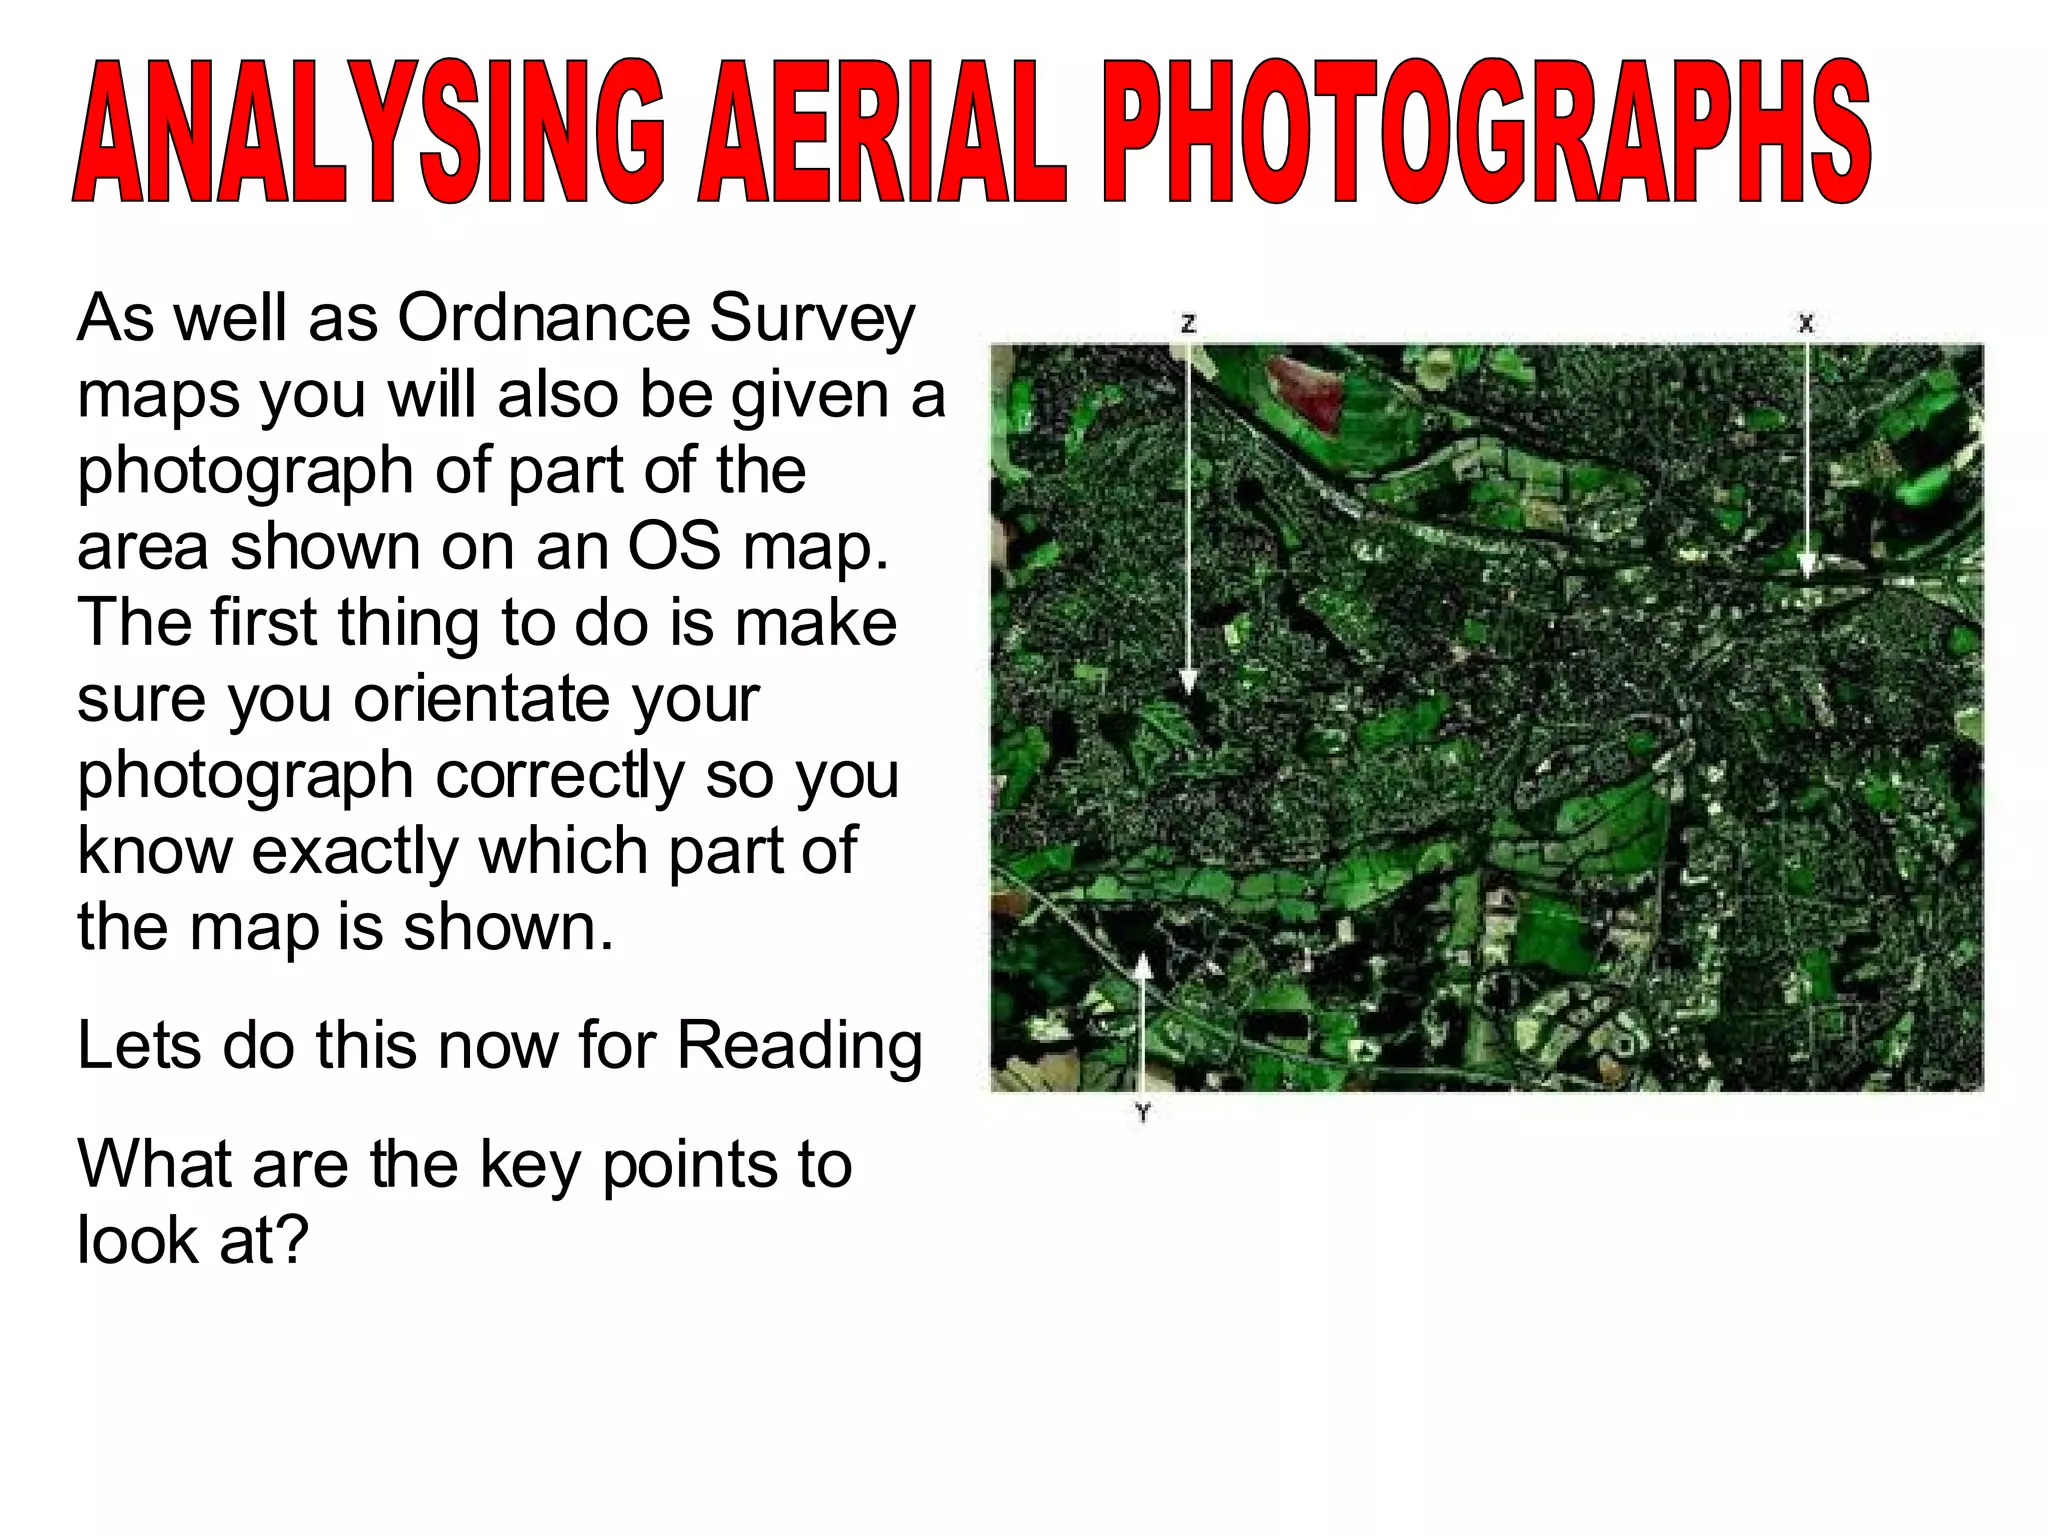
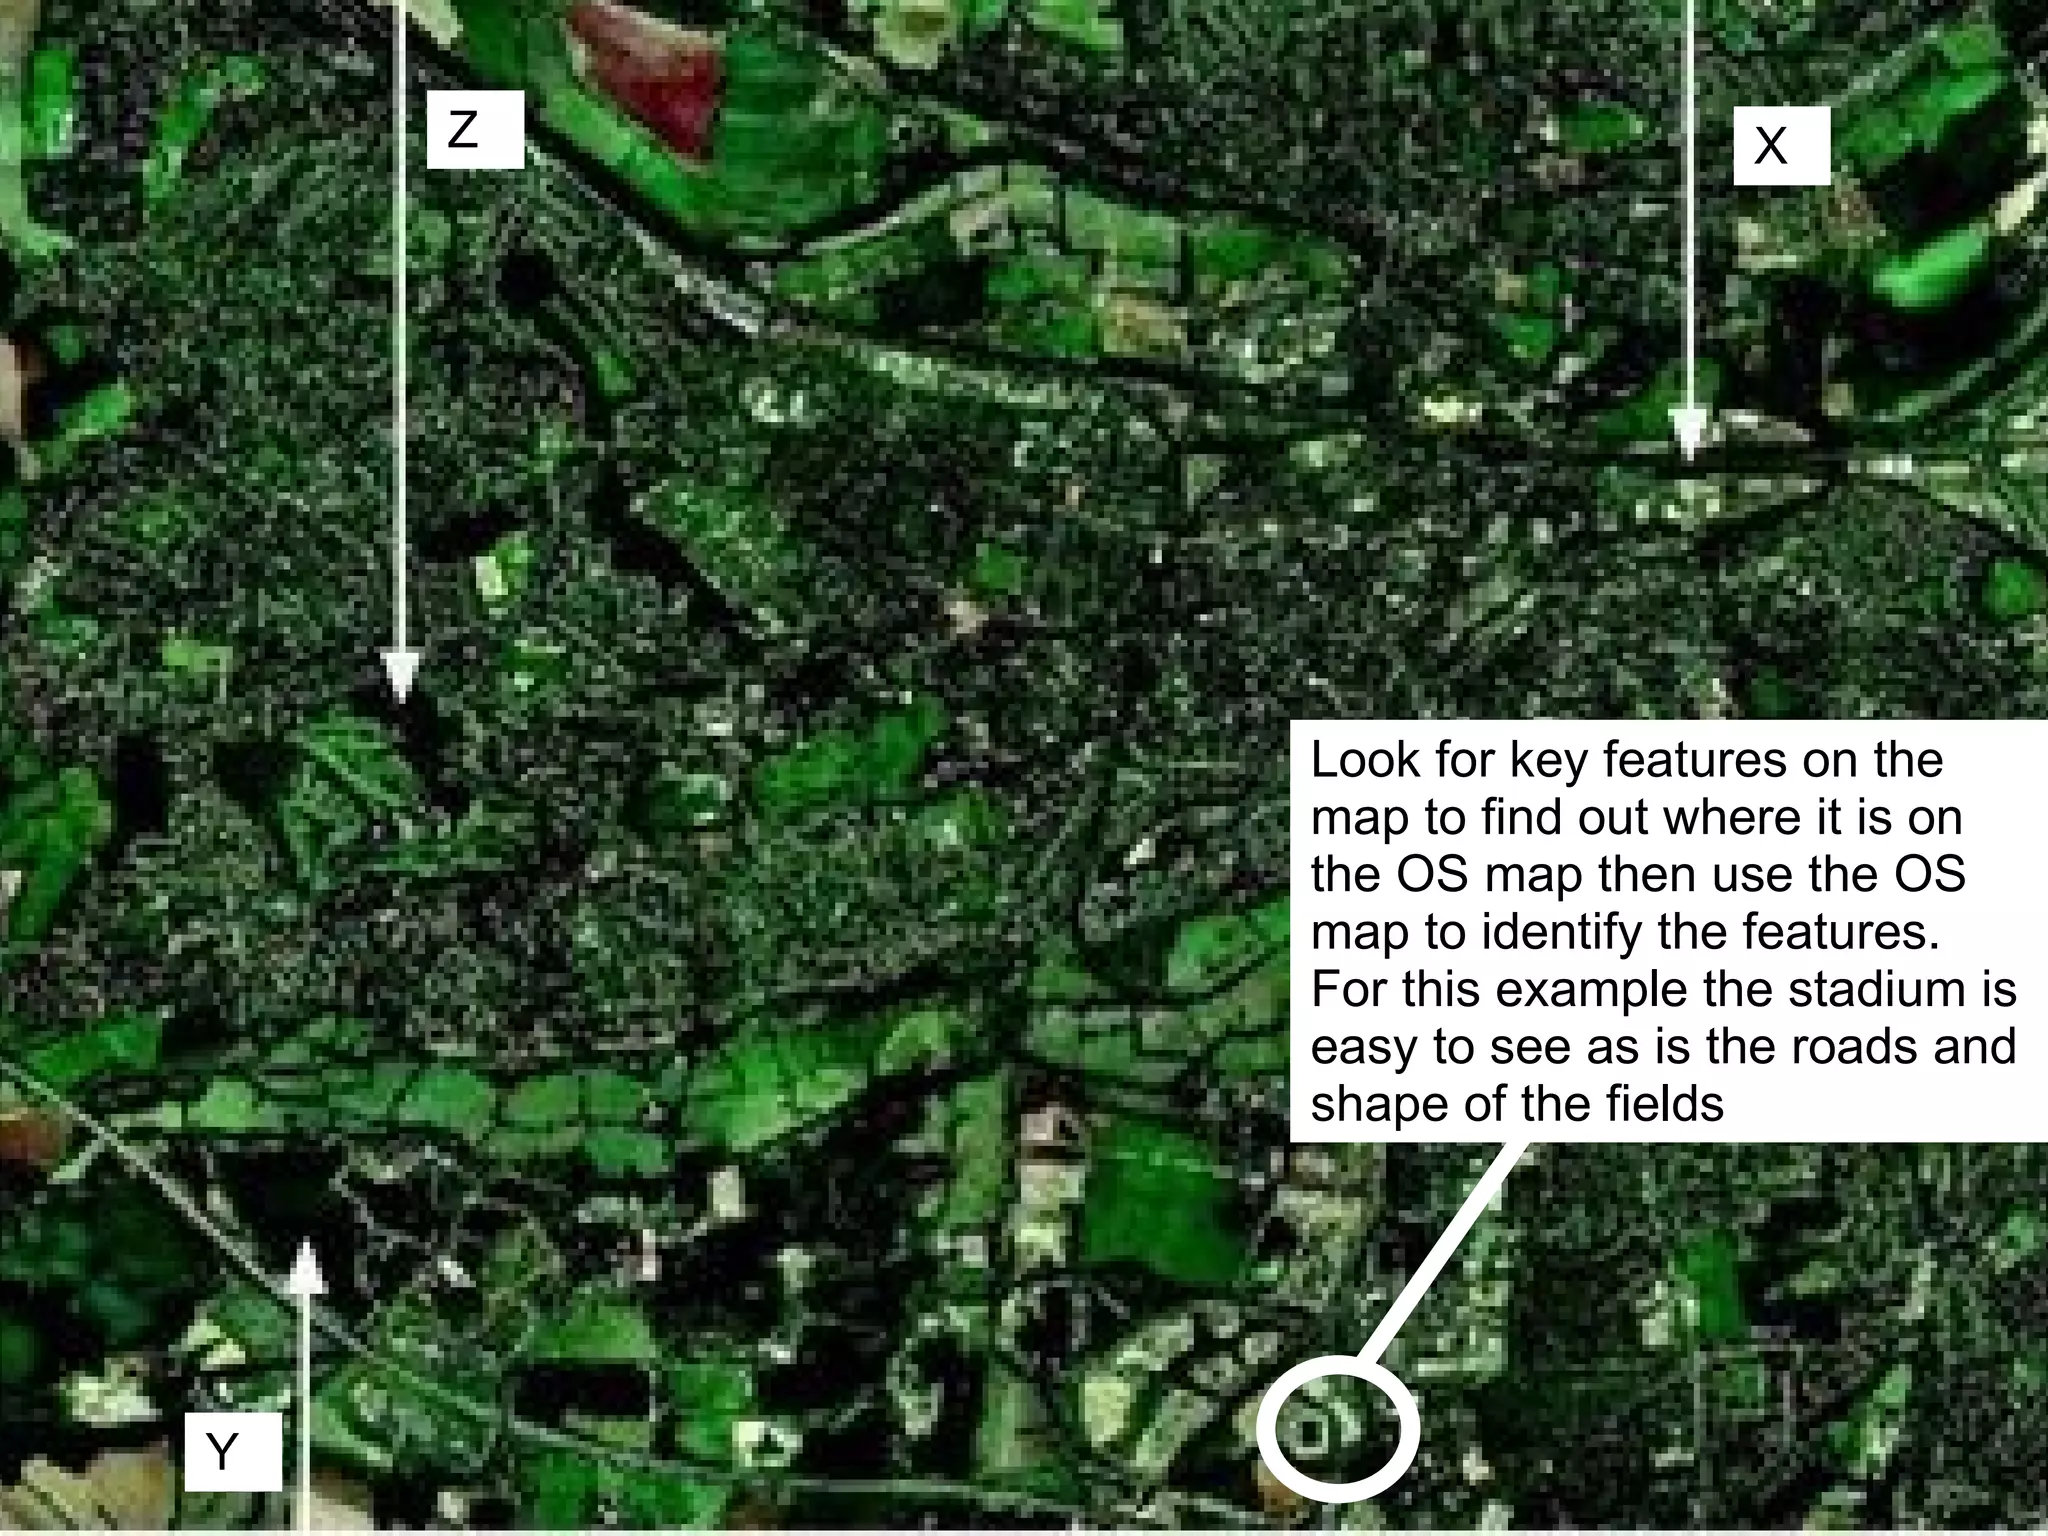
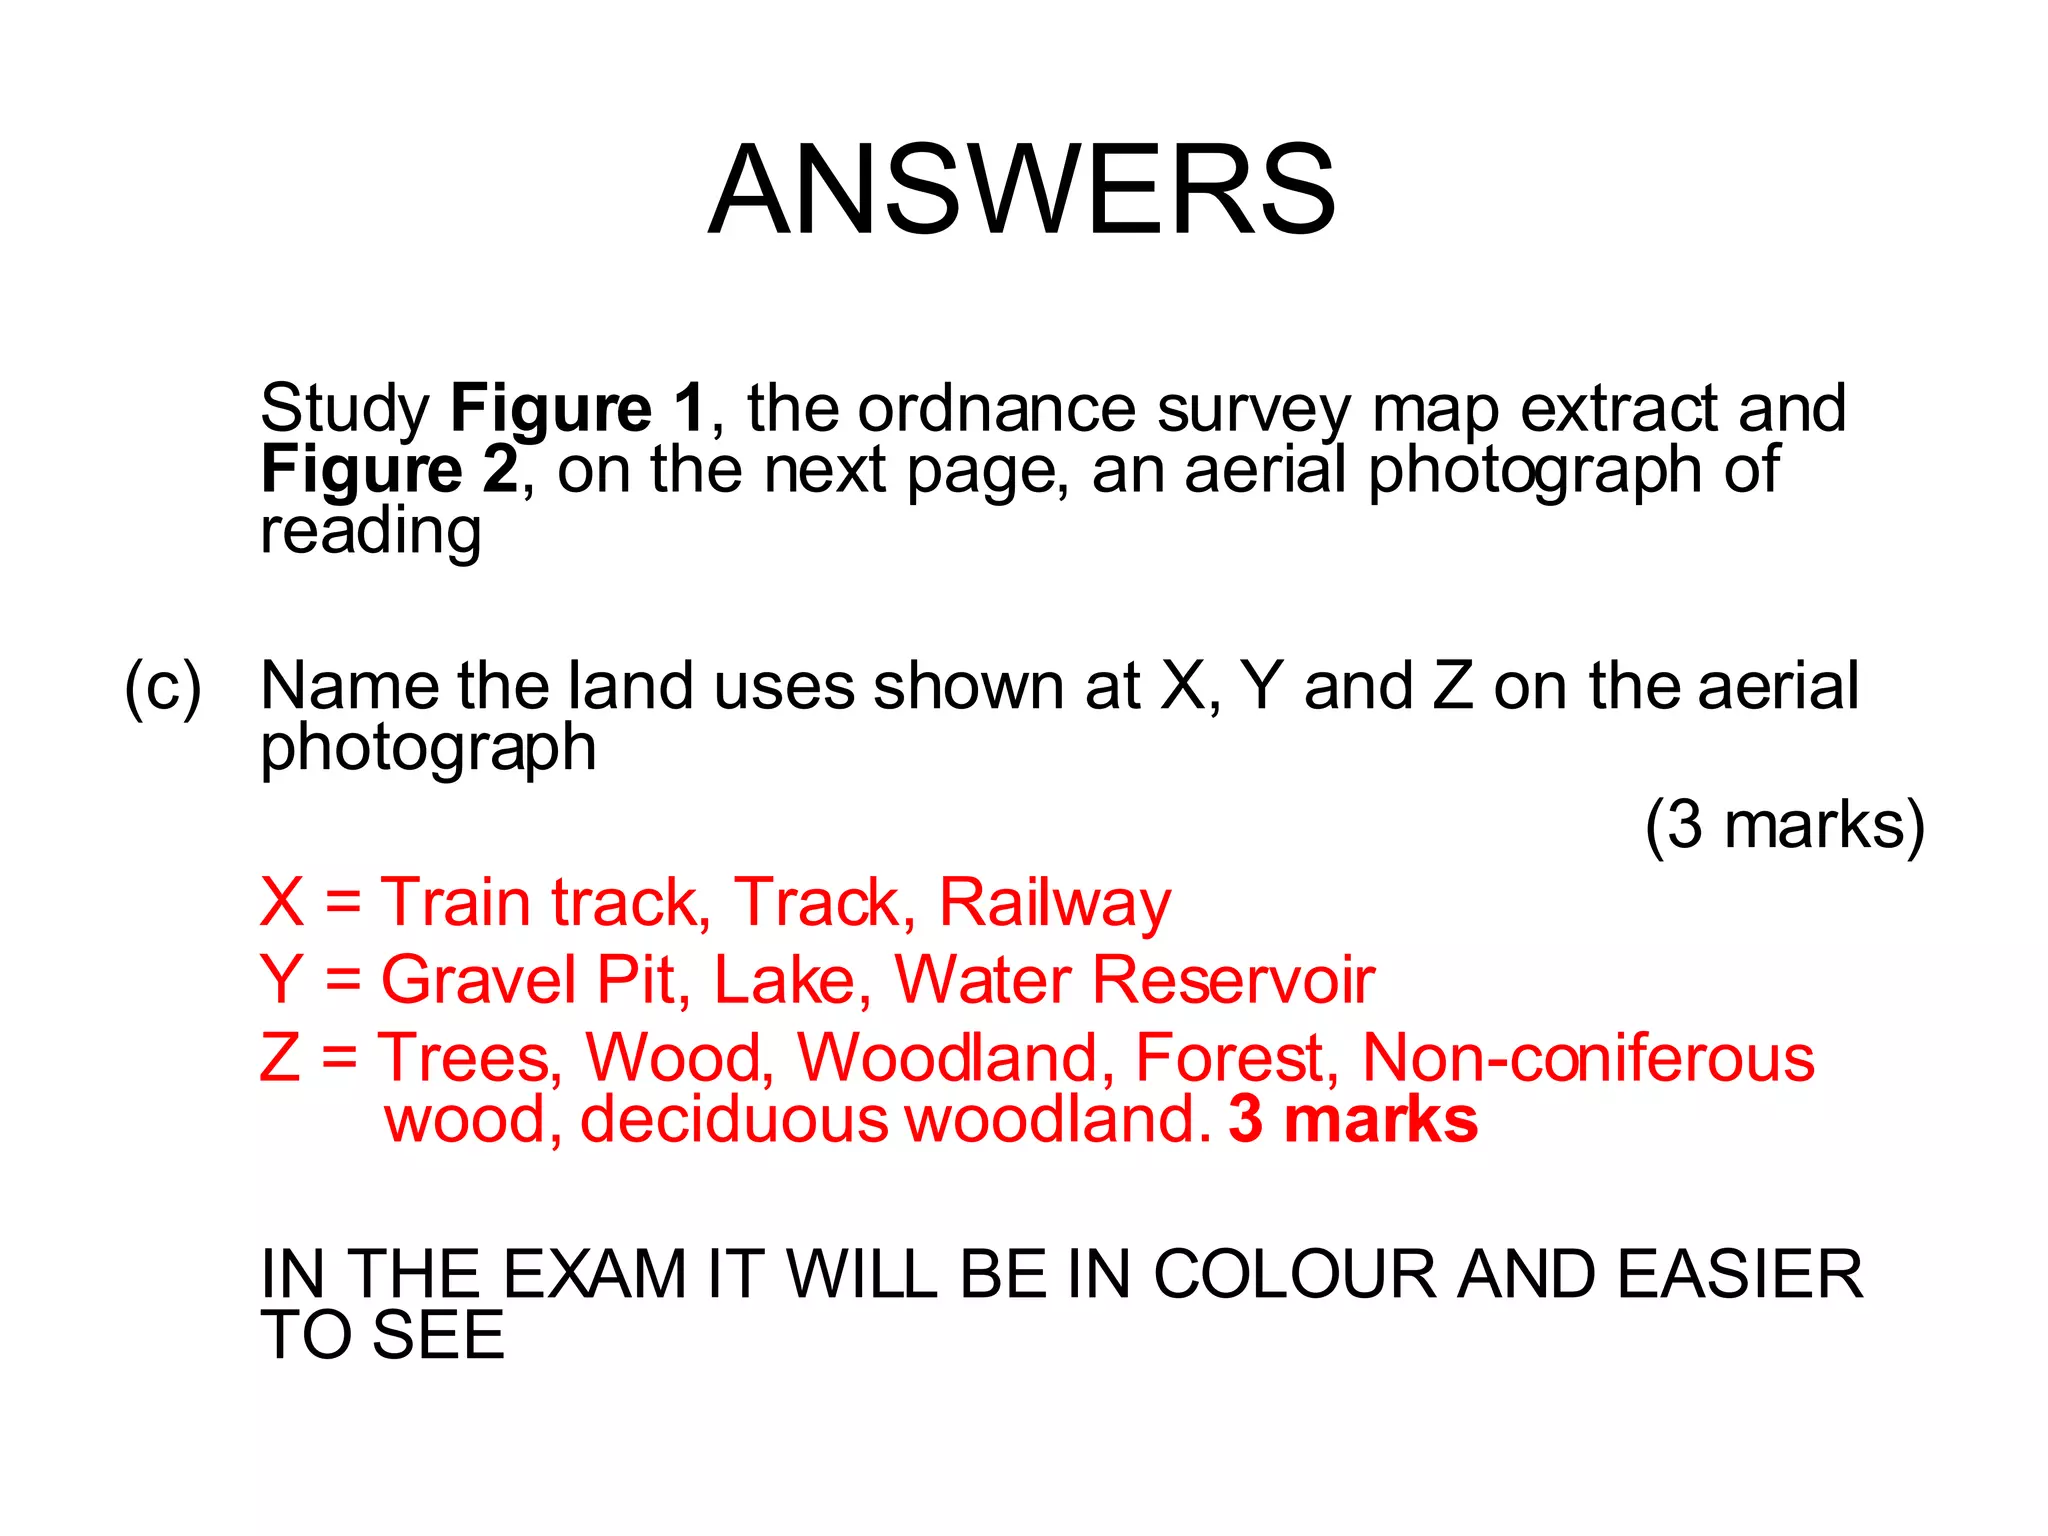


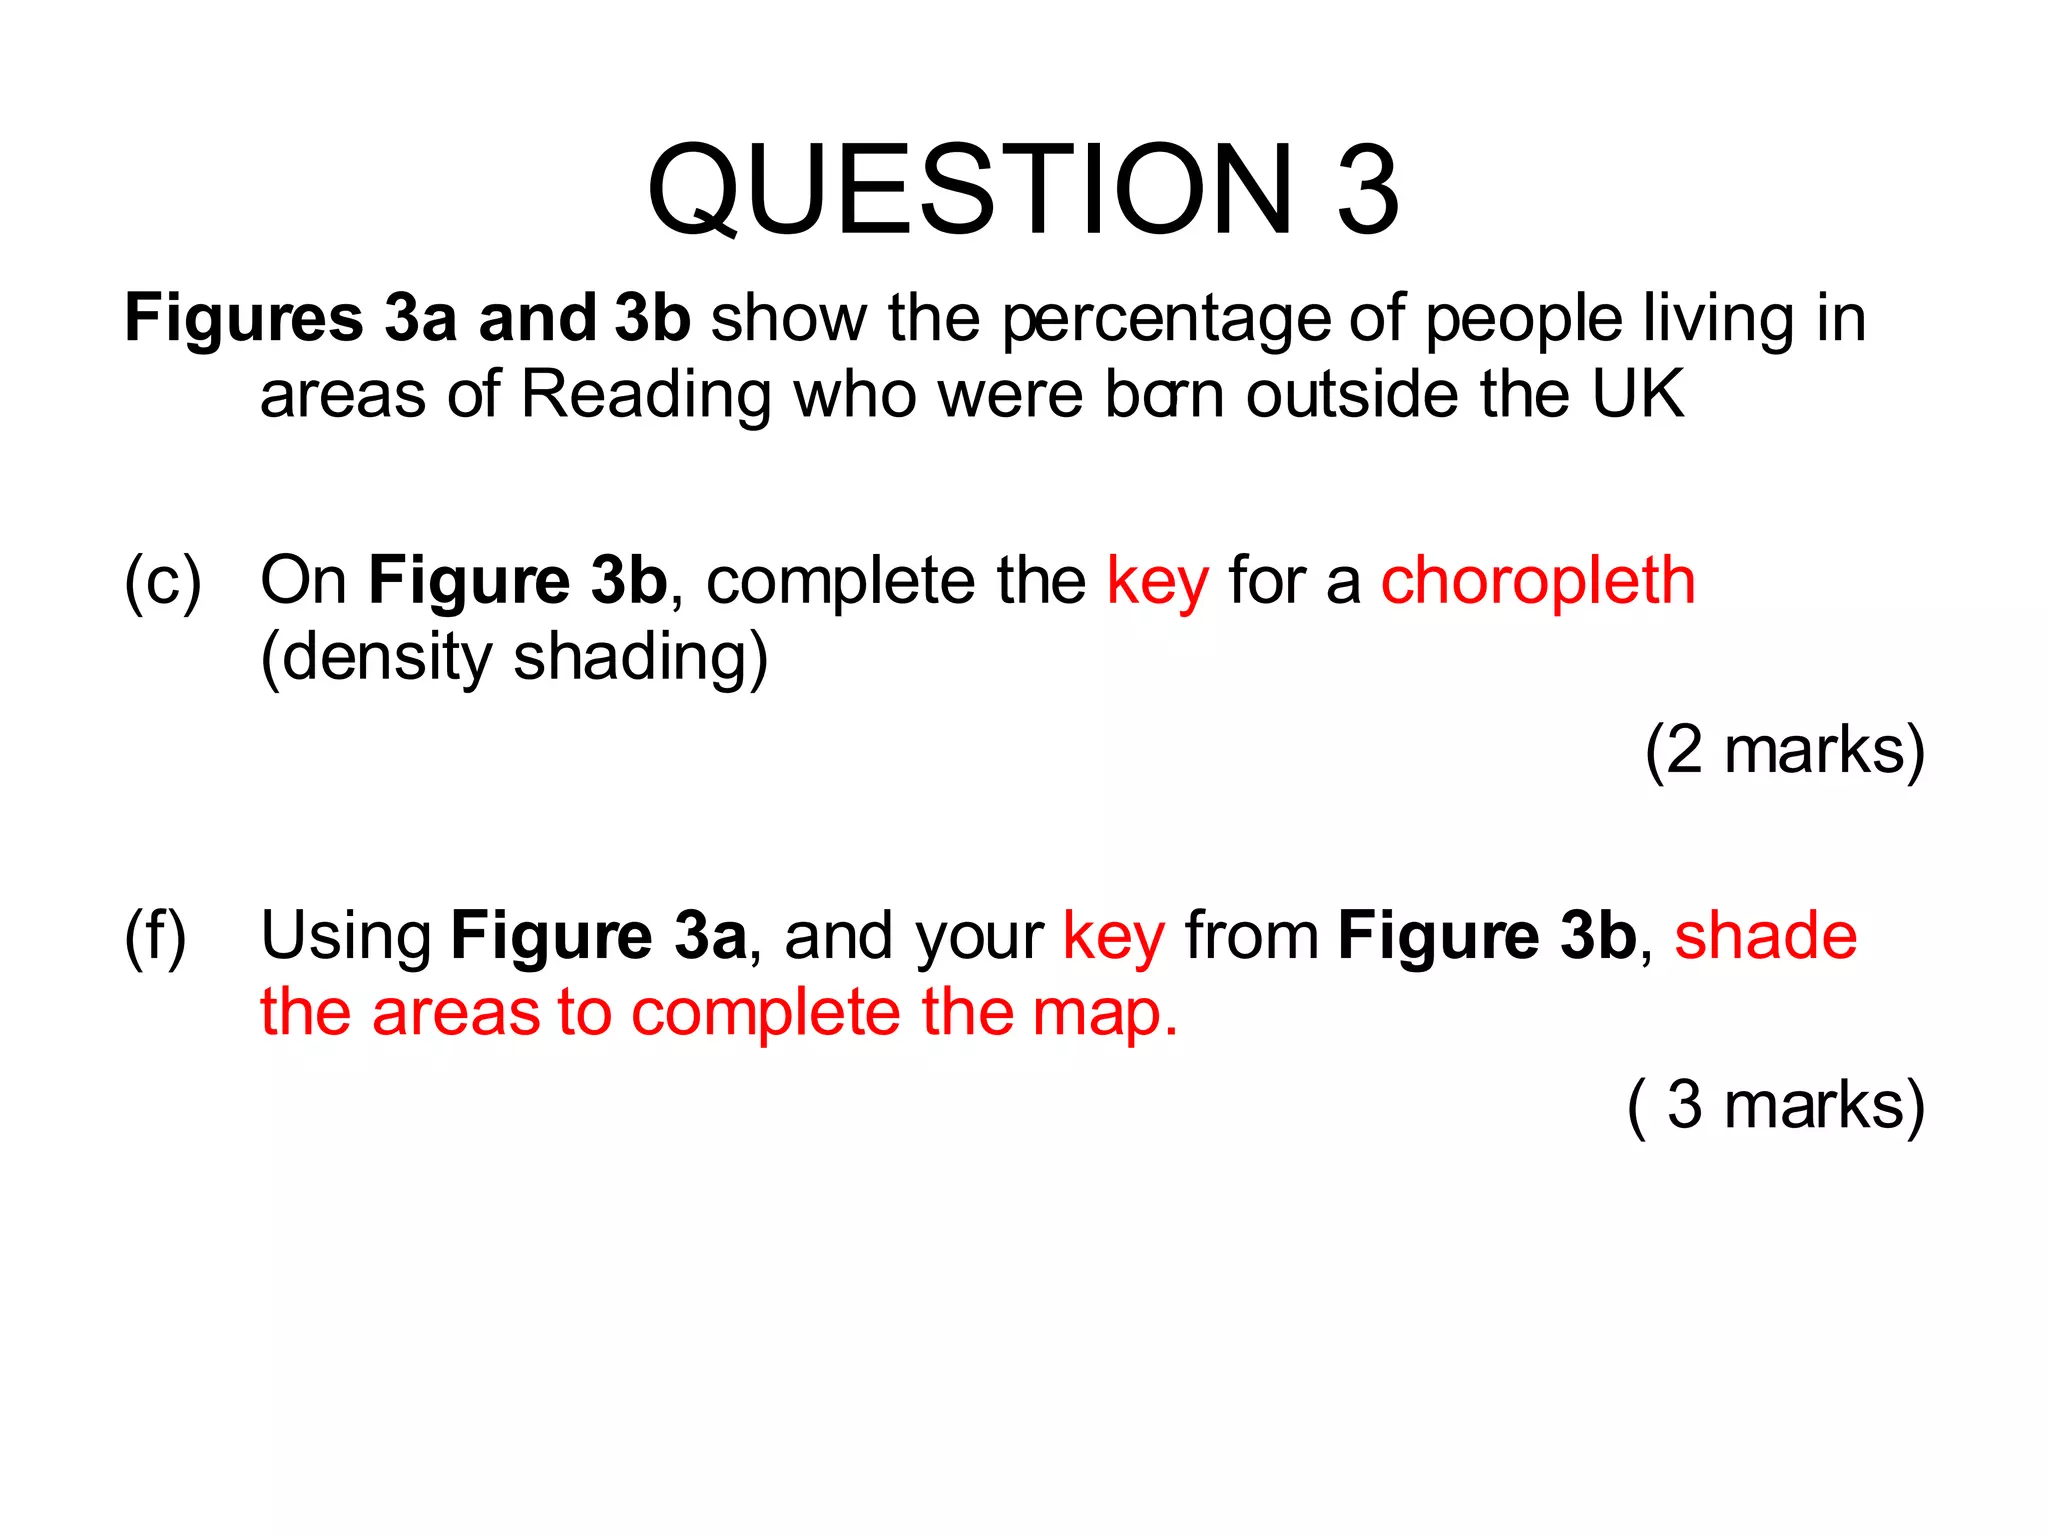

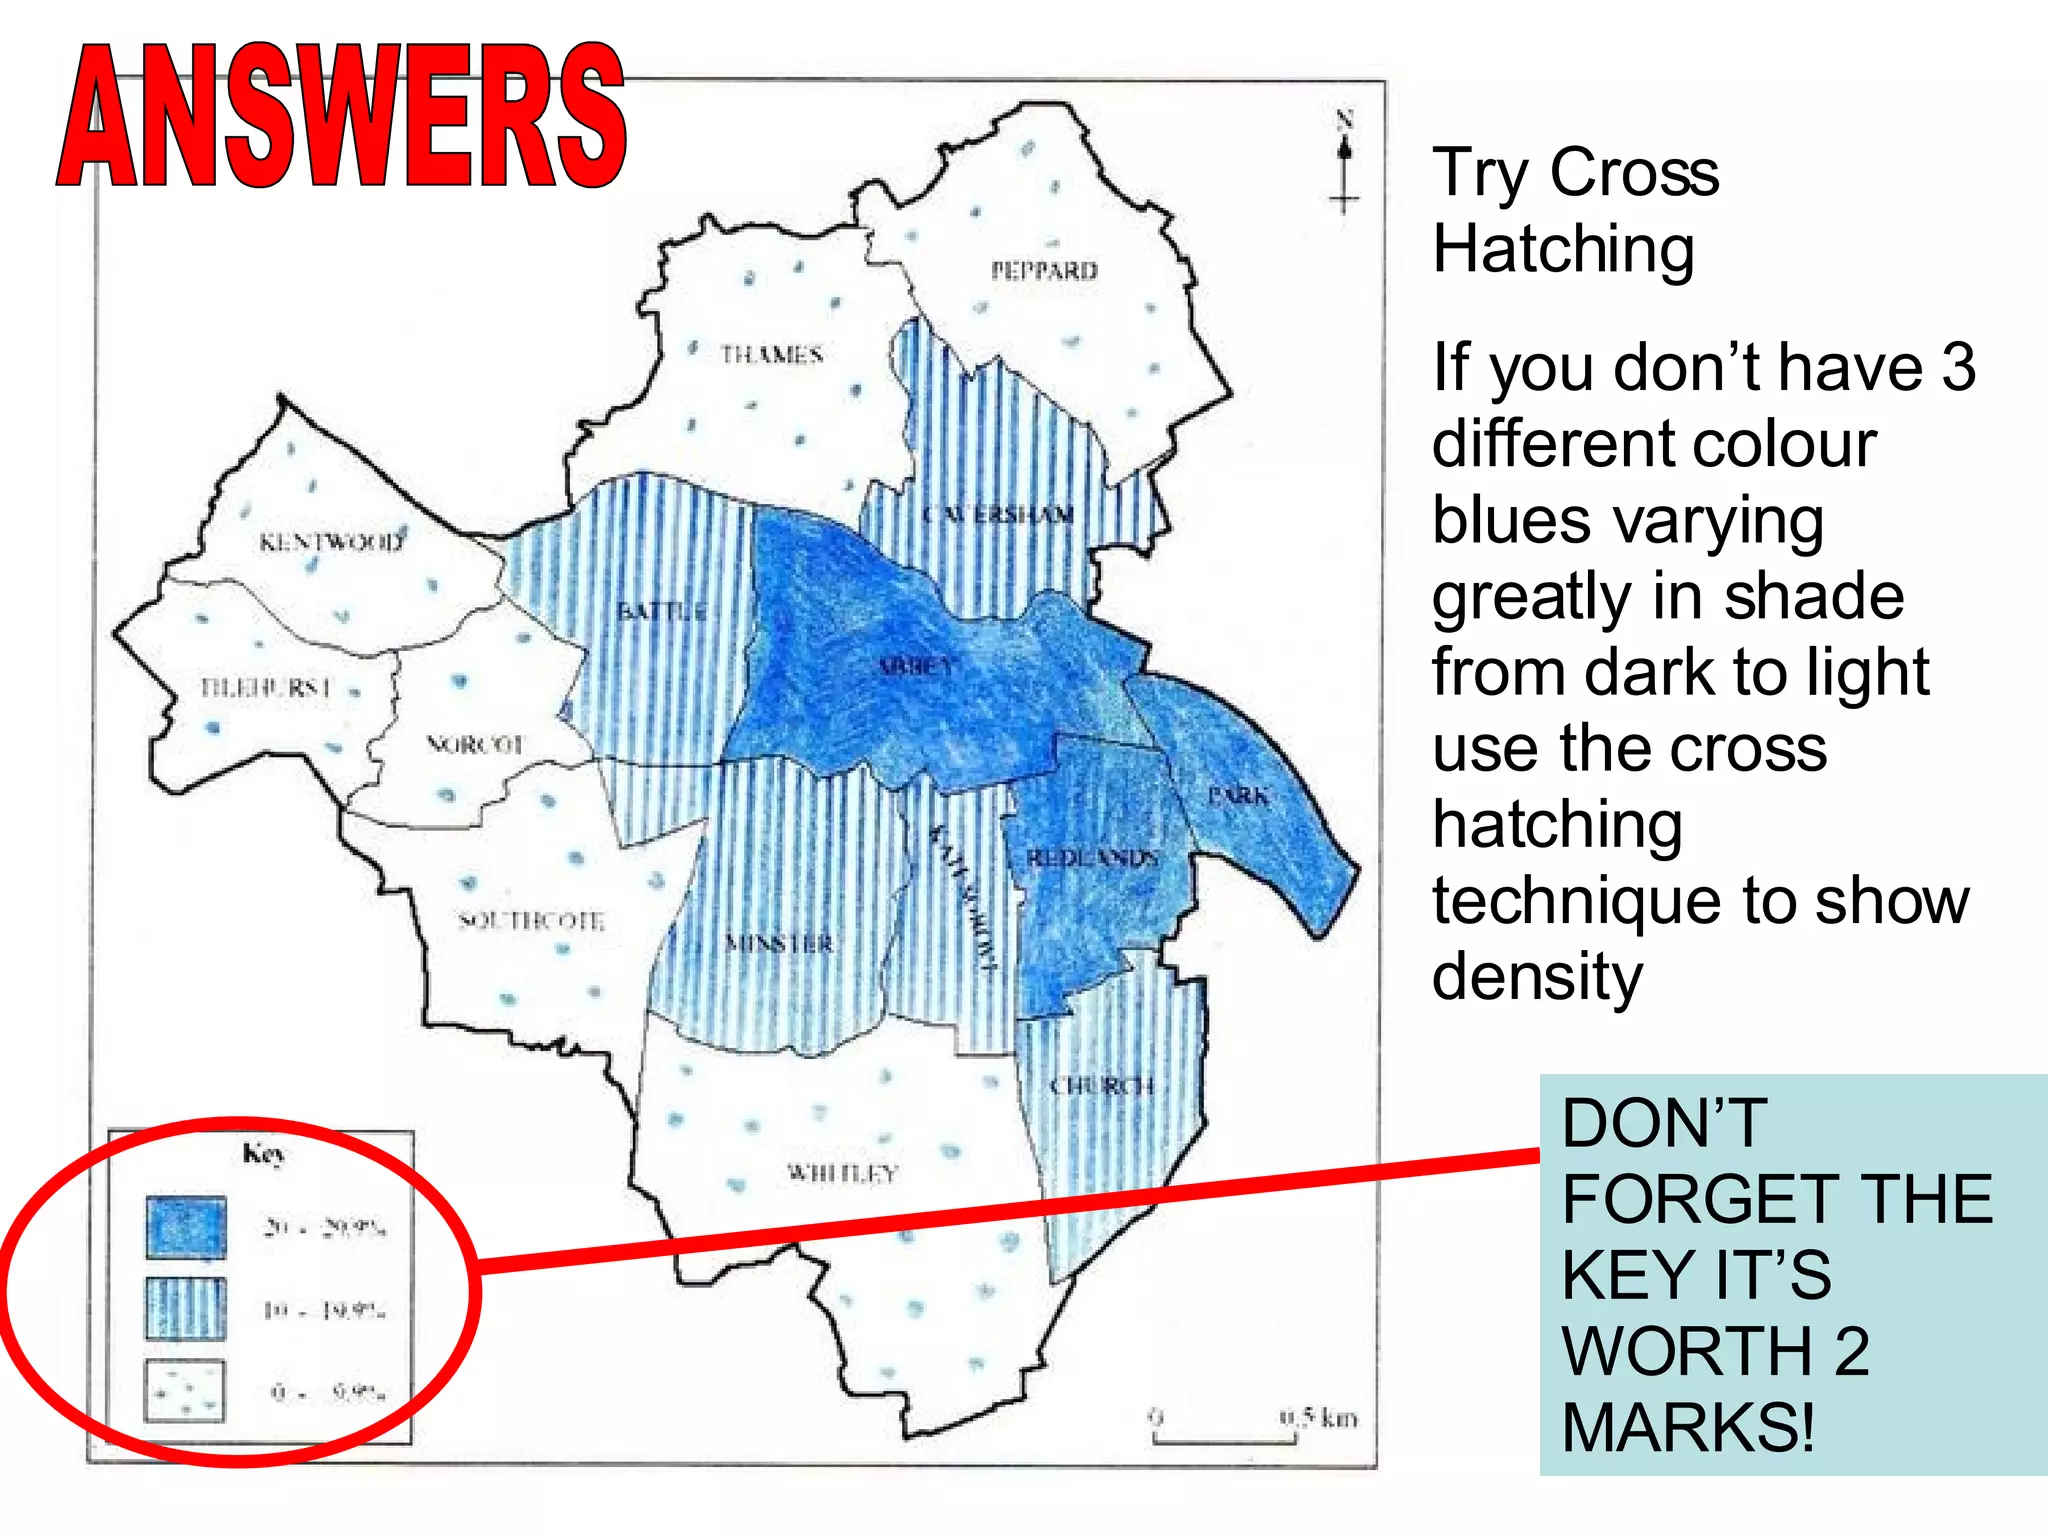
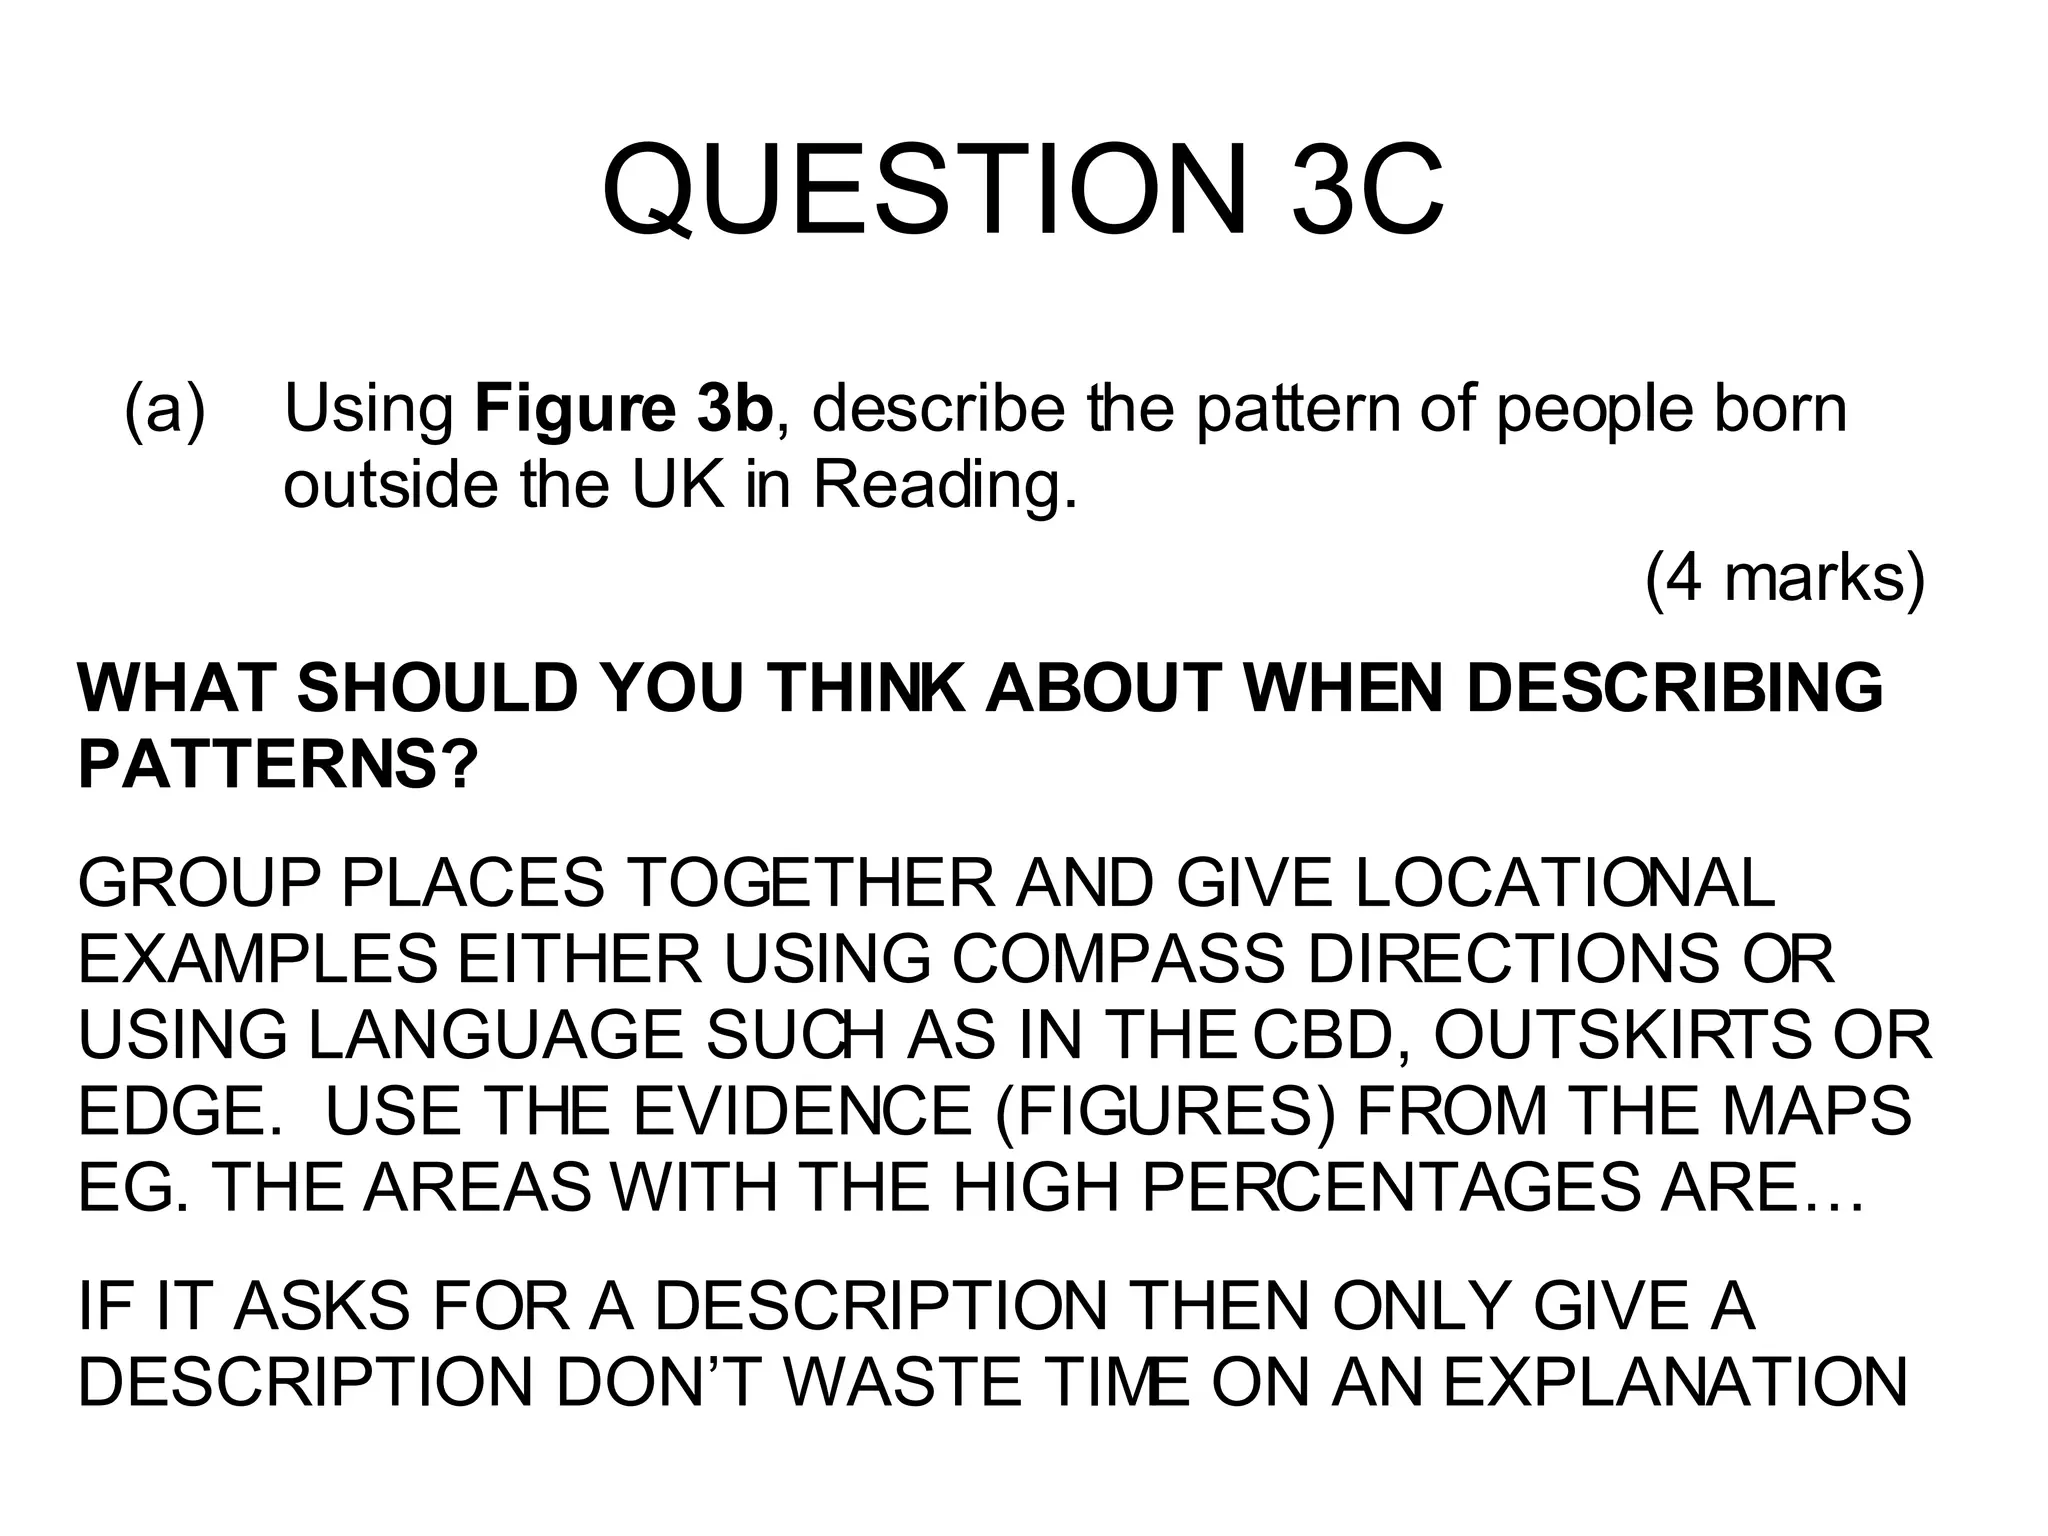


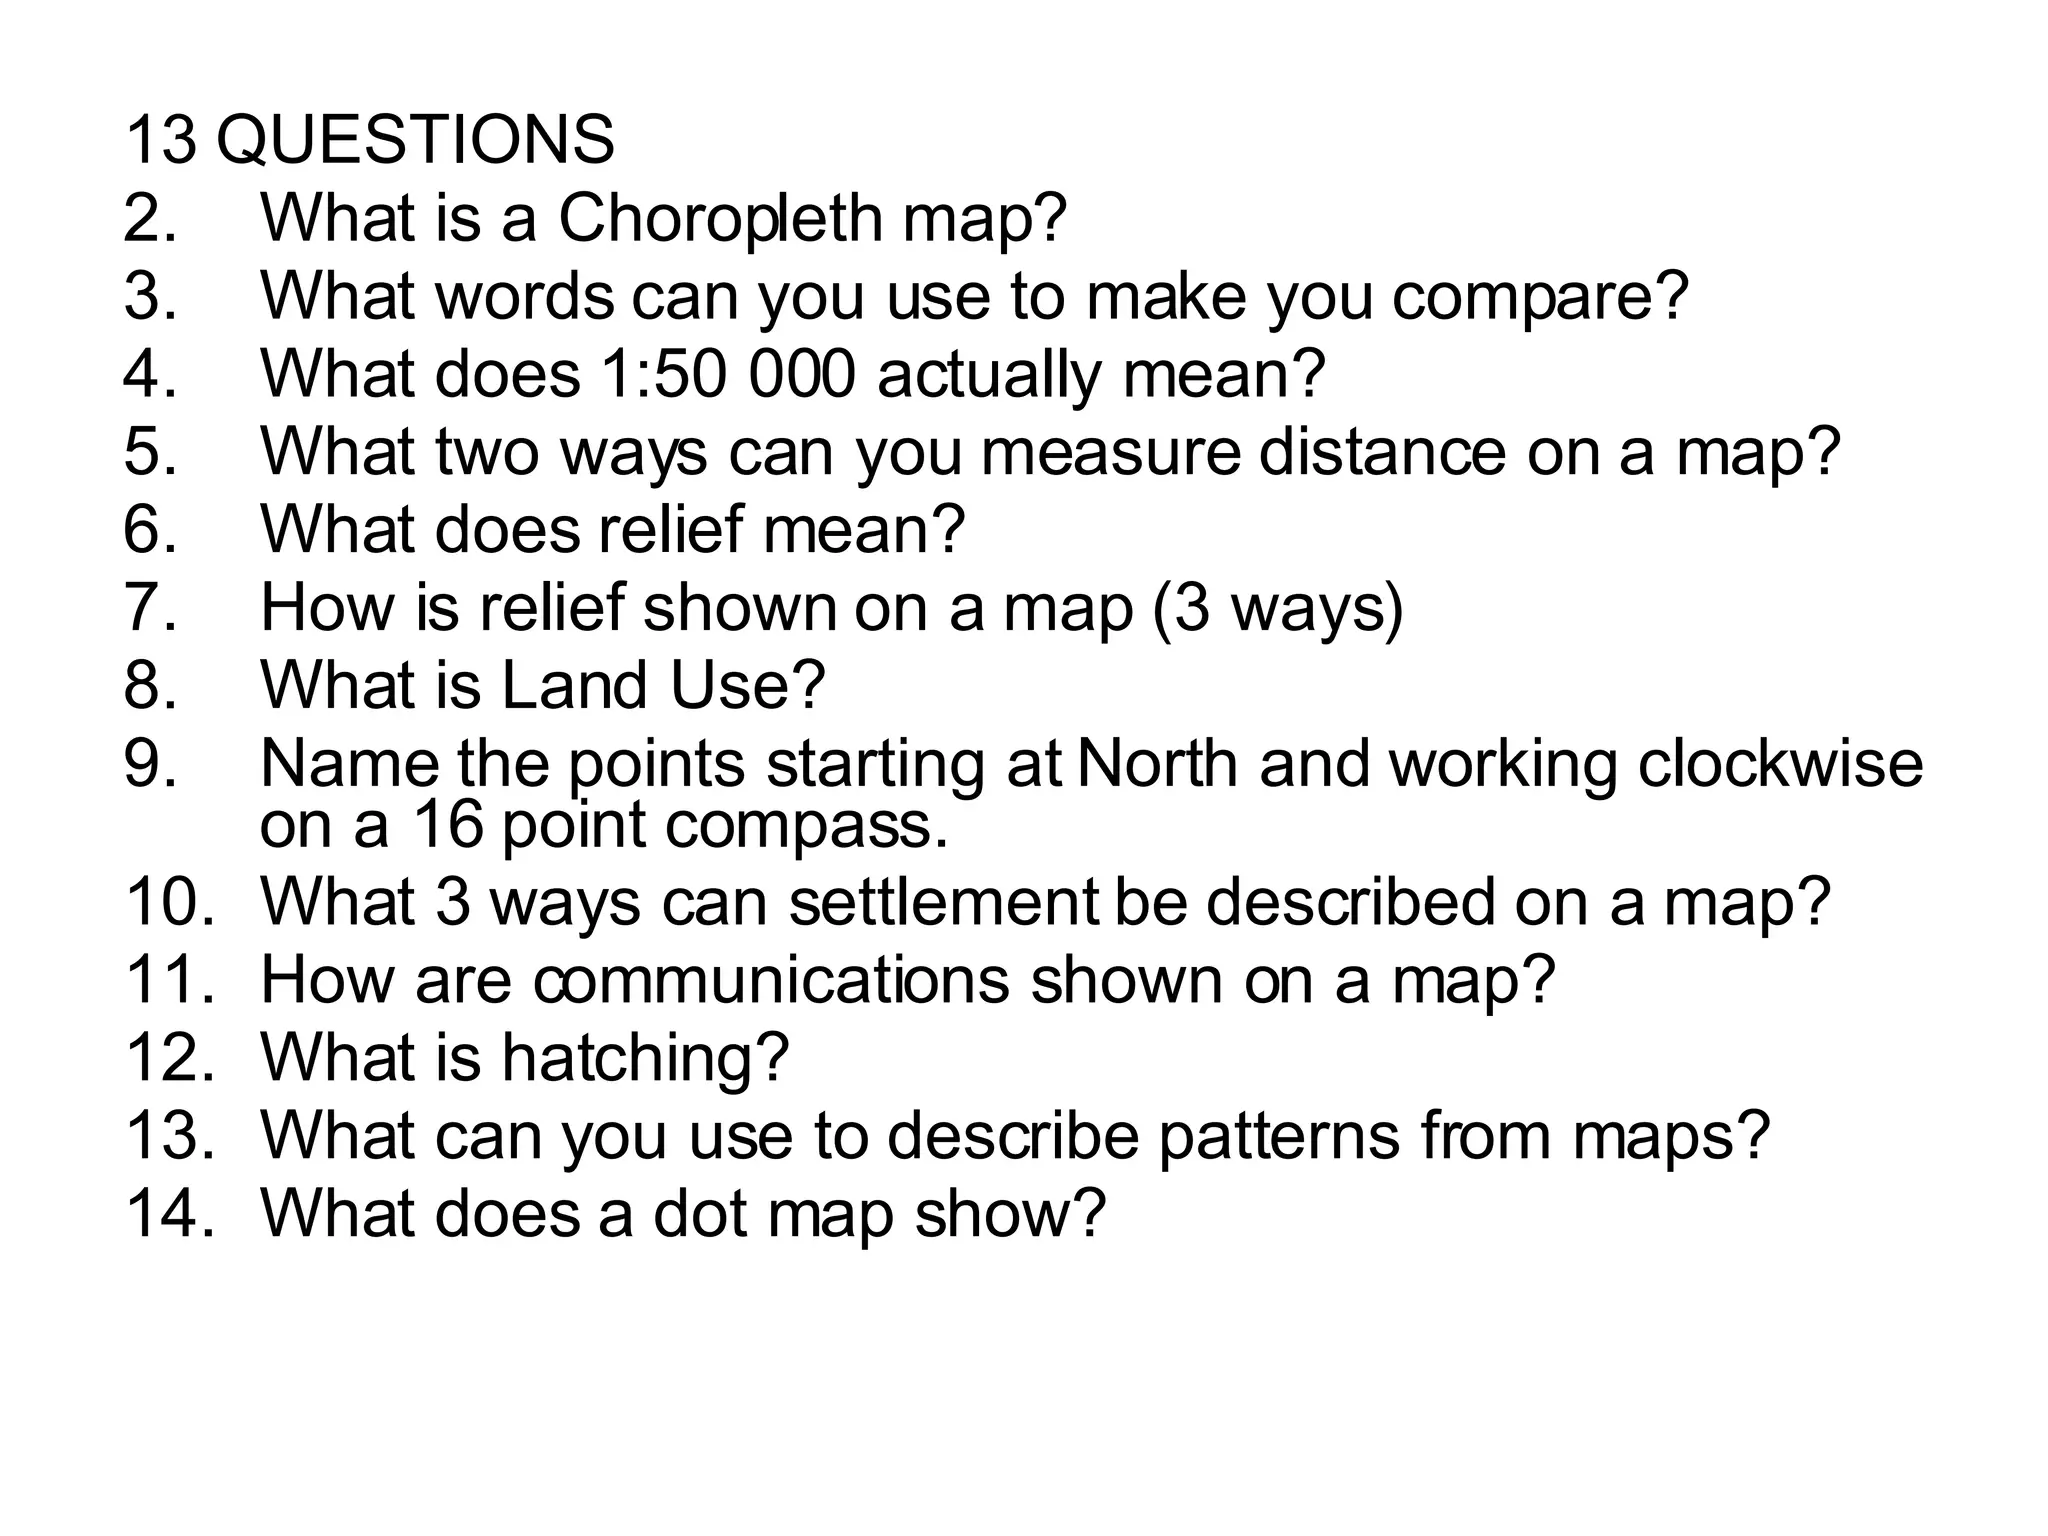


The document provides guidance on map skills revision for an exam, including: - Understanding OS maps at scales of 1:25,000 and 1:50,000 - Using 4-figure and 6-figure grid references - Measuring distances on maps using scales - Identifying land uses, relief, drainage and other features from maps - Interpreting aerial photographs and relating them to OS maps Sample exam questions are provided testing these skills, such as describing land uses in different areas and comparing relief between grid squares.