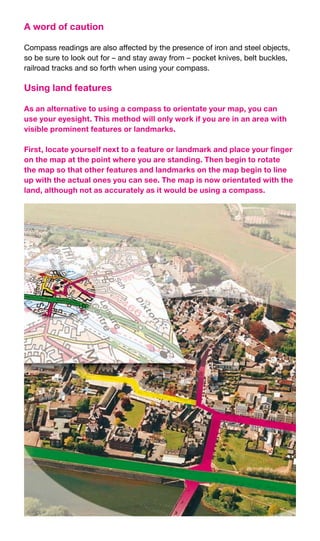
The document provides information on how to read maps, including key features typically found on maps such as names, symbols, scales, grids, contour lines, and compasses. It explains how to use grid references to pinpoint locations, how contour lines indicate elevation changes, and how to orient a map using a compass or landmarks. The document emphasizes the importance of planning routes, having the proper equipment like maps and compasses, and gaining experience to build map reading skills.
This document provides an overview of key elements of map reading including:
1. The main components of a map including title, scale, legend, grid lines, and north arrows.
2. Grid systems and references for locating positions on a map.
3. How to determine distances and directions using map scales, bearings, and cardinal points.
4. Methods for identifying one's own location including resection and using known lines/features.
5. Techniques for locating other positions including intersection and using azimuth and distance.
This document provides instruction on various methods of expressing direction on maps, including degrees, mils, and grads. It also covers key concepts like true north, magnetic north, and grid north. Base lines, azimuths, back azimuths, magnetic azimuths, and declination diagrams are explained. The document concludes by detailing the processes of intersection and resection, which allow one to determine an unknown location on a map using a compass and by sighting known locations.
This document provides an overview of cartography. It begins with definitions of cartography and discusses the importance and history of maps. The history section outlines some of the earliest maps from ancient civilizations like Babylonia, Egypt, and Greece. It also describes important contributions from figures like Ptolemy, including his world map and map projections. The document emphasizes that cartography has progressed from early conceptual maps to more accurate representations incorporating scientific principles.
- A map scale indicates the relationship between distances on a map and in real life, allowing for accurate representations though smaller or larger than reality.
- There are three types of map scales: word scale, linear scale, and ratio scale. A word scale states the distance represented by 1 cm, a linear scale graphically shows a distance, and a ratio scale compares map units to real-world units.
- Ratio scales can be difficult to comprehend, so they are often converted to a word scale using a system like metrics. For example, 1:25,000,000 could be changed to 1 cm = 250 km.
- Maps are categorized as large or small scale depending on the level of detail. Small scale
It will give you a fundamentals on different types of map and an introduction on topographic mapping.
This presentation is made for my report in Basic Geography Class
Maps provide important information about elevation and terrain. Topographic maps use contour lines to show elevations, with closer lines indicating steeper slopes. Contour intervals are the differences in elevation between lines. Features like rivers, hills, and basins can be identified. Slope, the steepness of terrain, can be calculated using the rise (change in elevation) over the run (distance between points). Topographic maps thus allow visualization and analysis of real-world three-dimensional landscapes.
Digitizing in GIS is the process of converting geographic data either from a hardcopy or a scanned image into vector data by tracing the features. During the digitzing process, features from the traced map or image are captured as coordinates in either point, line, or polygon format
Remote sensing and GIS techniques are useful tools for civil engineering projects. There are several models that can be used to represent the shape of the Earth, including flat, spherical, and ellipsoidal models. The ellipsoidal model is needed for accurate measurements over long distances. A geodetic datum defines the parameters of the reference ellipsoid and the orientation of the coordinate system grid. Common datums include NAD27 and NAD83, and transformations allow conversion between them. Map projections, such as Mercator and UTM, are used to represent the 3D Earth on a 2D surface, inevitably distorting some spatial properties like shape, area, or distance.
This document discusses different types of maps including political, physical, landform, resource, population, transportation, distribution, and grid maps. It provides examples and descriptions of each type. Political maps show human impacts and boundaries and change frequently. Physical maps highlight natural features and do not include human elements. Landform maps specifically show elevations and terrain. Resource maps indicate natural resources and agriculture. Population maps illustrate changes in population distribution.
A topographic map uses contour lines to represent the elevation and shape of the land. Contour lines connect points of equal elevation and indicate the steepness of slopes by their proximity - close lines mean a steep slope, while lines far apart indicate a gentle slope. A benchmark provides an exact elevation reference point marked on the map. Additional symbols and colors provide further information about features such as water, vegetation, and man-made structures. Topographic maps allow users to understand elevation changes over an area and measure distances using the map scale.
This document discusses map scale and projections. It defines scale as the relationship between distances on a map and in reality. Scale can be indicated graphically using a bar scale or fractionally as a ratio. Larger scale maps show smaller areas in greater detail while smaller scale maps show larger areas with less detail. Map projections transfer the spherical Earth onto a flat surface, inevitably introducing some distortion of shapes, sizes or distances. Different projections prioritize conformality, equivalence or other properties depending on the map's intended use.
This document provides information about topographic maps, including:
1. Topographic maps show elevation, shape of the earth's surface using contour lines connecting points of equal elevation. Features like water, terrain, and human structures are shown through different colors and patterns.
2. Contour lines indicate elevation changes - closely spaced lines show steep slopes, widely spaced show gentle slopes. Contour lines never cross or branch. When crossing streams, they bend upstream. Closed contours indicate hills and depressions.
3. Topographic profiles show elevation changes along a line, often with vertical exaggeration to emphasize details. Gradient is the steepness of a slope. Constructing profiles involves connecting elevation points along a contour line slice
The document provides guidance on map skills revision for an exam, including:
- Understanding OS maps at scales of 1:25,000 and 1:50,000
- Using 4-figure and 6-figure grid references
- Measuring distances on maps using scales
- Identifying land uses, relief, drainage and other features from maps
- Interpreting aerial photographs and relating them to OS maps
Sample exam questions are provided testing these skills, such as describing land uses in different areas and comparing relief between grid squares.
The document provides information on the importance of map reading and land navigation skills. It discusses various navigation tools like maps, compasses, and pacing techniques. It emphasizes that even experienced outdoorsmen can get lost and shares common reasons why people become disoriented in the wilderness. The document also summarizes different map features and symbols, compass parts and usage, and pacing methods to determine distance traveled.
This document discusses key geographical skills and investigations, including topographical map reading skills, geographical data techniques, and geographical investigations. It covers topics such as reading topographical maps, interpreting scales, measuring distances, describing relief features, identifying landforms, calculating gradients, interpreting map symbols, describing patterns of vegetation and land use, and explaining relationships between relief and land use. It also discusses using photographs, satellite images, and different types of graphs to depict and analyze geographical data.
This document provides an overview of cartography and mapmaking. It discusses the processes involved, such as data collection, design, and reproduction. It covers the uses and functions of maps, different types of maps and symbols used. It also explains important concepts like map projections and technological changes in the field. The document highlights both the advantages of maps in conveying spatial information efficiently, as well as their limitations in providing complete accuracy.
This document discusses different types of map projections used to represent the spherical Earth on a flat surface. It describes cylindrical, conic, and azimuthal projections. Cylindrical projections have straight, perpendicular lines of longitude and latitude and include the Mercator projection. Conic projections are fan-shaped and have minimal distortion along a central line. Azimuthal projections radiate from a central point and preserve directions from that point. The document provides examples like the Robinson, Polyconic, and Lambert azimuthal equal area projections. It concludes that the selection of map projection depends on the map's intended purpose.
The document discusses map reading and interpretation. It covers relief representation using contour lines on maps, drainage patterns, and human-made features. Students will learn about contour lines, how they represent 3D relief on 2D maps, and how to draw contour lines and cross sections. Contour lines connect points of equal elevation and come in three types: index lines with elevation numbers every fifth line, intermediate lines between the index lines, and supplementary dashed lines for half-interval changes in elevation.
This document provides an overview of cartography and mapmaking. It discusses the cartographic process, which involves collecting and organizing data, designing maps, and reproducing maps. It also describes the uses and functions of maps, different map types and symbols, various map projections, and technological changes in the field. The document outlines advantages and limitations of maps and concludes that cartography involves the theory and practice of mapmaking to effectively communicate spatial information.
Map is a drawn or printed representation of the physical features of the Earth.
It is the best tool to show, understand and analyse the features of an area. Cartography is the art and science of making maps. This module highlights many information on maps, types and their uses.
This Presentation is to made concepts about measuring the earth (to locate position of any person on the whole earth). For this purpose we re going step by step basis in this presentation.These steps are mentioned as contents. After that you may able to learn about measuring a person's position of earth. Thank you!
Geography map skill (all you need to know)jamesadam2001
This document provides an overview of key map skills, including compass directions, scale, grid references, contour lines, symbols, and measuring distance. It explains that a map shows features of a place and uses lines of longitude and latitude to form a grid reference system. Contour lines are used to represent height or elevation since maps cannot display three-dimensional terrain. Symbols simplify features and a map scale allows measurement of real-world distances based on the scale ratio. Measuring distance involves using a scale to determine real-world lengths between two points on a map.
This topic includes representation of topography by various non mathematical and mathematical methods.
Pictorial method (Hachure lines, Hill shading)
Mathematical method (Spot heights,Bench marks, Trigonometrical stations, Layer tint or altitude tints, Contour lines )
Combination of different methods
This document discusses various skills for reading topographical maps, including identifying compass direction and bearing, measuring straight-line distances, understanding contour lines and map symbols, and using scale. It provides steps for determining compass direction and bearing between two points using a protractor. It also outlines how to measure straight-line distances on a map using a linear scale or strip of paper. The objective is to use contour lines to describe land relief and map symbols to locate features.
Geographic coordinate system & map projectionvishalkedia119
The document discusses geographic coordinate systems and map projections. It defines key concepts like geoid, spheroid, datum, latitude and longitude, projections, and the UTM coordinate system. The UTM system divides the globe into 60 zones, each 6 degrees wide, and uses a Transverse Mercator projection within each zone. UTM coordinates express a point's easting and northing distances in meters from the central meridian and equator/south pole.
The document discusses different types of maps and their purposes. It explains that maps are useful tools that provide a visual representation of the earth's surface using symbols to depict spatial information. Some key map elements mentioned are legends that explain symbols, compass roses that show direction, and different lines or colors to represent features like roads, borders, and land areas. Different types of maps discussed include tourist maps, road maps, topographic maps, and sectional maps, each meant for a specific use.
This document discusses grid references and how they are used to locate features on maps. It explains that topographic maps use a grid system of eastings and northings to specify locations, and that area references use a four-digit code to indicate a specific grid square. It also introduces six-figure grid references which can pinpoint an exact location within a grid square down to the tenth of the easting and northing. Examples are provided to demonstrate how to read and use both area references and more precise grid references.
The wind directions are:
A. Easterly Light
B. Southerly Moderate
C. Westerly Gentle
D. Northerly Fresh
E. Variable Light and variable
F. Calm Calm
G. Southerly to southwesterly Fresh
The strongest wind is D. Northerly - Fresh
The weakest wind is F. Calm
Bearings are used to describe direction and position more accurately than compass points alone. They are always three figures measured clockwise from North. To measure the bearing from point A to point B, draw a line from A to B and measure the angle clockwise from the North line at A. To measure the bearing from B to A, do the same but measure the exterior angle clockwise from the North line at B, and add 180 degrees if the measurement is less than 180. Practice examples are provided to help understand how to measure bearings.
The document appears to be a geography test on map skills for students in Year 7 at the International School of Toulouse. It contains 35 multiple choice and short answer questions testing students' abilities to interpret map symbols, use scales, calculate distances, find grid references, identify locations, and describe terrain features using contour lines. Students are instructed to refer to a laminated map of Cambridge and surrounding areas as they complete the test.
This document provides guidance on map reading skills for beginners and advanced users. It covers key map elements like symbols, scale, grid references, contours and using a compass. The document explains how to orient a map, read terrain, and navigate with or without a compass using landmarks. Advanced techniques include triangulation, measuring distances, and navigating at night.
This document provides an overview of land navigation training that includes two parts: map reading skills and compass use. Part one covers important map features like marginal information, symbols, terrain features, and determining elevation from contour lines. It emphasizes the purpose of maps for navigation and importance of checking the map date. Part two introduces navigation techniques like determining grid coordinates using a protractor and understanding military compass features. The training aims to teach service members key map reading and land navigation skills for navigating terrain and completing missions.
Orienteering is an outdoor sport that involves navigating through unfamiliar terrain using a map and compass. It originated in Scandinavia in the late 1800s and came to the US in the 1940s. The goal is to navigate between control points of varying distances, from less than a mile to over 4 miles. Key skills include reading topographic maps, using a compass, pacing distances, navigating with techniques like using beelines or contour lines, and identifying one's location using a grid coordinate system.
The document discusses elements of maps, including:
1. Maps contain specific elements like a title, key, compass, and scale to help readers understand the information represented.
2. Contours are lines on maps that connect points of equal elevation and show the shape and steepness of landscapes.
3. Relief on maps can be shown through methods like layer tinting, contours, spot heights, and hachures that represent elevation changes through color shading and line spacing.
This chapter discusses key geographical skills like map reading, interpreting data representations, and conducting fieldwork investigations. It covers topics such as reading grid references, compass directions, scales, measuring distances, interpreting reliefs and landforms on maps, and analyzing photographs and satellite images. Various types of graphs like line graphs, bar graphs, pie charts, and climographs are introduced to represent geographical data. The three phases of fieldwork - pre-fieldwork, during fieldwork, and post-fieldwork - are also outlined.
Maps are diagrams that represent physical features and areas of land or sea. They have certain key elements like a title, legend, scale, and grid that help interpret the information shown. These elements include the title, which indicates the subject; the legend or key, which explains the symbols; and the scale, which shows the ratio of distances on the map to actual distances.
A map is a representation of all or part of the Earth's surface drawn to scale. Maps use symbols and colors to represent features like landforms, roads, and vegetation. Contour lines connect points of equal elevation, allowing maps to depict three-dimensional terrain in two dimensions. Contour maps are useful for engineering projects to evaluate sites, trace grades, and calculate earthworks.
A map is a representation of all or part of the Earth drawn on a flat surface at a specific scale that uses symbols and colors to represent selected features of an area. Maps allow for accurate planning of journeys by showing landmarks, routes, and distances. There are different types of maps including general reference maps, thematic maps that illustrate a particular theme, and topographic maps that show landscape topography through contour lines.
This document is a student's report on mapping and maps. It introduces maps and their use in geography and history. It discusses what maps show and don't show, and how they differ from pictures. The document then explains key elements of maps, including colors used to represent features, common symbols, and scales. It provides examples of map scales and classifications. Finally, it summarizes some key points about what maps depict and how scales work.
This document provides an overview of map reading and concepts. It defines what a map is, discusses different map types (topographic and thematic), scale (linear, statement, representative fraction), and methods of map enlargement and reduction. It also covers graphic representation and interpretation of geographic data on maps, including marginal information like titles, scales, legends and borders. The key points are that maps are representations of the earth's surface, there are different types for various purposes, and scale, enlargement/reduction and legends are important for understanding what is depicted on maps.
The document provides an overview of geographic information systems (GIS). It discusses how GIS is used in multiple disciplines like agriculture, natural resource management, and urban planning. It also covers key GIS concepts like location-allocation analysis, which involves finding optimal locations to serve demand while minimizing costs. Additionally, the document defines common map elements such as point, line, and area features and the typical components of maps like titles, legends, scales, grids, and compass roses.
Other map symbols on topographic maps Occasionally you will.pdfsyedabdul78662
Other map symbols on topographic maps: Occasionally you will see an elevation listed at a
specific spot on a map that is not located on a contour line, commonly on the top of hills. These
elevations have been surveyed and are referred to as bench marks. Other standardized symbols
and colors used on most government maps include cultural features (made by people) generally
drawn in black; forests or woods shown in green; blue is used for bodies of water; and red is used
for roads and some land subdivision lines. Contour lines are usually shaded brown. When USGS
maps are revised, any new features (e.g. roads, suburbs) are shaded purple. 10. Use the bar
scale at the bottom of the map immediately below and determine the distance between X and Y on
the map. ( X and Y are underlined in red). km Get a topographic map from your instructor and
answer questions 11 through 15. a. What is the name of the topographic map? b. Who published
the map? (hint: look at the bottom of the map)Map scales can be thought of as the distance
between points on a map corresponding to some true distance on the ground. The ratio of map
distance to true distance is scale. There are commonly two types of scales listed on maps: a
graphic scale or bar scale, and a fractional scale. A bar scale is a drawn line or bar of some length
(Figure 10A ). A fractional scale is expressed as a ratio, e.g. 1:24,000 means one inch on the map
equals 24,000 inches on the ground (Figure 9 ). Bar scales can be used to determine straight-line
distances between places fairly easily on maps by using a ruler, or by laying the edge of a piece of
paper between the points on the map you want to know the distance between. Shift the paper
edge to the bar scale and use the scale like a ruler to measure the map distance. Figure 10A. The
left end of the bar is not zero; the arrow points to the location of zero miles on the bar scale. The
total length of this bar is FIVE miles, one mile to the left of the zero plus four miles to the right of
the zero. A common error with bar scales is to treat the left end of the line as zero. Pay attention to
where the zero point on the bar is actually located. Measuring distances along curvilinear features,
e.g. rivers. You canl u cat a series of straight-line segments as shown in figure (b) and (c). North
arrows drawn on a map refer to true geographic north (underlined in red on Figure 9). Compass
Magnetic Declination needles do not point toward the geographic north pole at most places on
earth, but toward the magnetic pole. The angular distance between true north and magnetic north
is called the magnetic declination. A compass must be adjusted for declination at the local area.
The magnetic declination on Figure 9 is listed as 20.5 as measured in 1962.in an.
This document provides an introduction to scale maps and basic cartography. It discusses what scale maps are, how they represent measured distances and directions on the ground. It also covers the basic elements of maps like symbols, legends, scales, direction indicators and grid systems. Specific map types are explained, including topographic maps which use contour lines to indicate elevation, and thematic maps which depict themes about places. Coordinate systems and how to measure locations and directions on maps are also summarized.
Continuing Our Look At Primary And Secondary Dataguest9fa52
The document discusses different types of maps and data presentation methods used in geography. It describes scatter graphs, line graphs, bar graphs, histograms, choropleth maps, dot maps, topological maps, isoline maps, and limitations of maps. Examples are given of choropleth and dot maps showing world population with Egypt highlighted. Maps are useful tools for geographers to locate study areas, show spatial patterns and changes over time.
Continuing Our Look At Primary And Secondary Dataguest2137aa
The document discusses different types of maps and data presentation methods used in geography, including their purposes, characteristics, and limitations. Scatter plots show relationships between two data sets, with the dependent variable on the x-axis. Line graphs show changes over time with all points connected. Maps are important geographical tools that can locate study areas, show spatial patterns, and compare changes over time. Different map types include choropleth, dot, topological, isoline, and sketch maps. Selecting the appropriate map scale and being aware of maps' limitations, like being snapshots in time, are important considerations.
Maps are diagrams that represent physical features and areas of land or sea. They have certain standard elements like a title, legend, scale, and grid that provide important information about what is shown and how to interpret it. These elements include the title, legend, scale, grid, and orientation that provide details on what the map shows, what symbols mean, distances and locations.
This document discusses key geographical skills and investigation techniques including:
- Reading topographical maps such as grid references, directions, and scales
- Measuring distances on maps using straight or curved routes
- Interpreting landforms and relief using contour lines and describing features like mountains, valleys, and plateaus
- Calculating gradients to determine the steepness of slopes
- Interpreting map symbols to understand physical and human features
- Analyzing settlement patterns and different types of maps
- Constructing and interpreting graphs like line graphs, bar graphs, histograms and scatterplots to visualize geographical data
- Following the phases of fieldwork which include forming hypotheses or questions, collecting data, analyzing results and drawing conclusions
This document provides an overview of how to use maps and compasses for orienteering. It discusses key map elements like scale, contour lines, directions, and distance measurements. It also explains how to use a compass to determine directions between points and measure distances on a map using a bar scale. The document aims to teach basic map reading and navigation skills.
Euro Cup Group E Preview, Team Strategies, Key Players, and Tactical Insights...Eticketing.co
We offer Euro Cup Tickets to admirers who can get Belgium vs Romania Tickets through our trusted online ticketing marketplace. Eticketing.co is the most reliable source for booking Euro Cup Final Tickets. Sign up for the latest Euro Cup Germany Ticket alert.
Olympic 2024 Key Players and Teams to Watch in Men's and Women's Football at ...Eticketing.co
Olympic 2024 fans worldwide can book Olympic Football Tickets from our online platforms e-ticketing. co. Fans can book Olympic Tickets on our website at discounted prices. Experience the thrill of the Games in Paris and support your favorites athletes as they compete for glory.
Football World Cup enthusiasts worldwide can secure their FIFA World Cup 2026 Tickets through our online platform, eticketing.co. With a user-friendly interface and exclusive deals, fans can effortlessly book FIFA World Cup Tickets for thrilling matches, all at discounted prices.
Croatia vs Italy Modric's Last Dance Croatia's UEFA Euro 2024 Journey and Ita...Eticketing.co
UEFA Euro 2024 fans worldwide can book Croatia vs Italy Tickets from our online platform www.eticketing.co. Fans can book Euro Cup Germany Tickets on our website at discounted prices.
Euro 2024 Belgium's Rebirth the New Generation Match the Golden Era.docxEticketing.co
The Golden Group is over. Can a new group step up? Two years ago, Kevin De Bruyne plunged Belgium’s Euro 2024 plans into disorder when he claimed the team was “too old” to win in an interview with The Protector. That Belgian squad had 10 players over 30 and the maximum average age of any Euro Cup 2024 team at the competition. A group-stage exit and just one goal at the World Cup put Belgium on course for a restructure.
We offer Euro Cup Tickets to admirers who can get Belgium vs Romania Tickets through our trusted online ticketing marketplace. Eticketing.co is the most reliable source for booking Euro Cup Final Tickets. Sign up for the latest Euro Cup Germany Ticket alert.
Belgium vs Romania Tickets | Euro Cup Tickets | Euro Cup Final Tickets
Coach Domenico Tedesco has managed a tactical shakeup and a regular exit for some of the oldest players. Experienced bests remain, not least the 37-year-old Jan Vertonghen in defense, the 32-year-old De Bruyne himself in midfield, and 31-year-old Romelu Lukaku up visible.
Still, younger actors like De Bruyne’s Manchester City partner Jeremy Doku bring fresh vitality to the team. Euro Cup Germany Qualifying unbeaten with just four goals allowed from eight games was a welcome sign of accomplishment back on track under Tedesco.
The only other squad in Group E besides Belgium to UEFA Euro 2024 qualify unbeaten, Romania was awestruck by winning a group that also checked Switzerland and Israel. Still, Euro 2024 will test a squad sorely lacking in top-level skill.
Euro 2024: Belgium's Transition from Golden Generation to New Hope
Tottenham guardian Vlad Dragusin is the only Euro Cup 2024 squad member singing regularly for one of Europe’s top clubs this flavor. He even played only nine Premier League games since adoption in January. Goalkeeper Horatiu Moldovan is a stoppage at Atletico Madrid.
There’s a link to the beauty days of Romanian soccer with midfielder Ianis Hagi, son of Gheorghe Hagi, who assisted the team to the rounds of the 1994 World Cup and Euro 2000.
We are only a combine of days away from the UEFA Euro 2024 curtain raiser. The 24 squads are winding up their provisions and getting ready to give it their all to life the wanted Euro Cup Final trophy on July 14. Spread across six clusters, the first hurdle in the knockout phase will be the plump of 16.
Euro fans worldwide can book Euro 2024 Tickets from our online platform, www.eticketing.co. Fans can book Euro Cup 2024 Tickets on our website at discounted prices.
Germany and Scotland will take things off before we get into overdrive in two weeks. Meanwhile, Belgium will be longing to bounce back after a horrendous 2022 FIFA World Cup movement, which ended in the group stage.
Belgium vs Romania Tickets | Euro Cup 2024 Tickets | Euro Cup Tickets | Euro Cup Final Tickets
Roberto Martinez completed the way for Domenico Tedesco, who has overseen a compact start to his tenure. The 38-year-old will be assured heading into the group stage
Belgium vs Romania Ultimate Guide to Euro Cup 2024 Tactics, Ticketing, and Qu...Eticketing.co
Euro Cup 2024 fans worldwide can book Belgium vs Romania Tickets from our online platform www.eticketing.co. Fans can book Euro Cup Germany Tickets on our website at discounted prices.
Here are our Euro 2024 predictions for the group stages
Will England make it through the group stages?, Will Germany use the home advantage to full effect?
Follow our progress, see how many we get right
If you want to join in let us know before the first game kick off and we can invite you to our private league
or join in with our friends at DeeperThanBlue
https://www.linkedin.com/posts/activity-7204868572995538944-qejG
https://www.selectdistinct.co.uk/2024/06/13/euro-2024-match-predictions/
#EURO2024 #Germany2024 #England #EURO2024predictions
Croatia's UEFA Euro 2024 Puzzle of Experience versus Youth.docxEuro Cup 2024 Tickets
The Netherlands kicked off their Euro Cup 2024 campaign on Sunday against Poland but will have to navigate the tournament without two pivotal players Frenkie de Jong and Teun Koopmeiners
Poland vs Netherlands UEFA Euro 2024 Poland Battles Injuries Without Lewandow...Eticketing.co
UEFA Euro 2024 fans worldwide can book Poland vs Netherlands Tickets from our online platform www.eticketing.co. Fans can book Euro Cup Germany Tickets on our website at discounted prices.
Luciano Spalletti Leads Italy's Transition at UEFA Euro 2024.docxEuro Cup 2024 Tickets
Italy are the defending European champs, but after Luciano Spalletti swapped Roberto Mancini last September, they are still taking the cautious first steps of a new era
Turkey vs Georgia Tickets: Turkey's Provisional Squad for UEFA Euro 2024, Key...Eticketing.co
Euro Cup Germany fans worldwide can book Euro 2024 Tickets from our online platform www.eticketing.co.Fans can book Euro Cup 2024 Tickets on our website at discounted prices.
Turkey UEFA Euro 2024 Journey A Quest for Redemption and Success.docxEticketing.co
We offer Euro Cup Tickets to admirers who can get Turkiye vs Georgia Tickets through our trusted online ticketing marketplace. Eticketing.co is the most reliable source for booking Euro Cup Final Tickets. Sign up for the latest Euro Cup Germany Ticket alert.
Matka BOSS Result | Satta Matka Tips | Kalyan Matka 143dpbossdpboss69
Satta BOSS Matka | DpBoss Matka | Matka BOSS Result | Satta Matka Tips | Kalyan Matka 143 · SATTA KING · ➥ SATTA MATKA TIME TEBAL · SATTA KING · ➥ Weekly ...
2. What is a map?
A map is simply a plan of the ground on paper. The plan is usually
drawn as the land would be seen from directly above.
A map will normally have the following features:
• The names of important places and locations.
• Standard symbols to show the location of key landmarks and features.
• A key, or a legend, to explain what the symbols on the map mean.
• A scale and scale bar to allow you to measure distance on the map and
convert it to the actual distance on the land.
• A grid system of lines to allow you to pinpoint your location, orientate
your map to the land and quickly estimate distances.
• Contour lines to show relief (the height of the ground above sea level)
and the steepness of the land.
3. Understanding your map 1. The basics
There are some basic features that most maps will include:
• Roads tend to be marked in different colours depending on the type
of road depicted. Roads on a map range from thick blue lines, showing
motorways, to dashed lines, indicating an unfenced minor road.
• Footpaths are marked on Ordnance Survey maps in various colours. On a
1:25 000 scale OS Explorer Map the public rights of way are marked in green
and on a 1:50 000 scale OS Landranger Map they are marked in magenta.
There are various types of public rights of way and public access, so please
check the map key for full information. It is important to be aware that
footpaths that are shown in black are not necessarily public rights of way.
• Woods are shown in green with a coniferous or non-coniferous tree shape
printed over the top.
• Buildings are marked by small black squares. However, some particular
buildings have their own special symbols, such as churches and windmills.
Any of these buildings can be useful landmarks, helping you to check your
position on the map.
• Rivers and streams are shown as blue lines. The width of the line is
representative of the watercourse width (if the width of a river is more
than 8 metres it is shown as two blue lines with a light blue area between).
Rivers and streams can be extremely useful in determining your position
on a map.
• Scale tells you how much the land has been scaled down to fit on the
paper. If the scale of a map is 1:50 000 then everything on the map will be
50 000 times smaller than it is in reality.
• Your Ordnance Survey map will also contain other features and information
that will be explained, along with the features above, in the key of the map.
4. Understanding your map 2. Grid lines explained
Ordnance Survey maps are covered in a series of faint blue lines that make
up a grid. The lines have numbers accompanying them that allow you to
accurately pinpoint your location on a map. Once you have located where you
are, the grid system makes it simple to give others (such as mountain rescue)
an accurate description of your location. This description, which will be a series
of numbers, is known as a grid reference.
Grid references
Before you begin to look at grid
references it is important to be aware
that all the numbers going across the
face of the map, for example, left to
right, are called eastings (this is because
they are heading eastward), and similarly,
all the numbers going up the face of
the map from bottom to top are called
northings (again because they are
heading in a northward direction).
There are two main types of grid reference:
• 4-figure – for example, 1945, this indicates a single kilometre square on
an Ordnance Survey map.
• 6-figure – for example, 192454, shows a point within a square.
4-figure map references
When giving a 4-figure grid reference you
should always give the eastings number
first and the northings number second,
very much like when giving the reading
of a graph in school – you must go along
the corridor/hallway (horizontal) and then
up the stairs (vertical).
For example, the number 2 in the
diagram opposite is 19 across and 45 up
and therefore the 4-figure grid reference
is 1945.
The numbered squares on the diagram above would have the following
4-figure grid references:
1 = 18 45 2 = 19 45
3 = 18 44 4 = 19 44
6. Understanding your map 3. Reading contours and relief
Understanding the shape of the land by looking at a map is a very useful skill
and can be essential if you’re going to be walking in mountainous terrain. The
height and shape of the land is shown on a map using ‘contour lines’. These
lines appear as thin orange or brown lines with numbers on them. The number
tells you the height above sea level of that line.
A contour line is drawn between points of the same height, so any single contour
line will be at the same height all the way along its length. The height difference
between separate contour lines is normally 5 metres, but it will be 10 metres in
very hilly or mountainous areas. The map key will tell you the contour interval used.
The picture shown illustrates how a landscape can be converted into contour
lines on a map. An easy way to understand and visualise contour lines is to
think of them as high tide lines that would be left by the sea. As the water level
drops it would leave a line every 10 metres on the landscape. These marks
would be contour lines.
Being able to visualise the shape of the landscape by looking at the contour lines
of a map is a very useful skill that can be developed with practice. It will allow
you to choose the best route for your journey. When reading contour lines on
a map it’s helpful to remember the numbering on them reads uphill. It might be
useful to imagine that to read contour line numbers you have to be stood at the
bottom of the hill looking up it, otherwise the numbers would be upside down.
Other useful things to look out for when reading contour lines are rivers, which
usually flow into valleys, or areas with very few contour lines, which will be flat.
7. The picture below shows how contour lines can be used on maps to
describe different landscapes. Even though all the lines look similar at first,
they are describing very different landscape features. The closer together
the contour lines, the steeper the slope of the hill. If a hill is very steep the
contour lines might even merge into each other.
A spur is a ‘V’-shaped hill that juts out. A simple way to tell a valley from
a spur when looking at contour lines is to remember that if the ‘V’ points
uphill it’s a valley, if it points downhill it’s a spur.
8. Understanding your map 4. Orienting your map
Now you have the skills and knowledge to read and understand a map, the
next step is to learn how to orientate your map to the land so that you can use
it to navigate. One of the best ways to orientate your map is with a compass.
The picture below shows a compass, explaining its various features.
1 The base plate
The mounting of the compass, with a ruler for measuring scale.
2 The compass housing
Contains the magnetic needle and has the points of the compass printed
on a circular, rotating bezel.
3 The compass needle
Floats on liquid so it can rotate freely, the red end should always point to
magnetic north.
4 Orienting lines
Fixed within the compass housing and designed to be aligned with the
eastings on a map. On some compasses half the lines are coloured red to
indicate north.
5 Orienting arrow
Fixed within the compass housing, aligned to north on the housing.
6 The index line
Fixed within the outer edge of the compass housing as an extension of
the direction of travel arrow. It marks the bearing you set by rotating the
compass housing.
7 The direction of travel arrow
Shows the direction that you want to travel along or the bearing you are
taking. It is fixed parallel to the sides of the base plate.
8 Compass scale
Displayed along the edge of the base plate so you can measure distances
on maps.
9. Understanding your map 5. Using your compass
Decide on the route of your
walk and identify your starting
point on the map. Place
your compass on the map.
Make sure the ‘direction of
travel arrow’ is pointing in the
direction of your route across
the map. The easiest way to
line the arrow is to place the
side of the base plate so it
crosses your starting point
and the next destination of
your journey.
Carefully holding the compass
base plate still, you will
need to turn the compass
housing so the index line and
orientating lines match up
with the eastings (the vertical,
north–south lines) on your
map. Holding the map flat and
the compass still, you need to
rotate your body so that the
compass needle settles in line
(opposite) with the index line.
To fully orientate your map
you will need to make some
adjustments for magnetic
variation.
Adjustments for magnetic variation
One thing to remember is that your compass does not point to the true north
– except by coincidence in some areas. The compass needle is attracted by
magnetic force, which varies in different parts of the world and is constantly
changing.
The magnetic variation throughout Great Britain currently ranges from 2º to 6º.
The amount of variation changes every year, so check your Ordnance Survey
map to work out the most current value.
You can properly orientate the map by carefully turning the compass housing 4º
clockwise (for example, depending on where you are in Great Britain) and then
turning your body again to realign the magnetic needle with the index line. Your
map is now oriented to the north.
10. A word of caution
Compass readings are also affected by the presence of iron and steel objects,
so be sure to look out for – and stay away from – pocket knives, belt buckles,
railroad tracks and so forth when using your compass.
Using land features
As an alternative to using a compass to orientate your map, you can
use your eyesight. This method will only work if you are in an area with
visible prominent features or landmarks.
First, locate yourself next to a feature or landmark and place your finger
on the map at the point where you are standing. Then begin to rotate
the map so that other features and landmarks on the map begin to line
up with the actual ones you can see. The map is now orientated with the
land, although not as accurately as it would be using a compass.
11. And finally...
OK, so now you know how to understand and read a map, you’re ready
to get yourself out and about. But before you put on your boots and pack
your rucksack, take the time to read through the following handy tips
and safety points to ensure you get the most from your adventures.
1. Pre-plan your route
Before you set out, take the time to plot your route – mark your chosen route on
your map. This will ensure your eyes are immediately drawn to the correct part
of the map, otherwise you may find yourself having to spend a considerable
amount of time continuously searching for your location. If it’s your first
expedition with a map and compass, start with a short route in an area you’re
familiar with. You could identify a new route within this to help you build your
map-reading skills – remember, don’t set yourself unrealistic challenges.
2. Make sure you have the right equipment
• A map of the area you are exploring, and map case will help to protect your
map from bad weather.
• A compass with a base plate – the longer the better; shorter ones may
frustrate you when orientating the map – and a circular, rotating housing.
• A pencil, in case you decide to plan and orientate a new route.
• A watch, to make sure that you can keep track of time, and finish your walk
on time.
• And enough food and water to see you through your journey.
• Check the weather forecast in advance. This will allow you to plan for
changes in weather patterns so you have appropriate clothing with you – it
may be fair when you set out but could rapidly change to rain or fog.
3. Tell someone where you’re going
Always remember to tell either a family member or a friend where you’re going
and when you expect to be back.
4. Abide by the Countryside Code
• Be safe – plan ahead and follow any signs.
• Leave gates and property as you find them.
• Protect plants and animals, and take your litter home.
• Keep your dog under close control.
• Consider other people.
5. Have fun
Getting out and about is all about having fun and enjoying yourself.
So go for it!