Downloaded 205 times

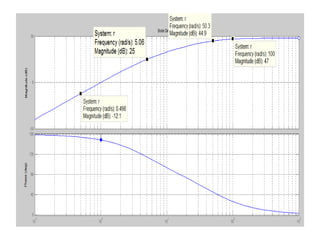
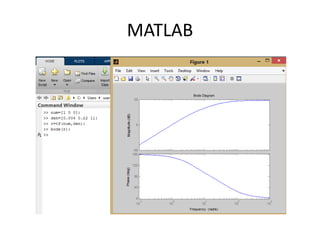
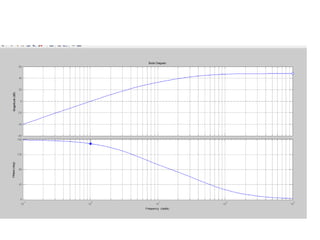
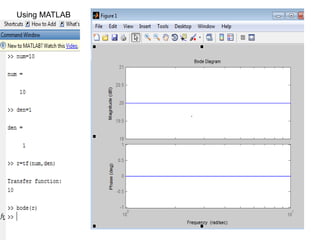
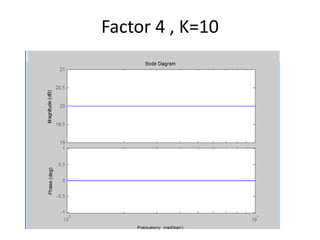
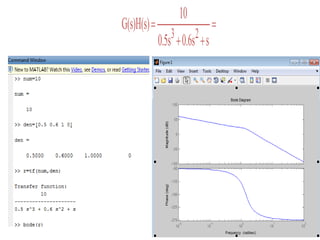
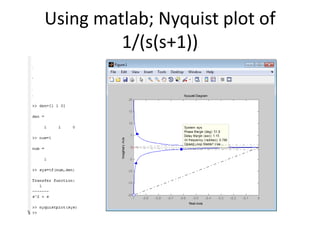
![Using Matlab
s0.6s0.5s
10
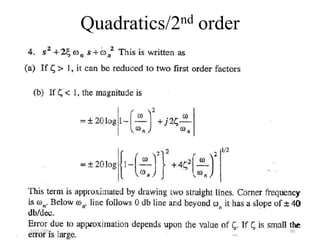
G(s)H(s)
23
Num=10
Den=[0.5 0.6 1 0 ]
r=tf(num,den)
Bode(r)
commands](https://image.slidesharecdn.com/wk12frbodeplotnyquistmay92016-160530081256/85/Wk-12-fr-bode-plot-nyquist-may-9-2016-70-320.jpg)

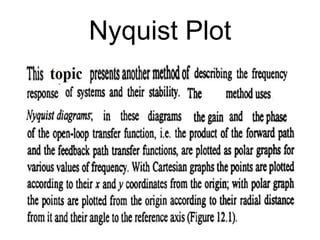
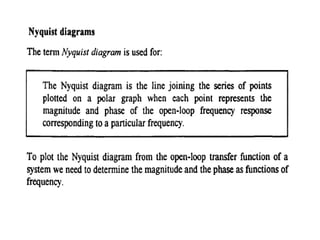
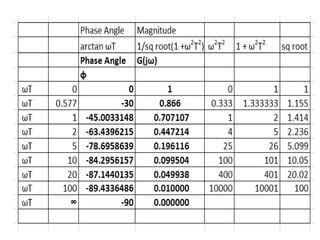
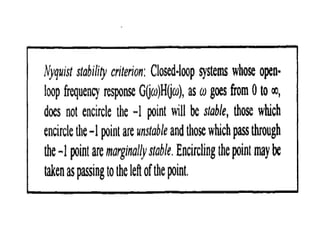
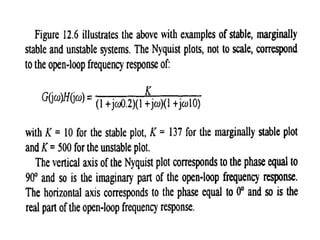
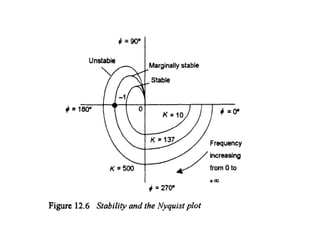
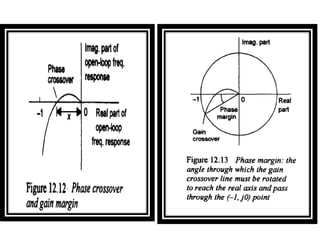
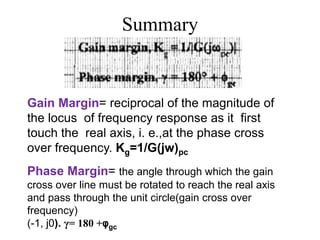
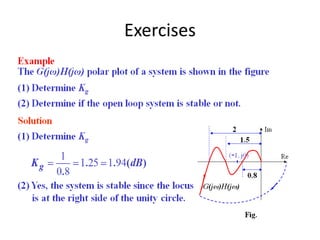
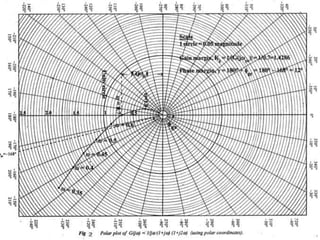
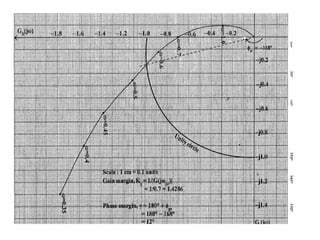


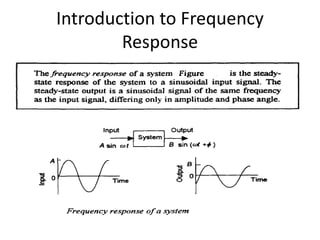
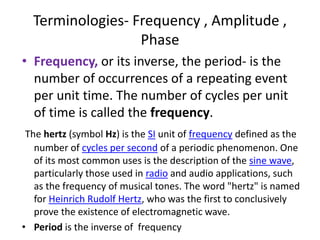
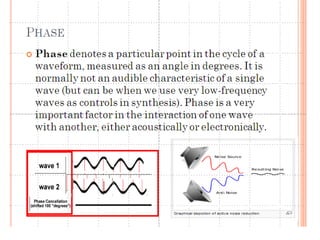
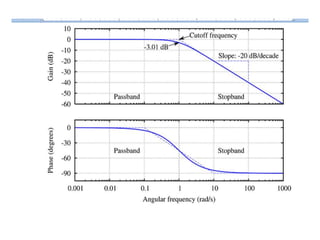
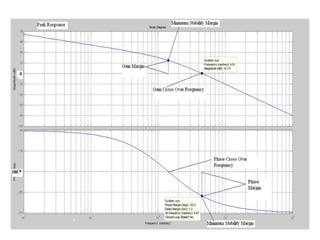
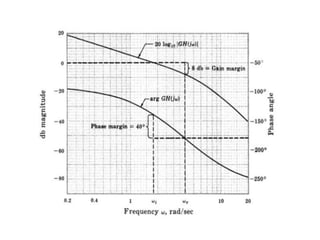
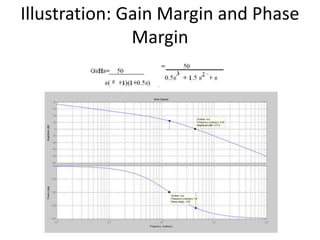
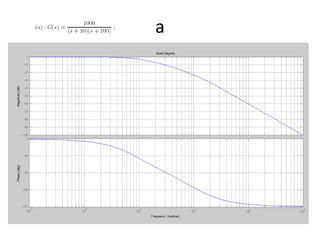
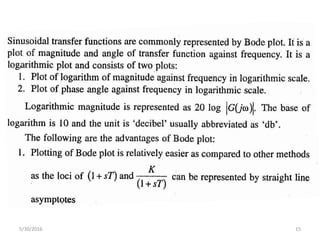
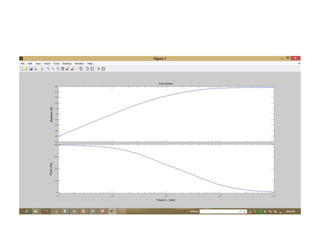
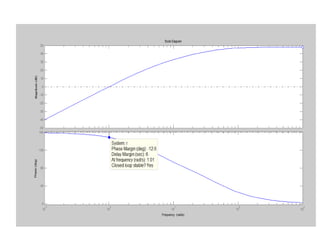
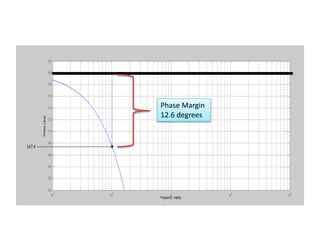
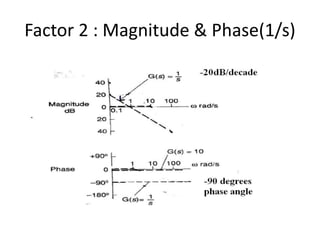
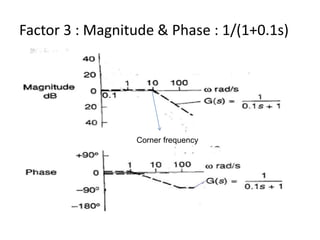
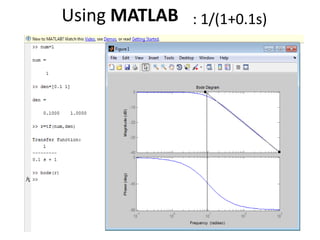
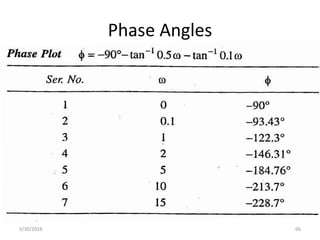
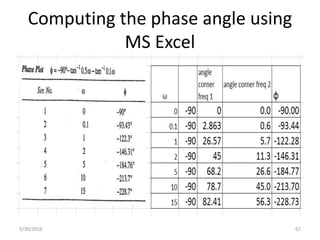
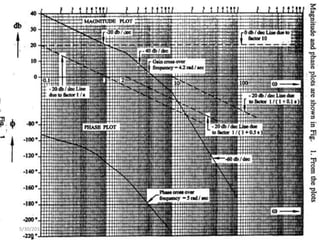
This document discusses frequency response analysis and Nyquist stability criterion. It begins with introductions to frequency, amplitude, phase, and Bode plots. A Bode plot shows the magnitude and phase of a system's frequency response on logarithmic scales. Key points include the gain and phase crossover frequencies. The document then covers Nyquist plots, which show the system's frequency response in the complex plane. The Nyquist stability criterion uses Nyquist plots to determine stability by examining where the plot intersects the real axis. Gain and phase margins are stability metrics calculated from the frequency response. MATLAB is demonstrated for constructing Bode and Nyquist plots. Homework involves populating tables of frequency response data and making plots.