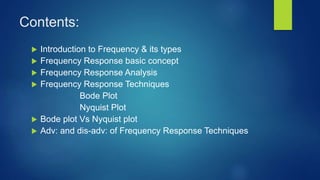
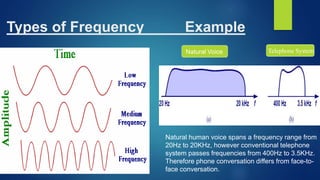
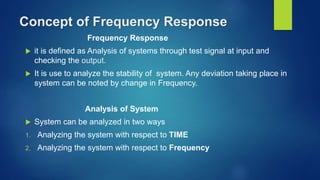
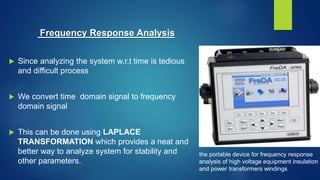
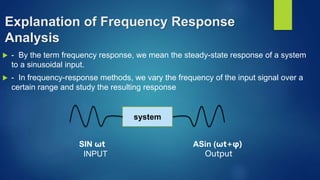
1. The document discusses frequency response analysis techniques, which analyze how a system responds to input signals of varying frequencies.
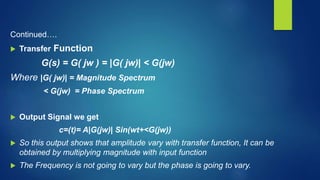
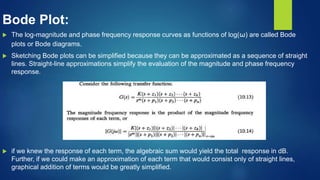
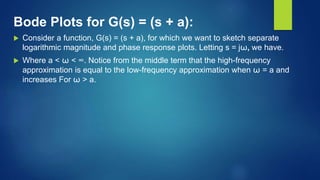
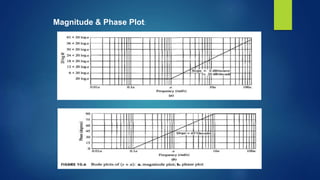
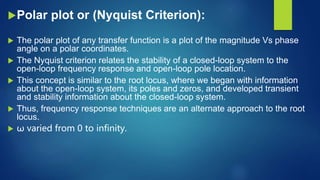
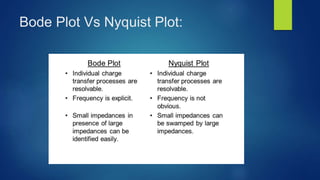
2. It describes two common frequency response techniques - Bode plots, which show magnitude and phase response as functions of frequency, and Nyquist plots, which plot magnitude against phase on a polar graph.
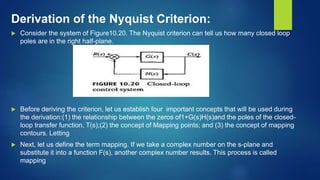
3. The techniques provide insights into system stability and dynamics and are useful for control system design, but their use requires complex derivations and they do not always directly indicate transient response characteristics.