Download as PDF, PPTX

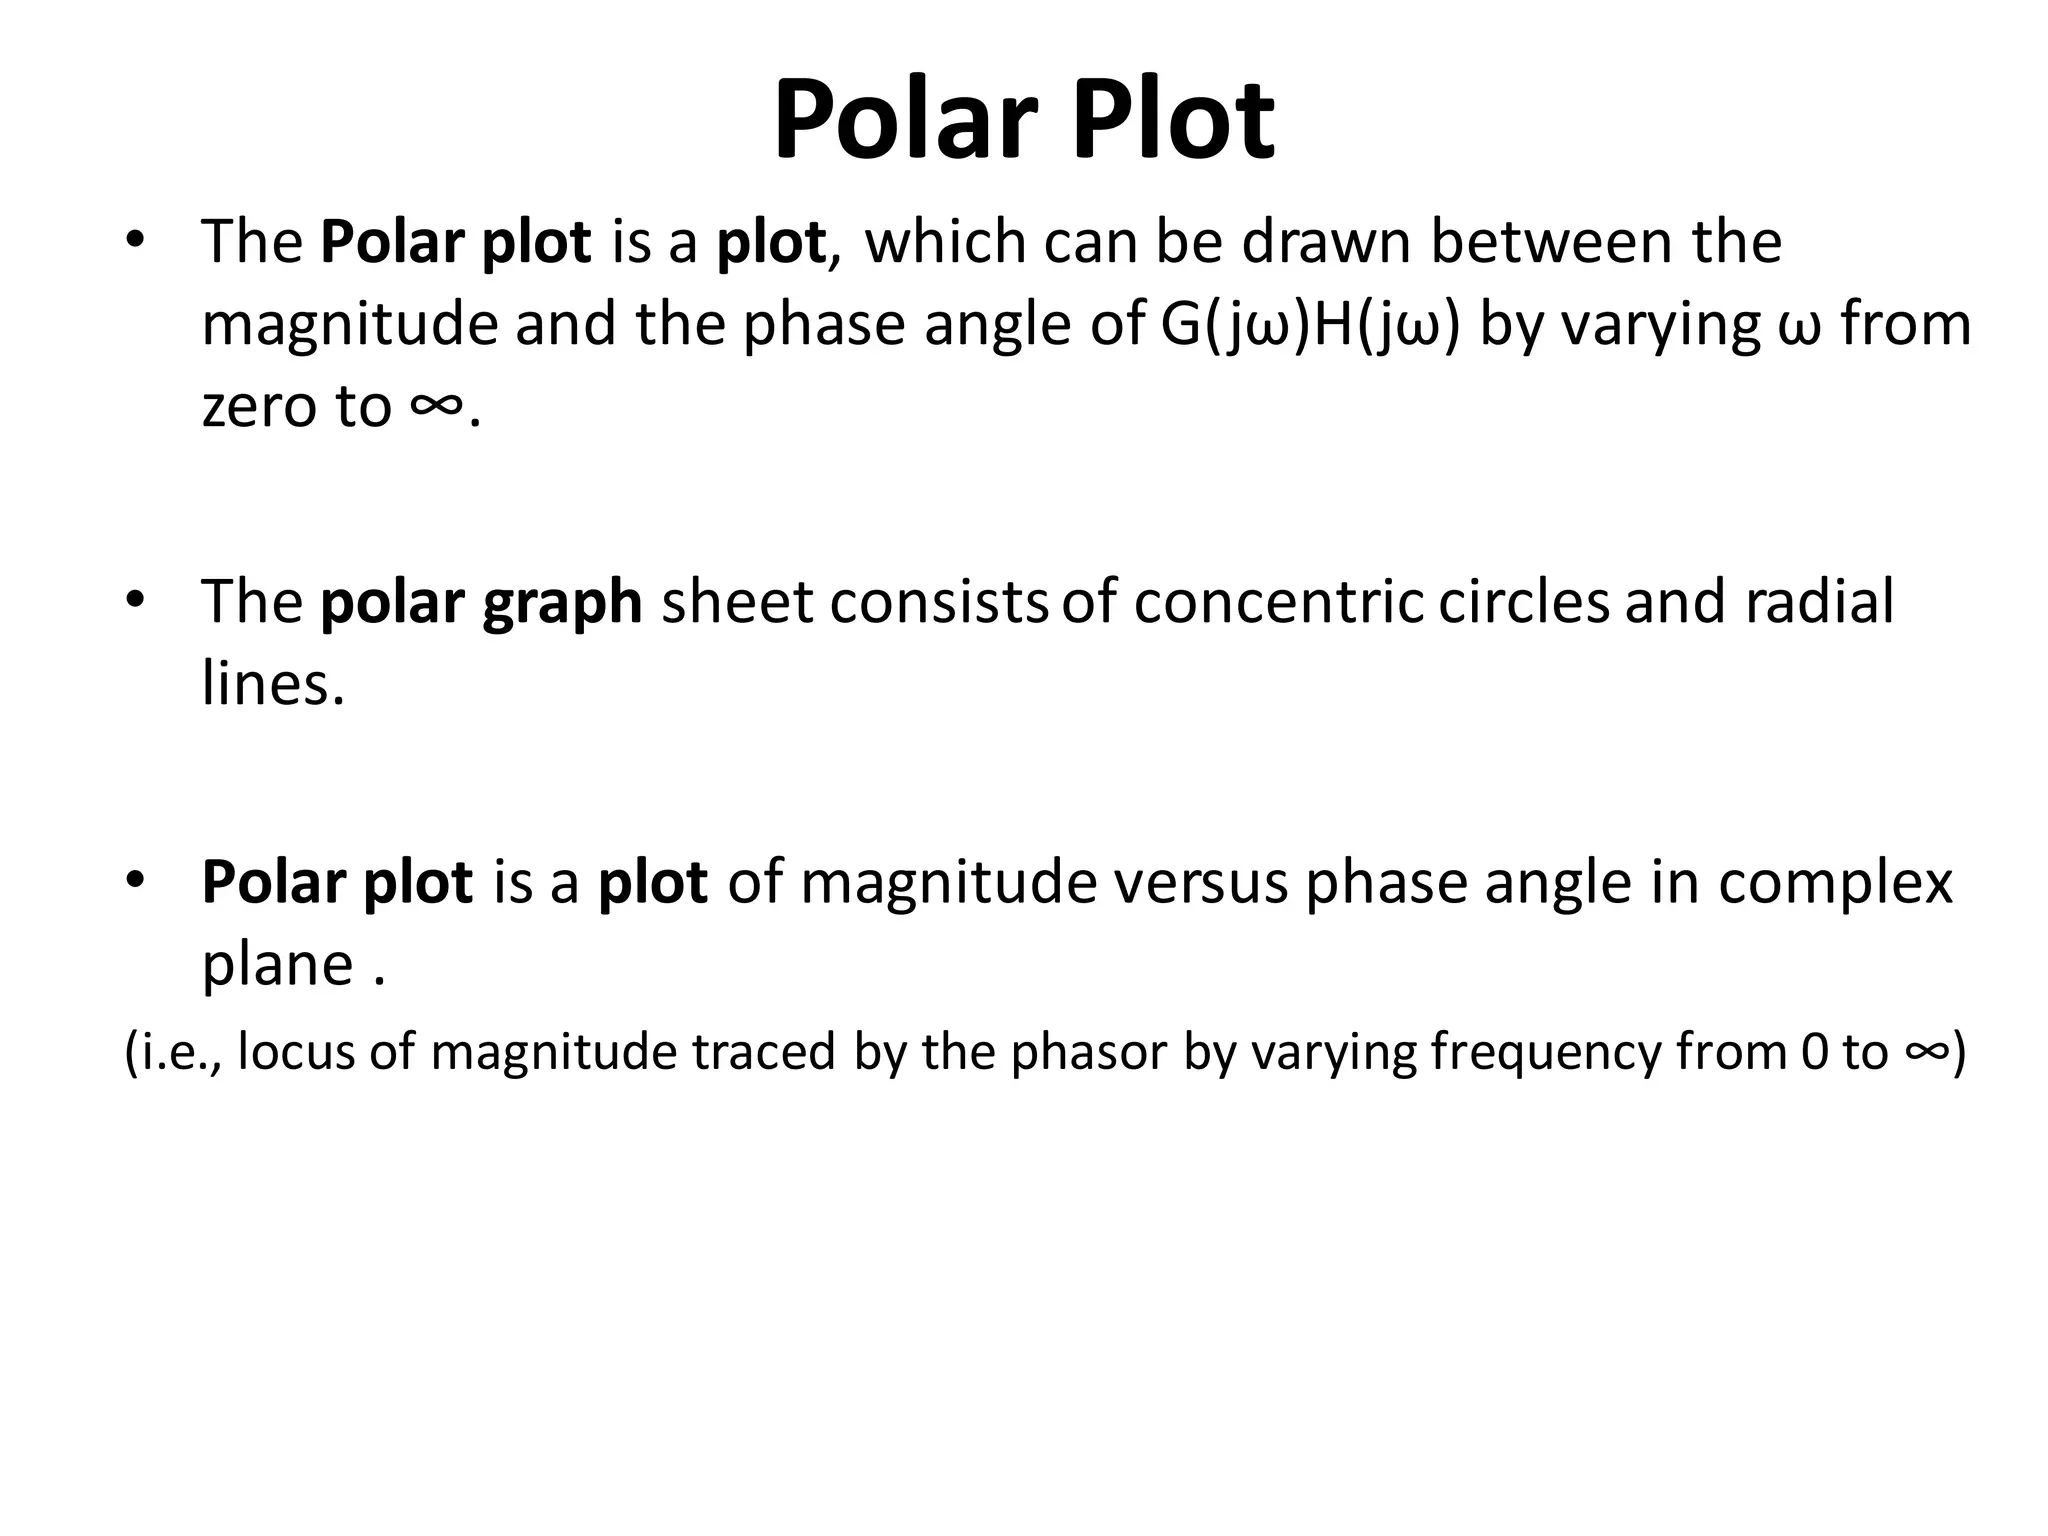


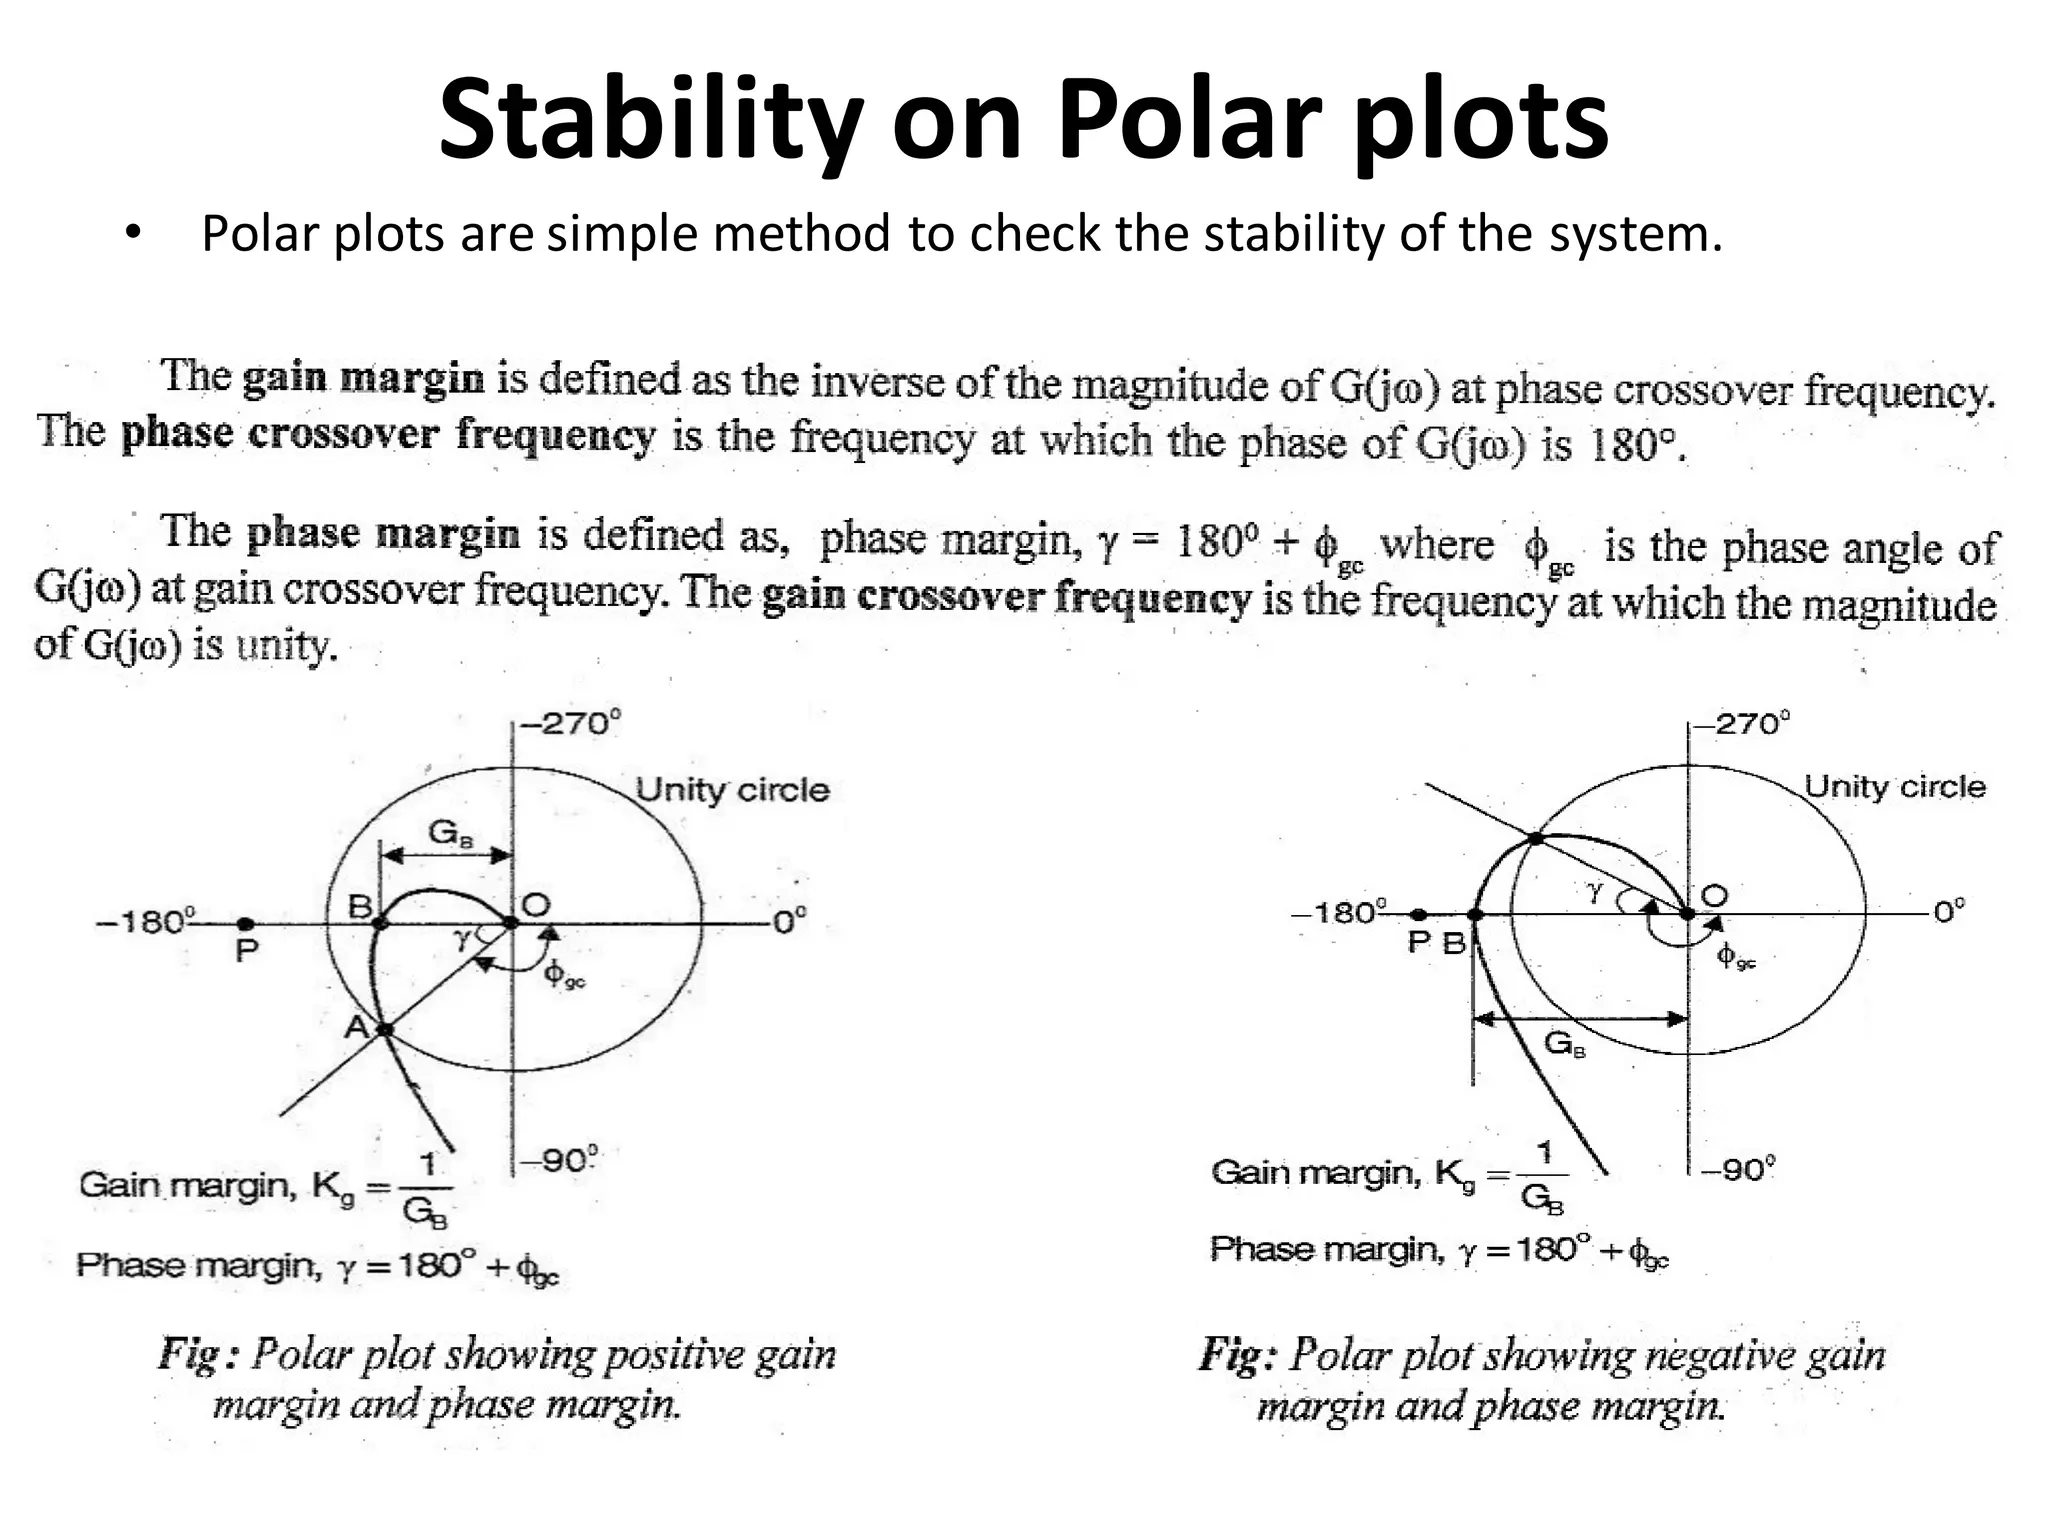


The document discusses polar plots, which represent the frequency response of a transfer function by plotting magnitude versus phase angle in the complex plane. It outlines the advantages and disadvantages of polar plots, as well as the basic procedure for constructing them from a transfer function. Additionally, it provides examples demonstrating how to sketch polar plots for different transfer functions and their implications for system stability.