Downloaded 337 times
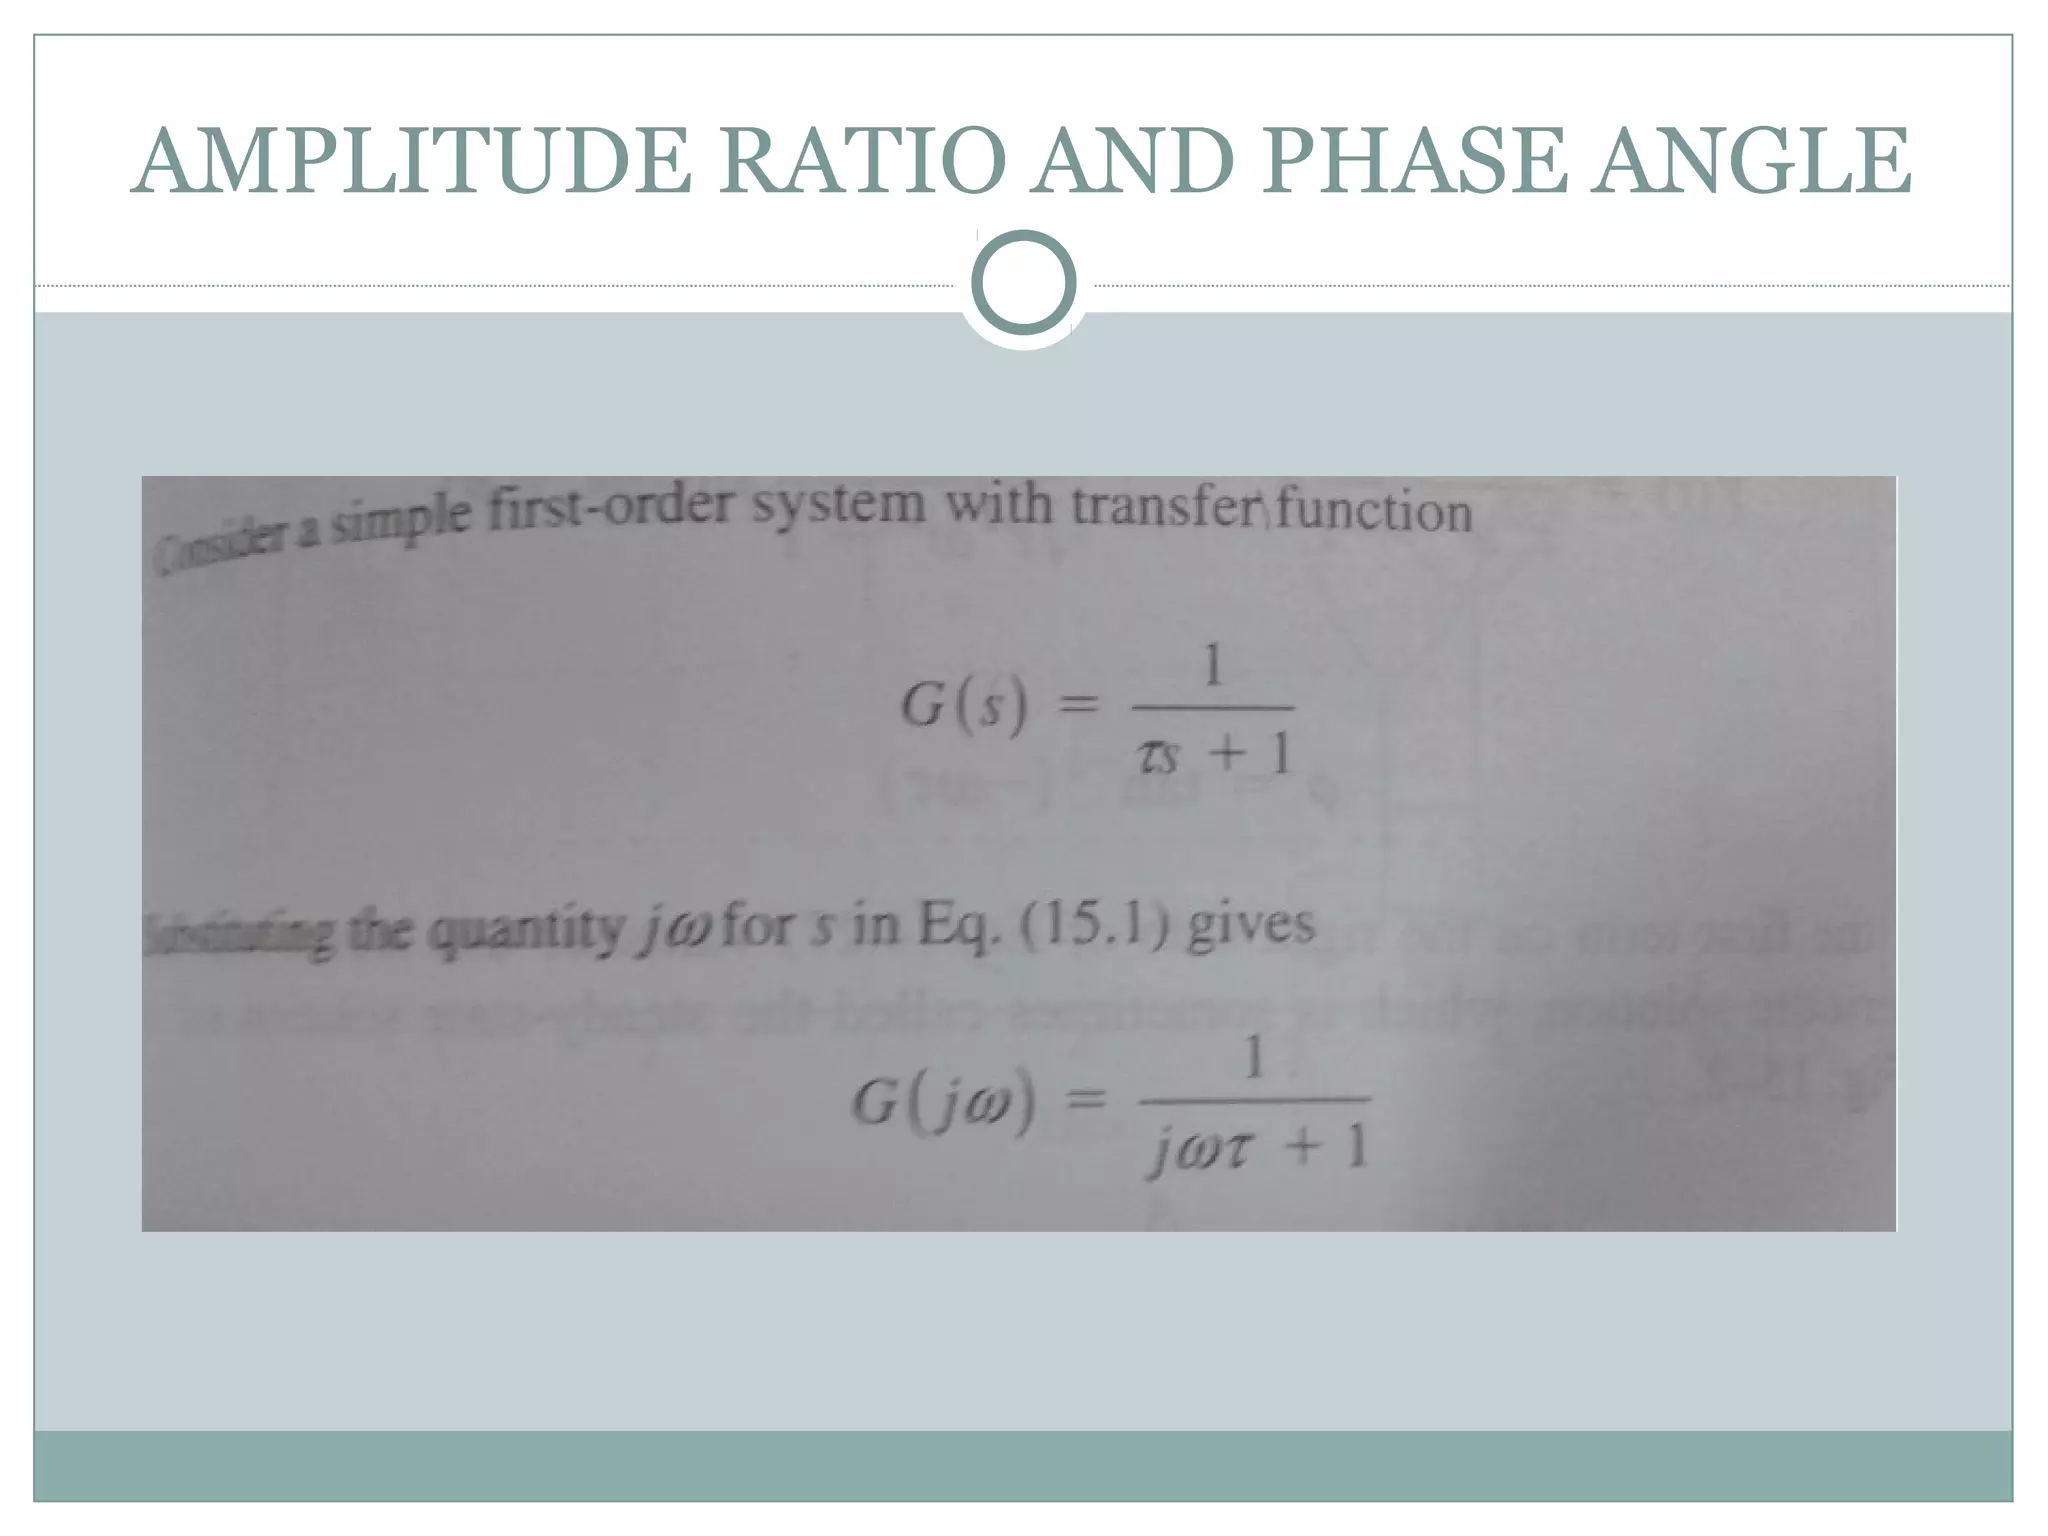
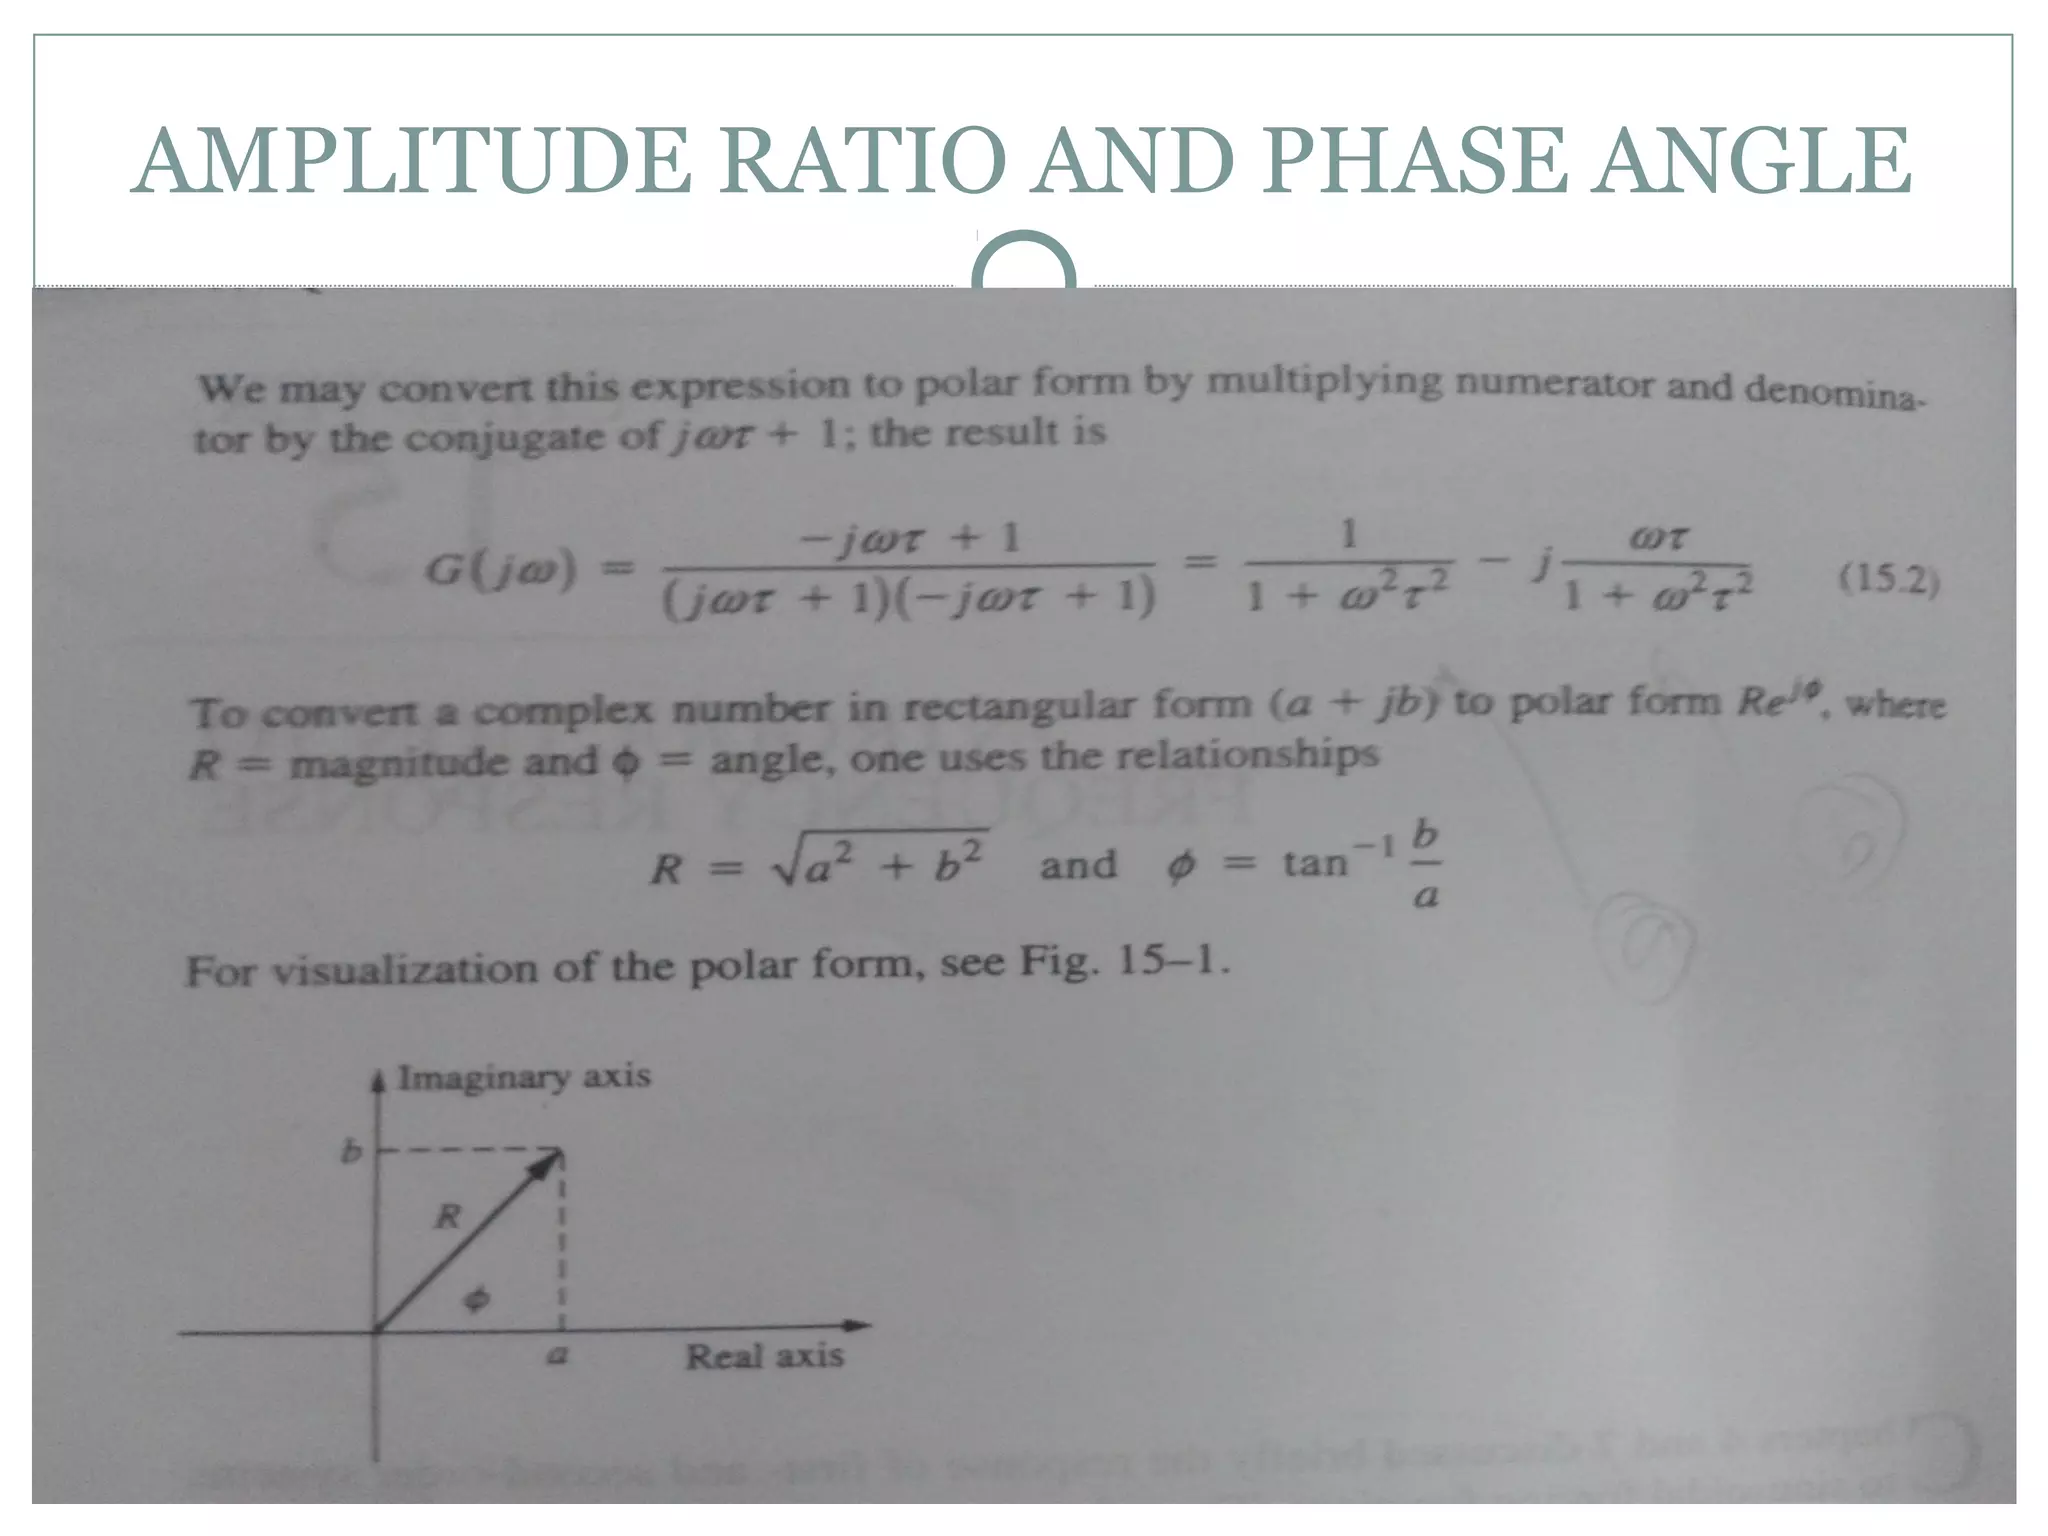
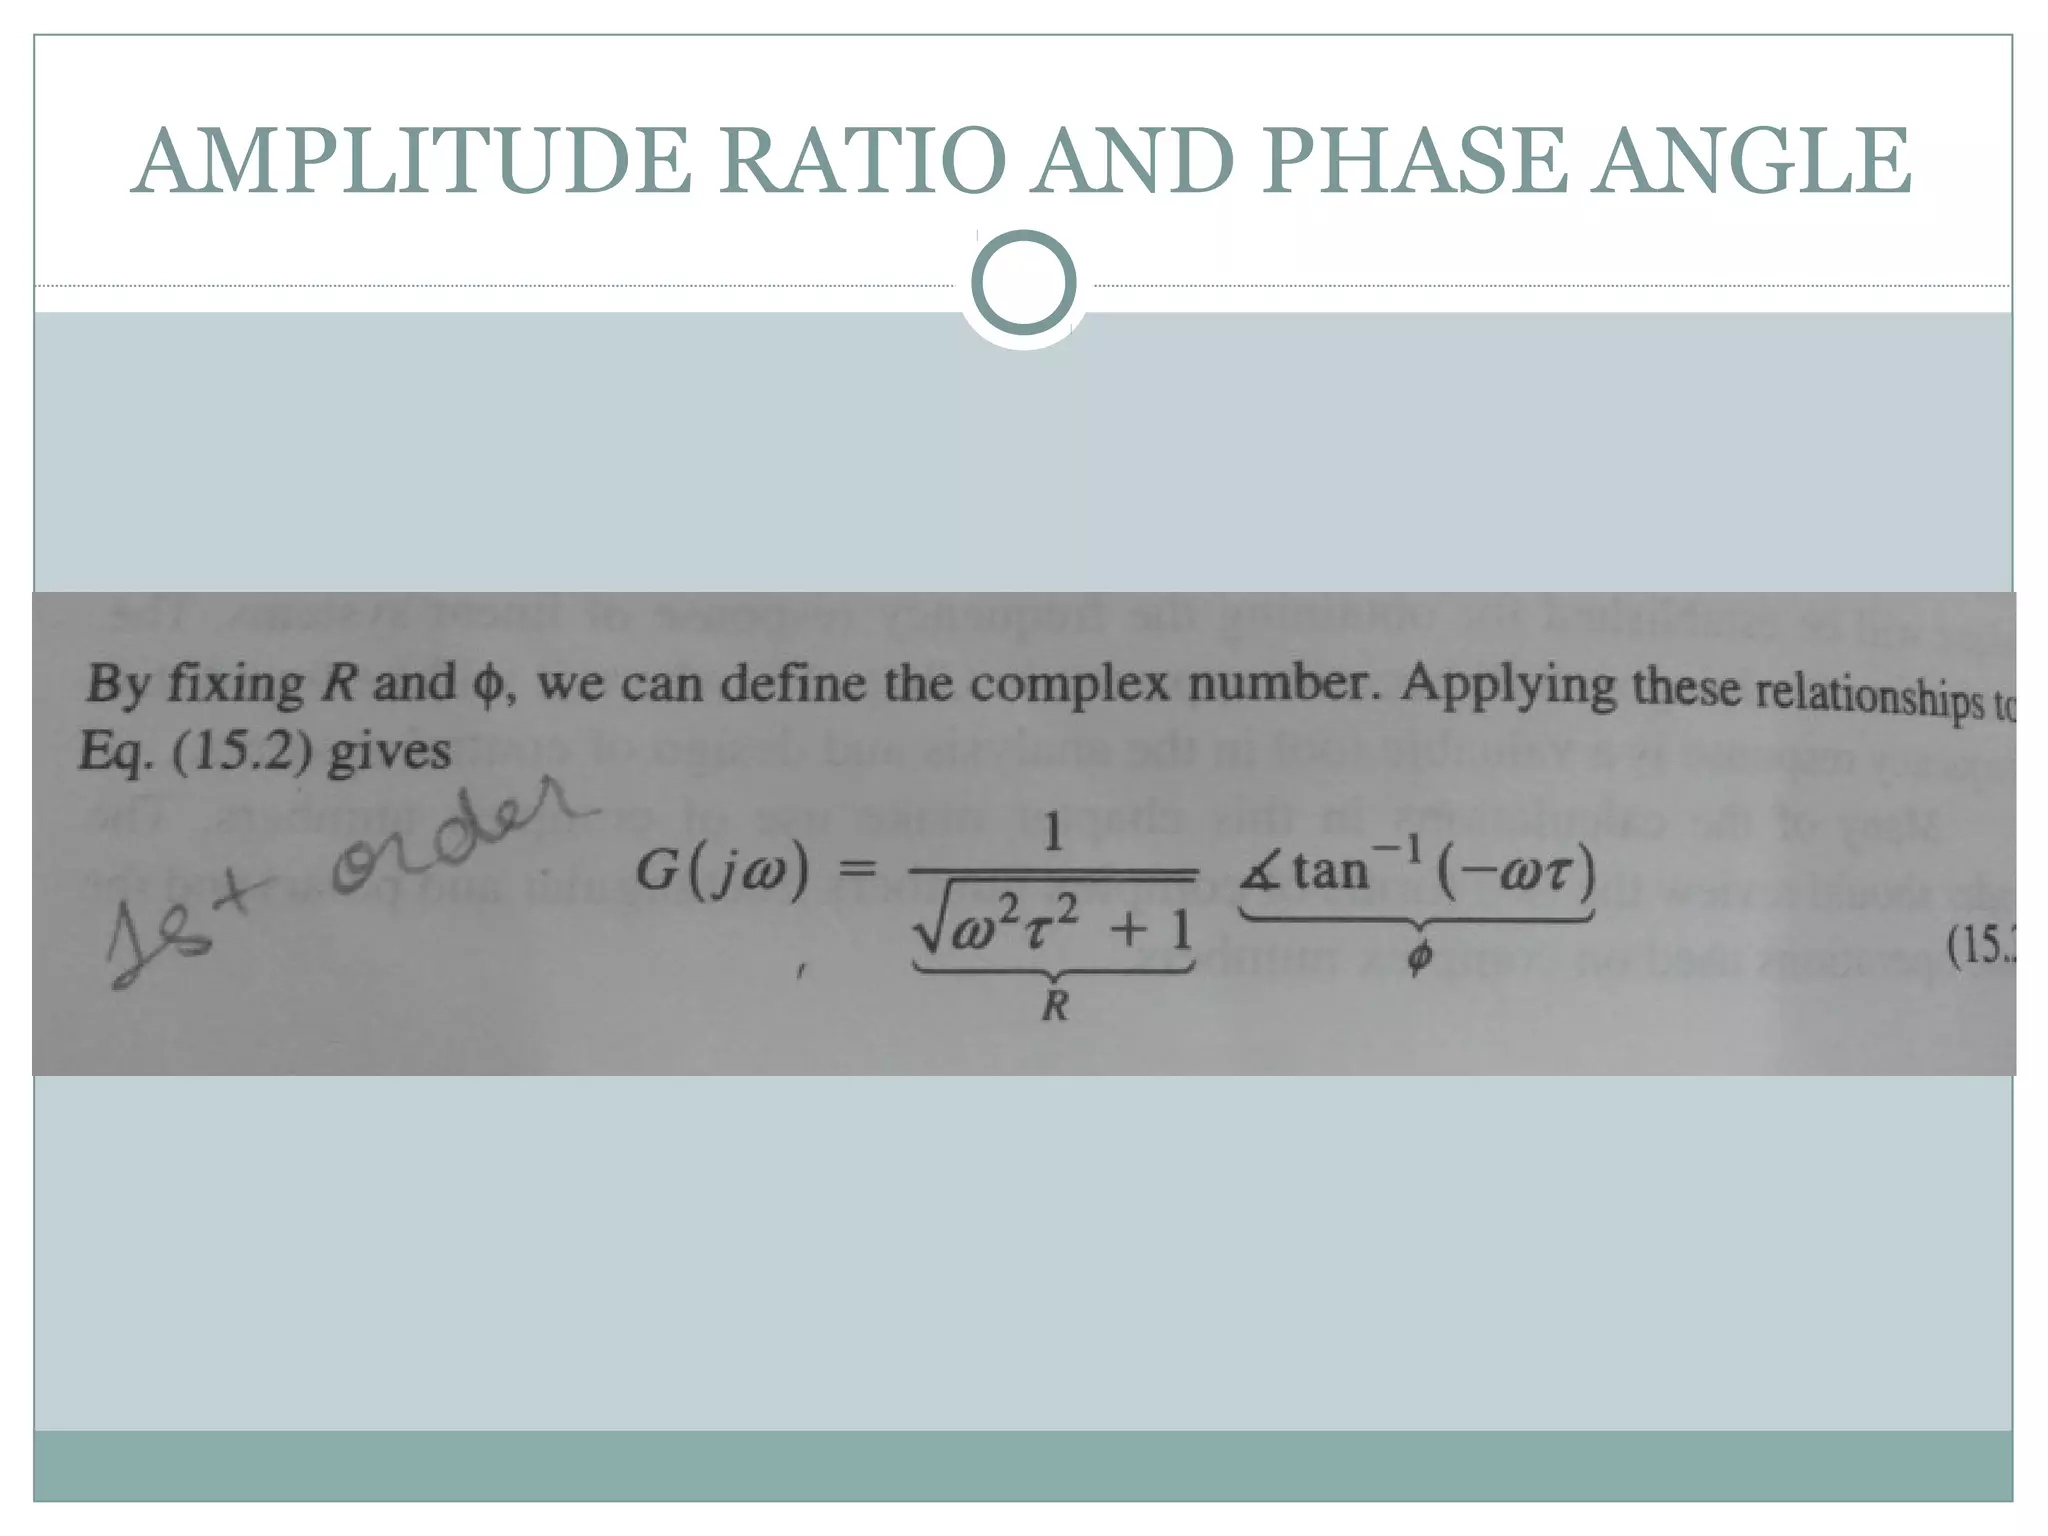
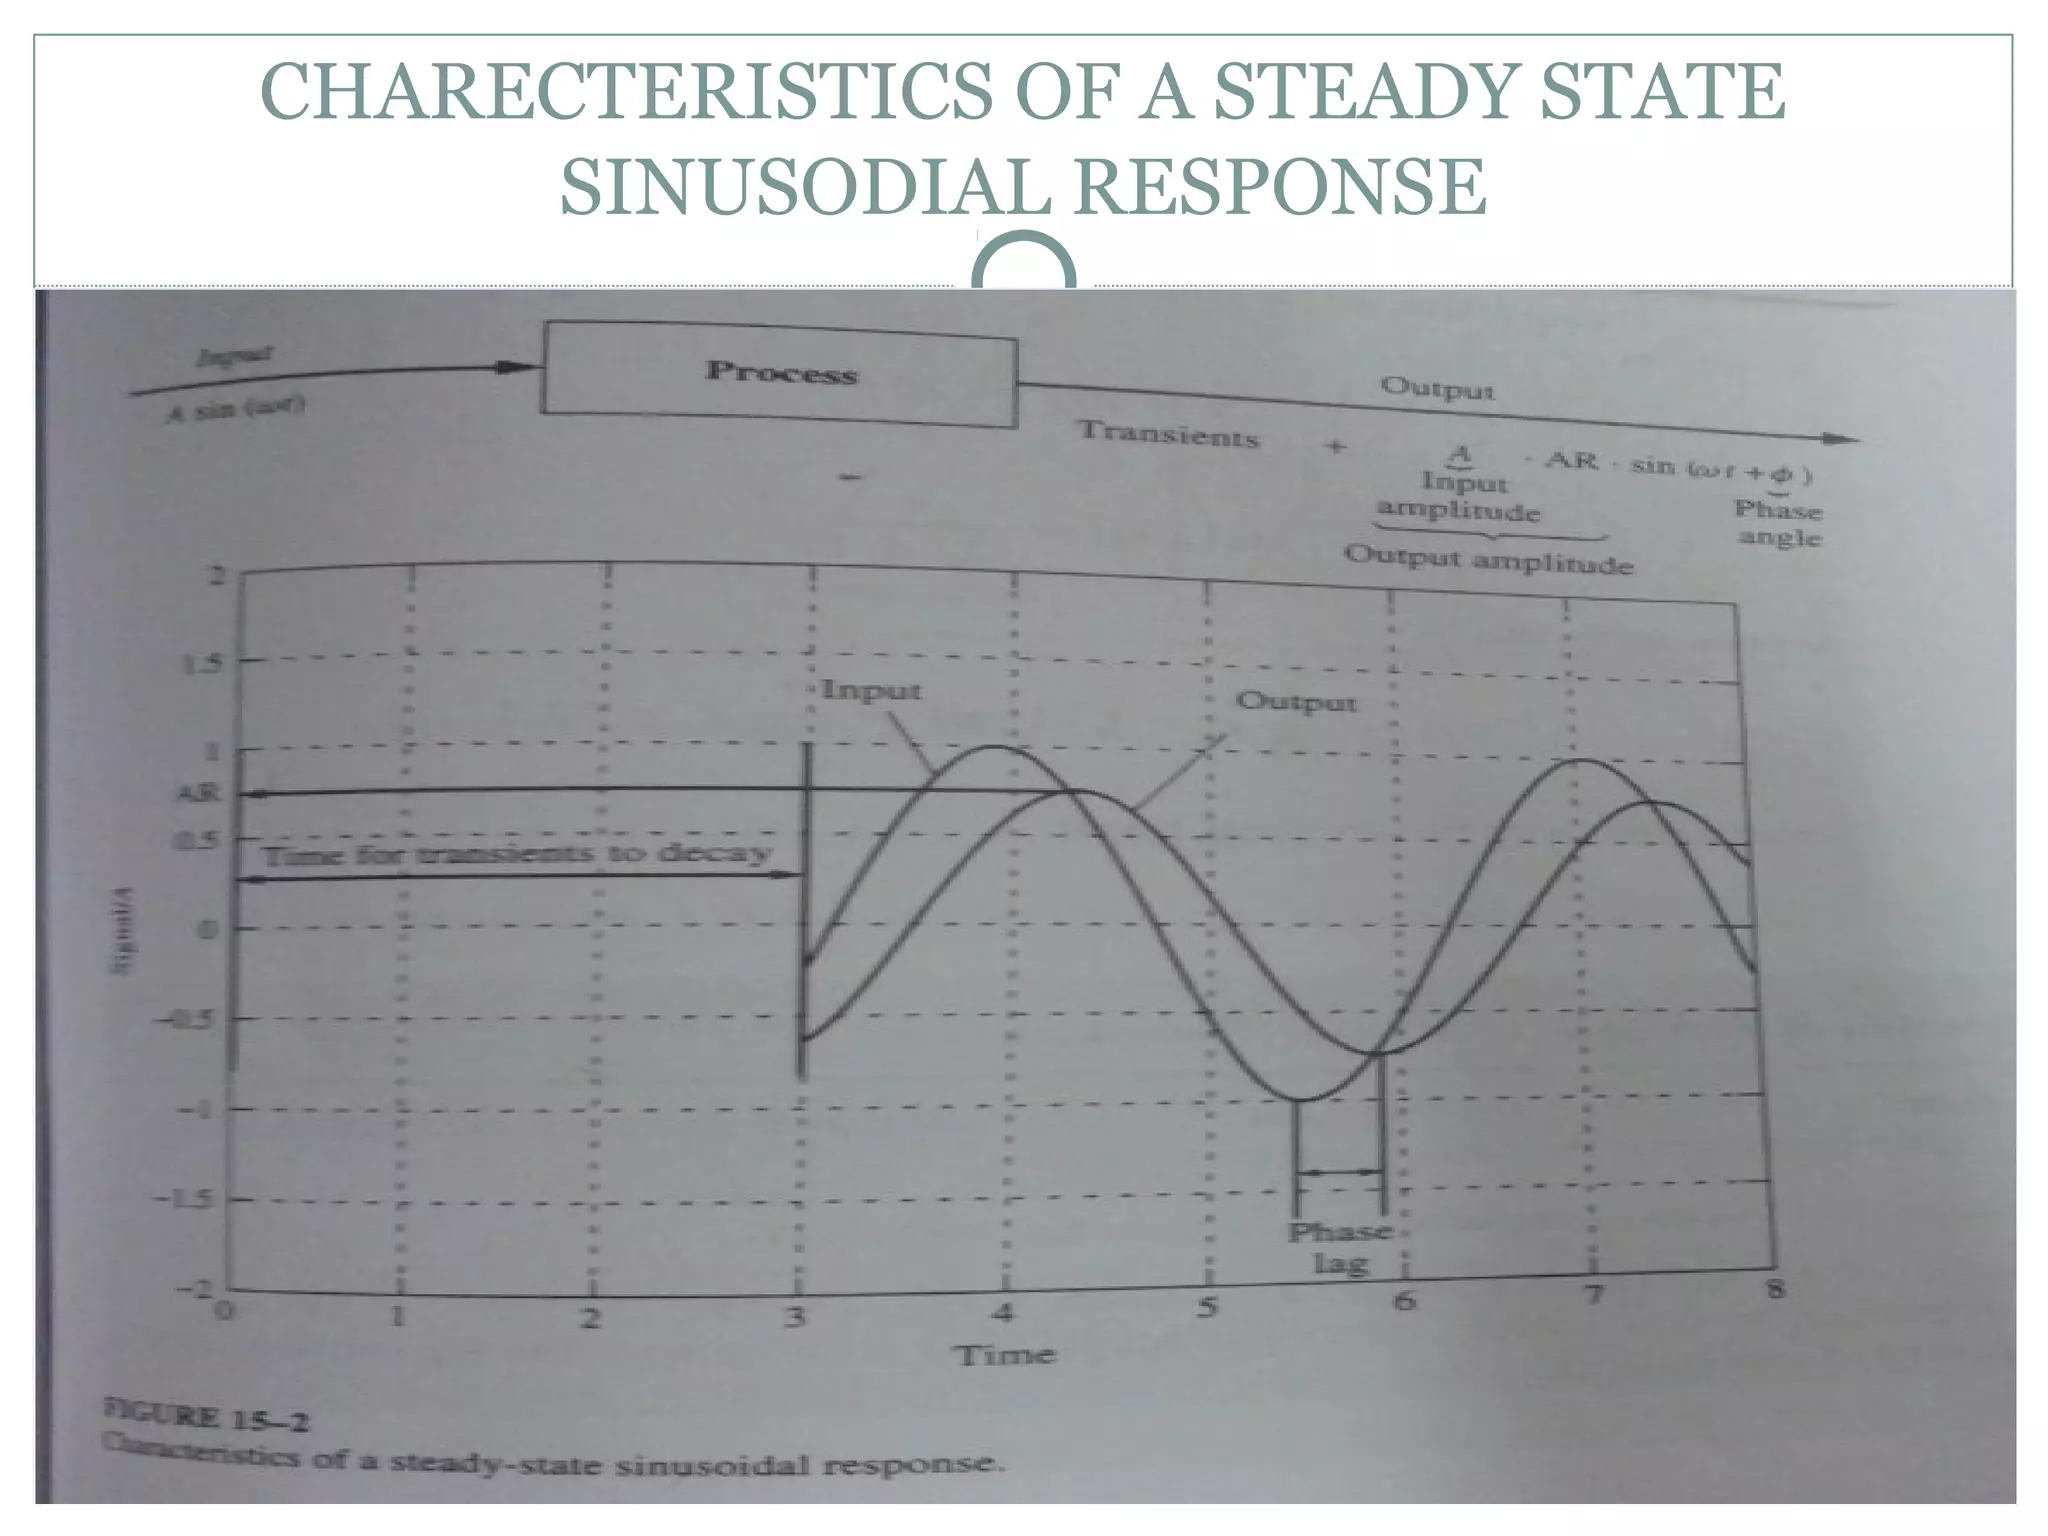
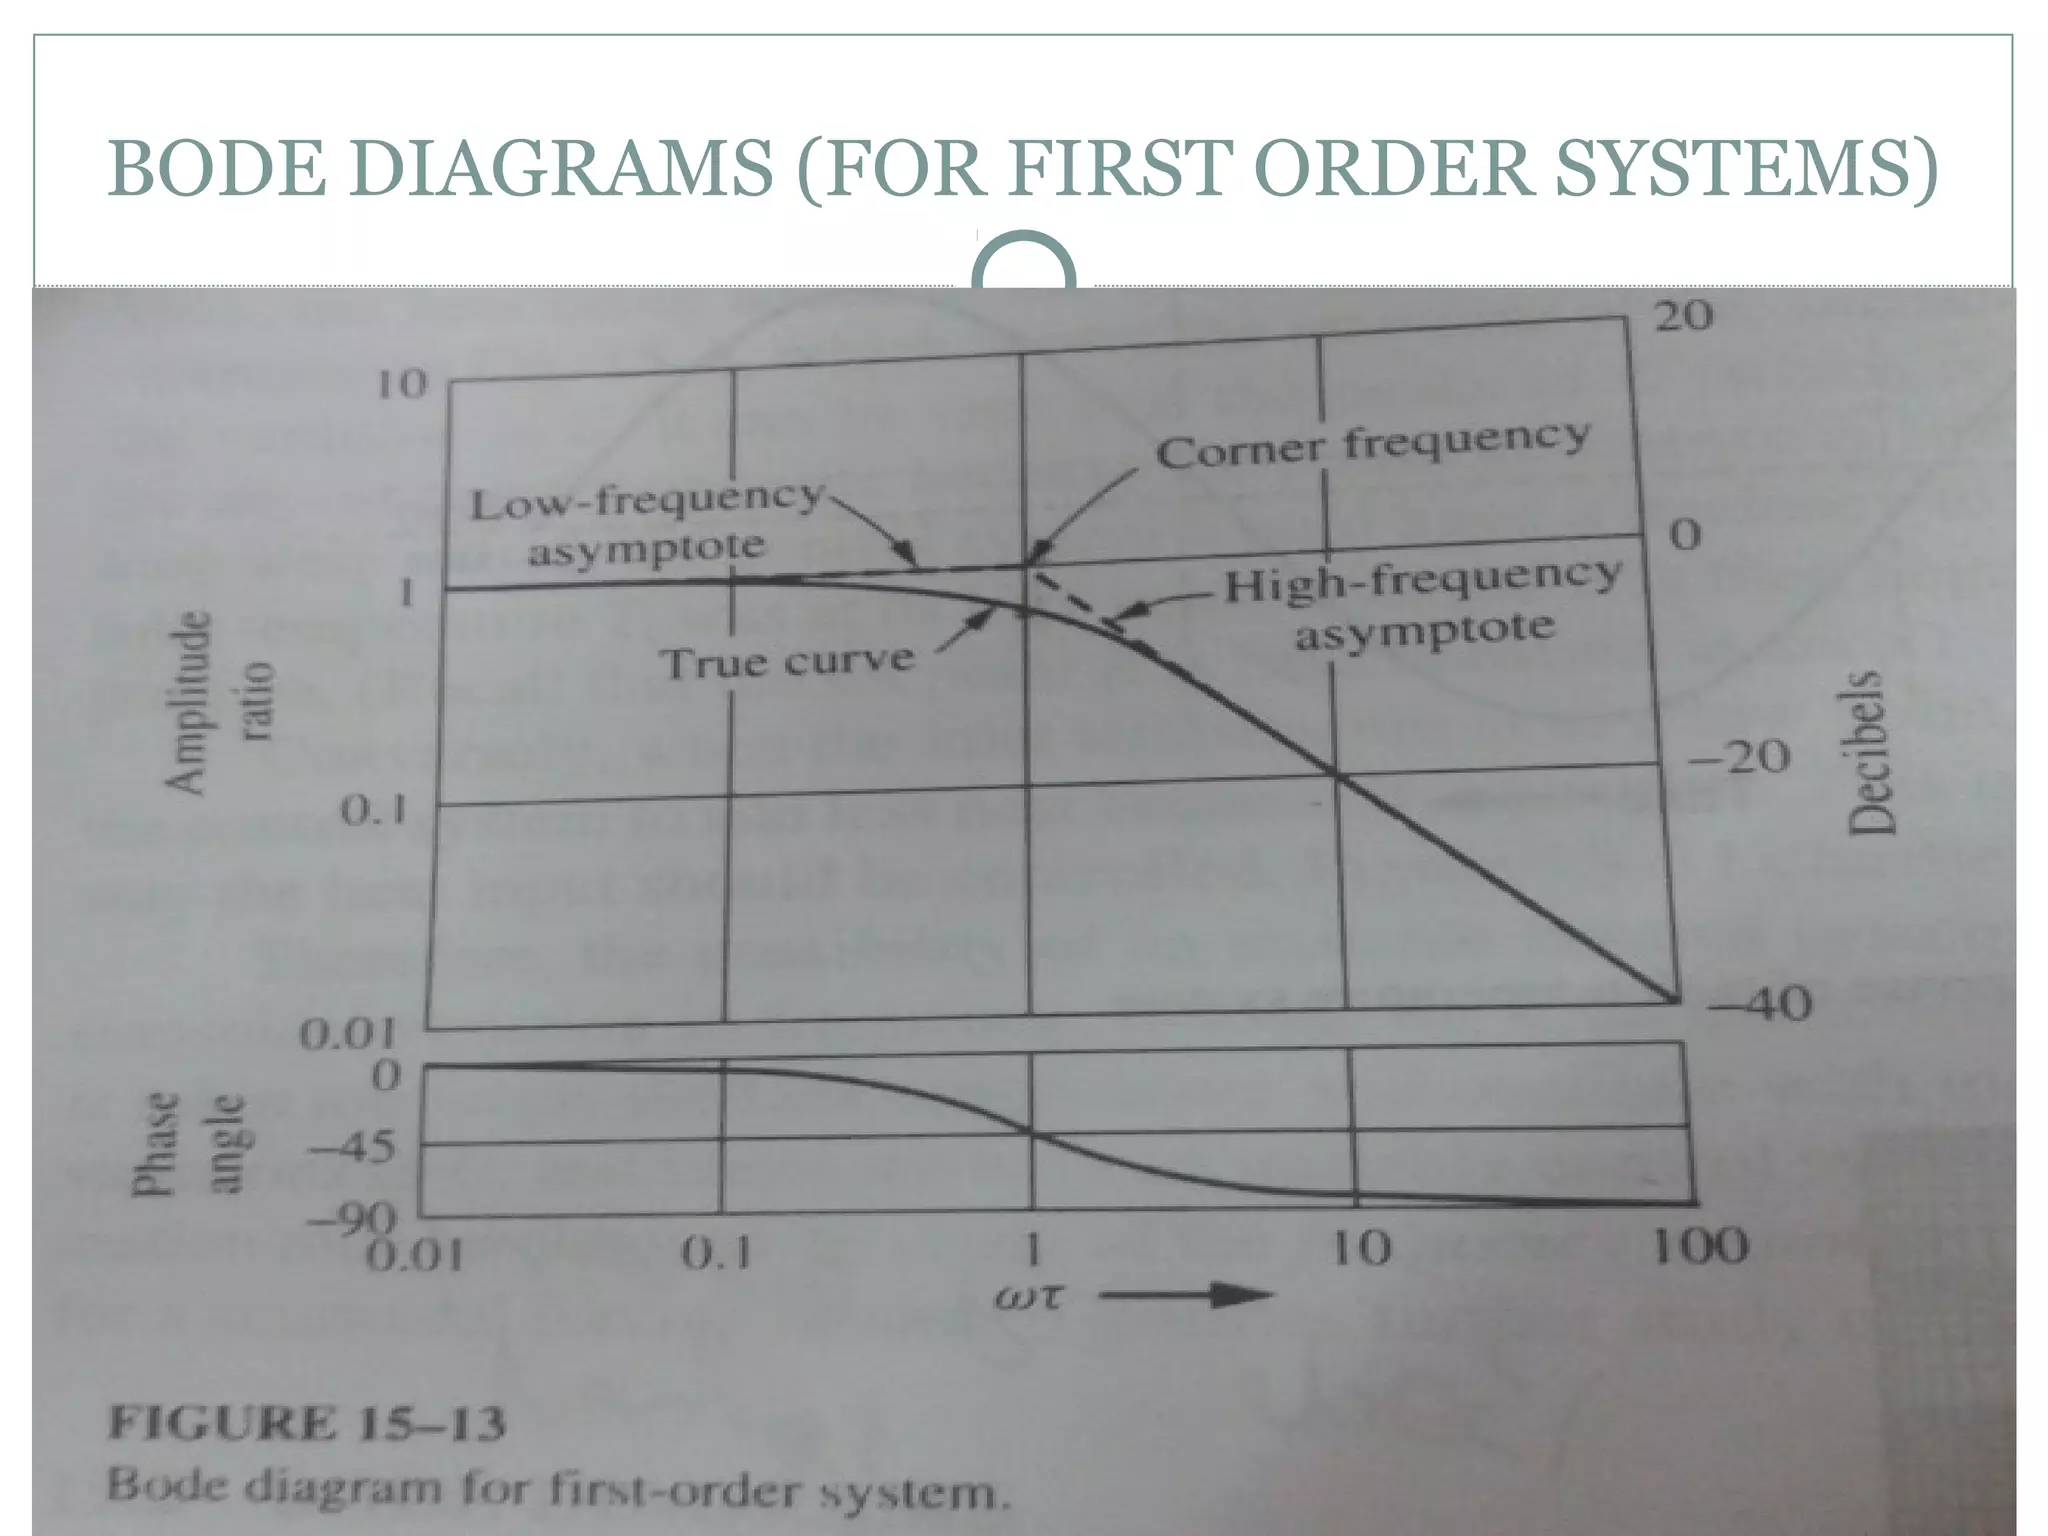


The document discusses frequency response analysis in linear systems using Laplace transforms and graphical techniques like Bode diagrams. It explains key concepts such as amplitude ratio, phase angle, and the characteristics of steady-state sinusoidal responses, highlighting their dependence on frequency. It also covers the construction of Bode diagrams and details the asymptotic behavior of amplitude ratios and phase angles in relation to frequency.