Downloaded 374 times
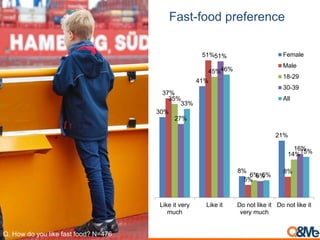
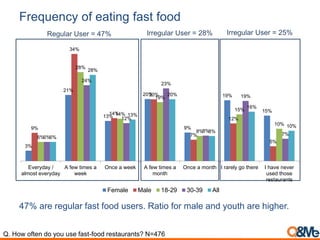
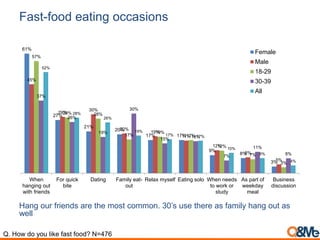
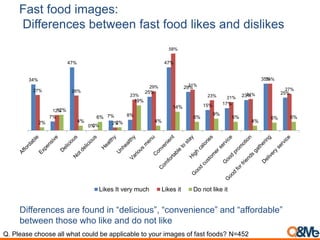
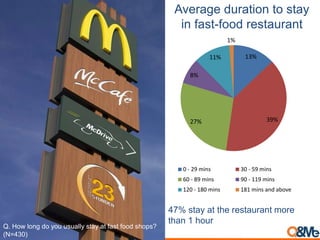
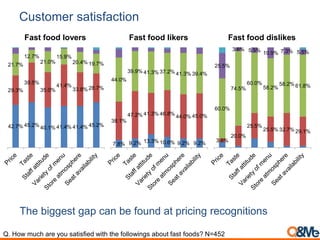
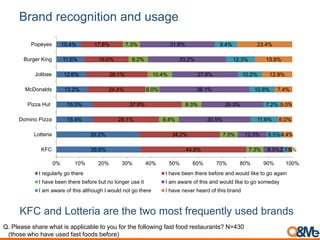
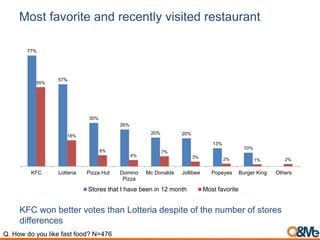
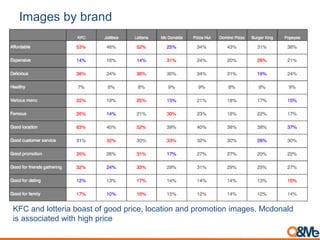
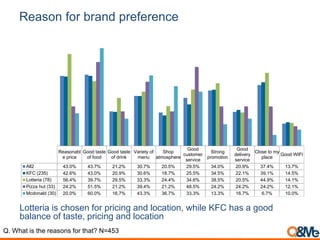
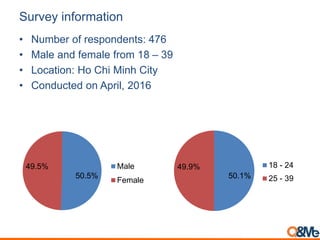


- A survey was conducted in Ho Chi Minh City, Vietnam on fast food eating behaviors and brand preferences among 476 respondents aged 18-39. - 71% of respondents liked or liked very much fast food. 47% were regular fast food users, with higher rates among males and youth. Hanging out with friends was the most common occasion for eating fast food. - The most frequently used fast food brands were KFC and Lotteria. KFC and Lotteria were seen as having good prices, locations, and promotions, while McDonald's was associated with higher prices.


![[Survey] Vietnamese health consciousness and fitness demand](https://cdn.slidesharecdn.com/ss_thumbnails/vietnamesefitnessdemand-171230164614-thumbnail.jpg?width=640&height=640&fit=bounds)


![[Survey] Vietnamese female drinking behaviours](https://cdn.slidesharecdn.com/ss_thumbnails/drinkingbehaviourofvienameseladiesenfin-150812014029-lva1-app6892-thumbnail.jpg?width=640&height=640&fit=bounds)
![[Survey] Vietnam mom's shopping behavior change](https://cdn.slidesharecdn.com/ss_thumbnails/momsshoppingbehaviorssurvey0622fin-170622051113-thumbnail.jpg?width=640&height=640&fit=bounds)


![[Survey] Instant noodle store share in Vietnam](https://cdn.slidesharecdn.com/ss_thumbnails/instantnoodlesurveyinvietnam062417-170624134544-thumbnail.jpg?width=640&height=640&fit=bounds)


![[EN].CleverGroup Vietnam Profile 20251202](https://cdn.slidesharecdn.com/ss_thumbnails/en-260120091417-fe6f88ec-thumbnail.jpg?width=640&height=640&fit=bounds)


