Downloaded 548 times


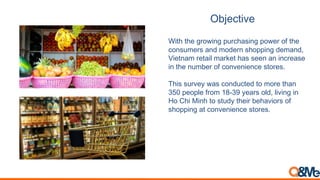
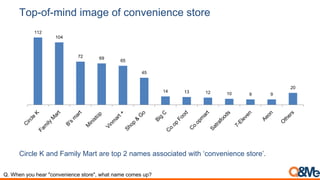
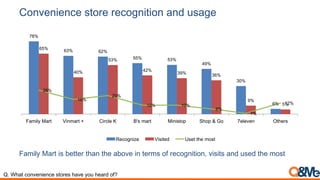
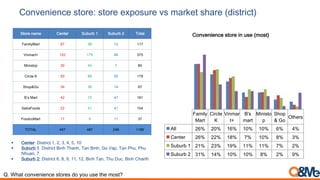
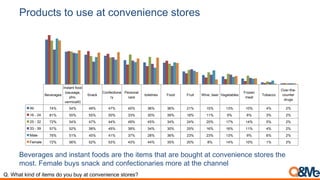
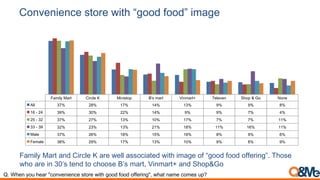
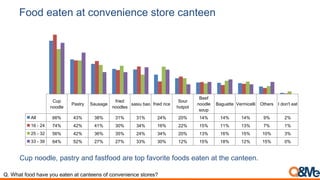
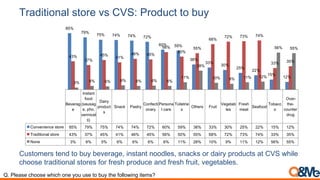

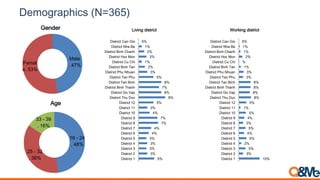
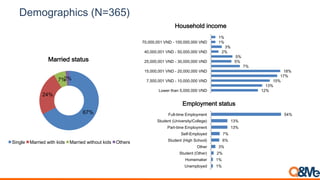


The survey was conducted among more than 350 people aged 18-39 in Ho Chi Minh City to study their shopping behaviors at convenience stores. Family Mart and Circle K were the top brands associated with convenience stores. The survey found that beverages and instant foods were the most commonly purchased items at convenience stores, and Family Mart was recognized, visited, and used most compared to other convenience store brands.


![[Survey Report] Vietnam Youth Lifestyle](https://cdn.slidesharecdn.com/ss_thumbnails/vietnamyouthreporten1124-151123033055-lva1-app6892-thumbnail.jpg?width=640&height=640&fit=bounds)


![[Survey] Vietnam mom's shopping behavior change](https://cdn.slidesharecdn.com/ss_thumbnails/momsshoppingbehaviorssurvey0622fin-170622051113-thumbnail.jpg?width=640&height=640&fit=bounds)


![[Survey] Instant noodle store share in Vietnam](https://cdn.slidesharecdn.com/ss_thumbnails/instantnoodlesurveyinvietnam062417-170624134544-thumbnail.jpg?width=640&height=640&fit=bounds)


![[Survey] Vietnamese health consciousness and fitness demand](https://cdn.slidesharecdn.com/ss_thumbnails/vietnamesefitnessdemand-171230164614-thumbnail.jpg?width=640&height=640&fit=bounds)


![[Survey] Comparison b/w Vietnam Airlines and VieJet](https://cdn.slidesharecdn.com/ss_thumbnails/vietnamairvsvietjet-170604040856-thumbnail.jpg?width=640&height=640&fit=bounds)


![[Nielsen] The need for speed: giving vietnamese consumers what they want](https://cdn.slidesharecdn.com/ss_thumbnails/cvsneedforspeeden-160405065431-160802012129-171227171353-thumbnail.jpg?width=640&height=640&fit=bounds)


