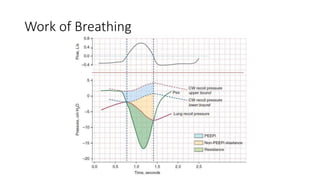
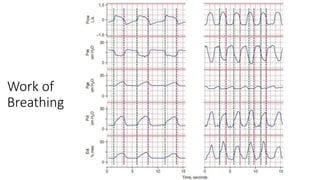
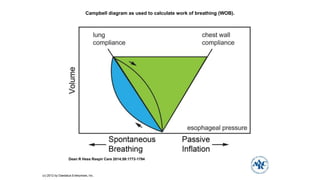
This document discusses different types of patient-ventilator dyssynchrony. It begins with background information on how the main purpose of a ventilator is to decrease the work of breathing. Normally, respiratory muscles account for 1-3% of oxygen consumption, but this can increase to 20% for patients in acute respiratory failure undergoing CPR due to the increased work of breathing.
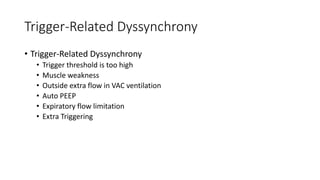
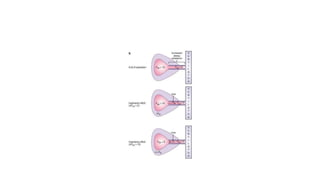
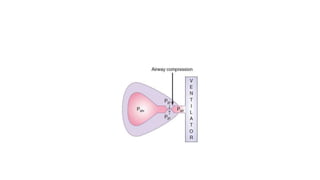
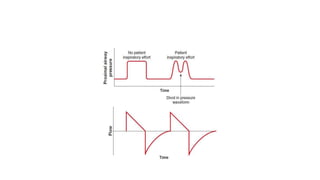
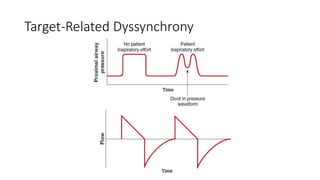
The document then discusses different factors that can contribute to different types of patient-ventilator dyssynchrony, including trigger-related dyssynchrony from a high trigger threshold, muscle weakness, leaks, auto-PEEP, or expiratory flow limitation. Target-related and cycle-related dyssynchrony are also mentioned