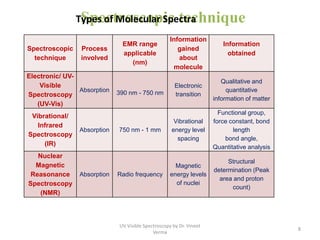
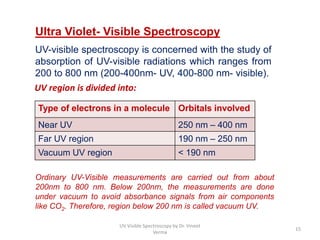
1) UV-Visible spectroscopy involves the absorption of ultraviolet and visible radiations by molecules. It provides information about the electronic structure of molecules.
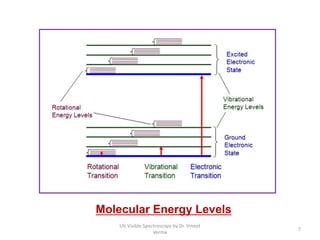
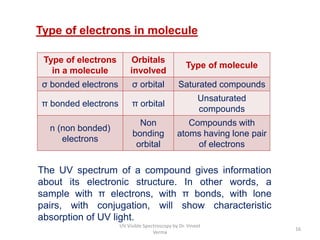
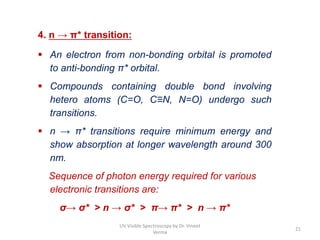
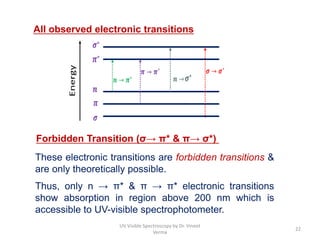
2) Electromagnetic radiations can cause electronic transitions in molecules including σ→σ*, n→σ*, π→π*, and n→π* transitions. The n→π* and π→π* transitions occurring above 200 nm are measurable by UV-Vis spectroscopy.
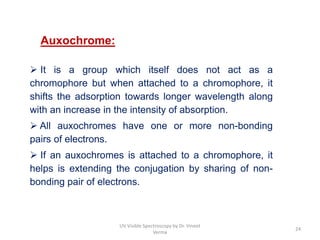
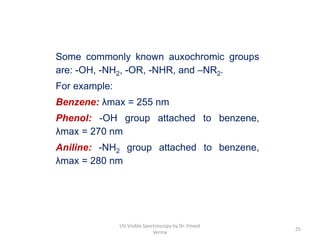
3) Functional groups containing multiple bonds or lone pairs of electrons, called chromophores, impart color by absorbing UV-Visible light. Additional groups called auxochromes induce bathochromic or red shifts in the absorption spectra.