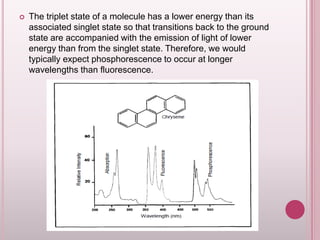
Downloaded 2,151 times

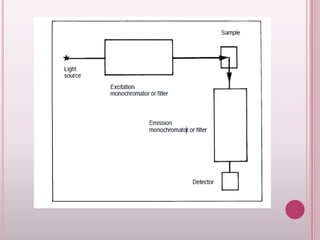


This document provides an overview of fluorescence spectroscopy. It describes how luminescence occurs when a system absorbs external energy like light and emits photons. Specifically, fluorescence involves absorbing ultraviolet or visible light which causes molecule excitation, then reemission of light. The document outlines fluorescence instrumentation components like light sources, wavelength selection using filters or monochromators, detectors, and sample holders. It also discusses related topics such as phosphorescence, absorption spectra, and the advantages and disadvantages of fluorescence spectroscopy.


