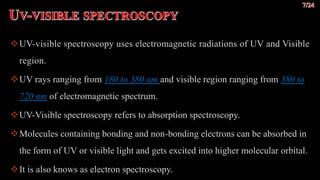
This document discusses different types of luminescence including photoluminescence, chemiluminescence, and electroluminescence. It then focuses on fluorescence spectroscopy, describing how it works, common instrumentation used, and parameters that influence fluorescence spectra such as excitation wavelength and concentration. Applications of fluorescence spectroscopy are outlined as well as techniques like steady-state fluorescence, time-resolved fluorescence, fluorescence anisotropy, and quenching of fluorescence.
Infrared spectroscopy is a technique that analyzes infrared light absorbed by a molecule to determine its structure. There are several types of molecular vibrations that can be observed, including stretching and bending vibrations. Samples can be analyzed in solid, liquid, or gas form using different sample handling methods. The main components of an IR spectrometer are the radiation source, monochromator, sample cell, detector, and recorder. Dispersive and Fourier transform IR spectrometers are two common instrument types, with Fourier transform having advantages like faster scanning. Functional groups can be identified by their characteristic absorption bands. Factors like coupling, hydrogen bonding, and electronic effects can influence vibrational frequencies.
Spectroscopy is the study of the interaction between electromagnetic radiation and matter such as atoms, molecules, or ions. It uses electromagnetic radiation of specific wavelengths or wavelength ranges to qualitatively or quantitatively analyze matter. Spectroscopy deals with absorption, emission, and scattering of electromagnetic radiation when it interacts with matter. The interaction depends on the energy of the radiation, with more energetic radiations like UV and x-rays potentially causing electron ejection, and less energetic ones like infrared inducing molecular vibrations or microwave causing molecular rotation. Spectroscopy is widely used to study the internal structure of organic and inorganic compounds and has advantages like being non-destructive, sensitive, and requiring small sample sizes.
This document provides an overview of fluorescence spectroscopy. It describes how luminescence occurs when a system absorbs external energy like light and emits photons. Specifically, fluorescence involves absorbing ultraviolet or visible light which causes molecule excitation, then reemission of light. The document outlines fluorescence instrumentation components like light sources, wavelength selection using filters or monochromators, detectors, and sample holders. It also discusses related topics such as phosphorescence, absorption spectra, and the advantages and disadvantages of fluorescence spectroscopy.
Fluorescence spectroscopy is based on the principle of fluorescence emission that occurs when a molecule absorbs light and is excited to a higher electronic state. The excited molecule then relaxes to the ground state via vibrational relaxation and emission of a photon. The emitted light has a longer wavelength than the absorbed light due to energy losses in vibrational relaxation, following Stokes' rule. Fluorescence spectroscopy can provide information about molecular structure and interactions through analysis of fluorescence emission spectra.
Ultraviolet–visible spectroscopy or ultraviolet-visible spectrophotometry (UV-Vis or UV/Vis) refers to absorption spectroscopy or reflectance spectroscopy in the ultraviolet-visible spectral region. This means it uses light in the visible and adjacent ranges.
Spectroscopy is the study of the interaction between matter and electromagnetic radiation. It originated through Isaac Newton's experiments using prisms to separate white light into a visible spectrum. Spectroscopy is now used in fields like physical chemistry, analytical chemistry, astronomy, and remote sensing. Different types of spectroscopy include flame, X-ray, atomic emission and absorption, infrared, and mass spectroscopy. A spectrometer is an instrument that measures spectra and shows intensity as a function of properties like wavelength, frequency, or mass. It uses components like prisms, diffraction gratings, or time-of-flight measurements to separate spectra and provide information about materials.
Phosphorescence involves the emission of light from electronically excited triplet states in a material. It is a spin-forbidden process that results in longer-lived emission compared to fluorescence. Phosphorescence occurs when electrons in the excited triplet state relax to the ground singlet state. Instrumentation for measuring phosphorescence requires cryogenic temperatures to reduce thermal quenching, as well as a phosphoroscope to separate the longer-lived phosphorescence from short-lived fluorescence. Applications of phosphorescence include security markers, toys, watches, and switches that glow in the dark.
1. Fluorescence is the emission of light from a substance that has absorbed light or other electromagnetic radiation. It occurs in certain biological molecules like fireflies, corals, and genetically engineered fish.
2. Fluorescence results from electrons absorbing energy and getting excited to higher energy molecular orbitals, then dropping down and emitting photons of lower energy. The Jablonski diagram illustrates this process.
3. Many factors influence fluorescence, including molecular structure, temperature, solvent, pH, and structural rigidity. Fluorescent dyes like FITC and cyanine dyes are used in applications like labeling and fluorescence resonance energy transfer.
describes the complete history, mechanisms, instrumentation(jablonski diagram), types, comparision and factors affecting, applications of fluorescence and phosphorescence and describes about quenching and stokes shift.
This document provides an overview of mass spectrometry principles and instrumentation. It discusses various components of a mass spectrometer including sample handling systems, ion sources like electron impact and chemical ionization, mass analyzers like quadrupole and time-of-flight, and detectors. It also covers the different types of ions produced during fragmentation, common fragmentation patterns and rules, and applications of techniques like GC/MS and LC/MS in fields like proteomics and metabolomics.
The document discusses various methods of x-ray analysis. It begins by describing how x-rays are produced using a Coolidge tube, which generates x-rays by accelerating electrons into a metal target. It then discusses several x-ray techniques including x-ray diffraction, which is based on constructive interference of x-rays scattered by crystal lattices and is governed by Bragg's law. Finally, it summarizes common methods for x-ray diffraction analysis including transmission methods, back-reflection methods, and Bragg's x-ray spectrometer method which measures diffraction intensities using a rotating crystal.
UV-VIS spectroscopy analyzes the absorption of light in the ultraviolet-visible spectral region by molecules. White light is composed of a range of wavelengths, which can be separated by a prism into the visible colors from violet to red. Different functional groups and conjugated systems in molecules absorb at characteristic wavelengths. The absorbance of a solution is proportional to the concentration of the absorbing species, as described by Beer's Law. UV-VIS spectroscopy is used to determine structural features and study reactions.
Lecture 04; spectral lines and broadening by Dr. Salma Amirsalmaamir2
This lecture discusses spectral lines and broadening. A spectral line results from the absorption or emission of light at a narrow frequency range, which can be used to identify atoms and molecules. Spectral lines experience natural broadening due to the Heisenberg uncertainty principle. Doppler broadening occurs due to the random motion of atoms and increases with temperature. Pressure or Lorentz broadening results from atomic collisions and increases with pressure and temperature. External magnetic or electric fields can also cause Zeeman or Stark broadening through the splitting of spectral lines.
Luminescence is the characteristic property of material to emit light through various processes. This slide helps us to know about the atomic level description of luminiscence, its types and applications
Infrared spectroscopy involves interaction of infrared radiation with matter. It covers absorption spectroscopy techniques and is conducted using an infrared spectrometer. The infrared region is divided into three regions based on wavelengths. Infrared spectroscopy follows Beer's law and analyzes the selective absorption bands in a sample's infrared spectrum to determine its molecular structure and identify functional groups, compounds, and impurities. It has applications in analyzing organic and inorganic compounds.
UV-visible spectroscopy is a technique that uses light in the visible and adjacent ranges. It works by measuring how much light is absorbed by a sample at each wavelength.
The document discusses the basic principles of spectroscopy, including how electromagnetic radiation interacts with matter. It describes the laws of absorption, specifically Beer's law, which states that absorbance is proportional to concentration.
The key aspects of instrumentation are outlined, including light sources, wavelength selectors like monochromators, sample holders, and detection devices. Single beam and double beam spectrophotometers are explained as the main types of instruments used in UV-visible spectroscopy.
This document discusses the principles, instrumentation, and applications of UV spectroscopy. It begins with an introduction to UV spectroscopy and its uses in qualitative and quantitative analysis. It then covers the underlying principles of UV absorption, including Lambert's law and Beer's law. The key components of a UV spectrophotometer are described, including radiation sources, monochromators, sample containers, detectors, and recording systems. Finally, common applications of UV spectroscopy are outlined, such as determining functional groups, conjugation, and reaction monitoring.
The document describes the proportional counter, which is a gaseous state particle detector used to detect nuclear particles and radiation. It consists of a cylindrical metal tube filled with argon and methane gas and a thin metal wire running down the center as an anode. When radiation enters the tube, it ionizes the gas, producing electron-ion pairs. An applied voltage between the wire and tube causes gas amplification through avalanching, resulting in a pulse signal. The proportional counter can be used for particle counting and energy determination, and has advantages like low-energy detection but requires stable applied voltages.
This document discusses various types of photon detectors, including vacuum phototubes, photomultiplier tubes, silicon photodiodes, photovoltaic cells, and multi-channel photon detectors. Photomultiplier tubes contain a cathode, anode, and dynodes that amplify the signal from incoming photons. Silicon photodiodes can operate in forward or reverse bias to detect photons. Photovoltaic cells use a semiconductor layer to generate a current from absorbed radiation. Multi-channel detectors like linear photodiode arrays allow simultaneous measurement of an entire light spectrum.
Infrared spectroscopy involves the interaction of infrared radiation with matter. Molecules absorb specific frequencies that excite vibrational modes. The absorbed frequencies are characteristic of bonds and functional groups within a molecule. Fourier transform infrared spectroscopy (FTIR) has advantages over dispersive instruments as it allows simultaneous measurement of all frequencies using an interferometer. Applications in forensics include identification of materials like paint, fingerprints, and detection of document alterations or counterfeit substances.
This document provides an overview of fluorescence spectroscopy. It defines luminescence as the emission of photons from electronically excited states. There are two main types of luminescence: fluorescence from singlet excited states and phosphorescence from triplet excited states. The document discusses instrumentation for fluorescence spectroscopy including light sources, wavelength selection devices like filters and monochromators, and detectors. It also covers factors that affect fluorescence intensity such as molecular structure, concentration, temperature, and pH.
This document discusses atomic absorption spectroscopy, including its principle, instrumentation, and applications. Atomic absorption spectroscopy works by vaporizing a sample into neutral atoms that can absorb radiation from a hollow cathode lamp at specific wavelengths. The instrumentation includes a lamp, atomizer to vaporize the sample, monochromator to select wavelengths, detector such as a photomultiplier tube, and recorder. Applications include determining small amounts of metals in environmental, food, pharmaceutical, and other samples.
Infrared spectroscopy involves the interaction of infrared radiation with matter. It is based on absorption spectroscopy and deals with the absorption of infrared radiation which causes vibrational transitions in molecules. There are two main types of molecular vibrations observed in infrared spectroscopy - stretching vibrations which involve changes in bond lengths, and bending vibrations which involve changes in bond angles. Infrared spectroscopy can be used to determine the structure of organic compounds and identify functional groups and impurities in pharmaceutical applications.
This document discusses the theory, instrumentation, and applications of dispersive and Fourier transform infrared (FTIR) spectroscopy. It begins with an introduction to IR spectroscopy and the IR region. It then covers dispersive IR instrumentation, which uses prism or grating monochromators to separate wavelengths, and has limitations like slow scan speeds and limited resolution. The document introduces FTIR instrumentation, which uses an interferometer to simultaneously measure all wavelengths and overcomes the limitations of dispersive IR. It concludes that FTIR provides faster, more accurate and sensitive analysis compared to dispersive IR.
X-ray powder diffraction is a technique used to analyze the crystal structure of materials. Finely powdered samples are bombarded with X-rays, and the resulting diffraction pattern is analyzed. Each material produces a unique pattern that can be used for identification. The instrument works by generating monochromatic X-rays that diffract off the sample, producing concentric cones. The pattern is recorded and analyzed to determine properties like unit cell dimensions. Common applications include phase identification, purity analysis, and structure determination of minerals, compounds, and alloys. The technique is rapid, non-destructive, and requires only small sample amounts.
This document discusses double resonance in nuclear magnetic resonance (NMR) spectroscopy. It explains spin decoupling techniques that are used to simplify complex NMR spectra. By irradiating coupled protons, decoupling can eliminate splitting of signals and cause multiplets to collapse into doublets or singlets. This produces easier to interpret spectra. Decoupling is demonstrated on an ethanol sample, where exchanging hydrogens for deuterium causes signals to disappear. Irradiating methyl hydrogens in a molecule can also simplify signals by removing coupling to adjacent protons. Decoupling enhances spectral signals and allows clearer distinction between them.
Transmission electron microscopy (TEM) is a microscopy technique in which a beam of electrons is guided through an ultra thin specimen, interacting with the specimen as it passes through.An image is formed from the fundamental interaction of the electrons transmitted through the specimen; the image is magnified and focused onto an imaging device, such as a fluorescent screen, on a layer of photographic film, or to be observed by a sensor such as a CCD camera.
Spectroscopy is the study of the interaction between electromagnetic radiation and matter. Ultraviolet-visible (UV-Vis) spectroscopy involves using UV or visible light to analyze samples. UV-Vis spectroscopy can be used to identify organic and inorganic compounds, determine concentrations, and study reaction kinetics. The document provides details on the principles, instrumentation, and applications of UV-Vis spectroscopy, including qualitative and quantitative analysis of organic compounds, detection of functional groups and impurities, and determination of molecular structure.
UV spectroscopy can be used to analyze organic compounds. It works by measuring the absorption of UV or visible light. Double beam UV spectroscopy has advantages over single beam as it automatically corrects for fluctuations in light source intensity and detector response. UV spectroscopy can be used to detect impurities, characterize functional groups, and determine concentrations through the Beer-Lambert law. It provides structural information about organic compounds.
The document discusses electromagnetic radiation and ultraviolet spectroscopy, explaining that UV spectroscopy involves measuring the absorption of UV or visible light, which provides information about electronic transitions in molecules. It describes the components of a UV spectrometer and the principles of absorption spectroscopy. Various applications of UV spectroscopy in forensic science are also outlined, such as identifying illegal substances or determining the number of inks in questioned documents.
The document discusses electromagnetic radiation and ultraviolet spectroscopy, explaining that UV spectroscopy involves measuring the absorption of UV or visible light, which produces electronic transitions in molecules. It describes the components of a UV spectrometer and the principles of absorption spectroscopy. UV spectroscopy has various applications in forensic science such as identifying questioned documents and detecting controlled substances.
Spectroscopy is a method which measures the interaction of matter with electromagnetic radiation. it reveals different properties of substances such as absorbance, composition and interaction with other matter
Ultraviolet-visible spectroscopy or ultraviolet-visible spectrophotometry (UV-Vis or UV/Vis) refers to absorption spectroscopy or reflectance spectroscopy in the ultraviolet-visible spectral region. Ultraviolet-Visible (UV-VIS) Spectroscopy is an analytical method that can measure the analyte quantity depending on the amount of light received by the analyte.
UV spectroscopy is a technique that uses ultraviolet light to analyze compounds. It works by measuring how much UV light is absorbed by a sample at different wavelengths. The amount of absorption depends on characteristics of the compound like its structure and bonds. UV spectroscopy is used in clinical labs and research to identify unknown compounds, determine compound purity, and study properties like double bonds and functional groups. It provides information about electronic transitions in molecules.
This document provides an overview of UV-Visible spectroscopy. It discusses the basic principles including electromagnetic radiation, spectroscopy, absorption of UV-Visible light, and Beer-Lambert's law. It describes the instrumentation of UV-Visible spectroscopy including light sources, wavelength selectors, sample compartments, detectors and basic components. It also discusses electronic transitions, shifts in absorption, and applications of UV-Visible spectroscopy in qualitative and quantitative analysis.
UV - Visible Spectroscopy detailed information is included .The Spectroscopy study provide the information and the absorbance as well the concentration of the drugs is studied.
uv spectelectronic transition in the roscopyRiyaDas765755
This document discusses UV spectroscopy and instrumentation. It provides an overview of electronic transitions including σ→ σ*, n → σ*, π→ π*, and n → π* transitions. It describes the basic components of UV-visible spectrophotometers including light sources, wavelength selectors, sample holders, detectors, and the differences between single beam and double beam instruments. The conclusion states that UV spectroscopy is routinely used in analytical chemistry for quantitative analysis of transition metals, conjugated organics, and biomolecules, and instrumentation enables precise measurements and enhanced capabilities.
Spectroscopy involves analyzing the interaction of electromagnetic radiation with matter. Different regions of the electromagnetic spectrum are used to study different types of molecular motion and structure. UV-visible spectroscopy analyzes electronic transitions that occur when molecules absorb ultraviolet or visible light. The wavelength and intensity of absorbed light provides information about functional groups and molecular structure. Key concepts in UV-visible spectroscopy include chromophores, which are functional groups that absorb light in characteristic regions, and Beer's law, which states that absorbance is proportional to concentration.
UV-Visible spectrophotometry involves measuring light intensity as a function of wavelength. A spectrophotometer directs light through a sample and measures the transmitted light intensities using a charged coupled device detector. It displays the results as a graph of absorbance versus wavelength. UV-Vis spectroscopy can be used to determine concentrations, detect impurities, elucidate organic structures, and study chemical kinetics by observing changes in absorbance.
Instrumentation of UV- Visible Spectroscopy.pptxHariomjaiswal14
This document provides information about a seminar on instrumentation of UV-Visible spectroscopy. It discusses the key components of a UV-Visible spectroscopy instrument: light sources like hydrogen lamps; filters or monochromators to isolate wavelengths; sample cells or cuvettes to hold liquid samples; and detectors like photomultiplier tubes to convert light to electrical signals. It also outlines some applications of UV-Visible spectroscopy like qualitative and quantitative analysis, detecting impurities, and determining the structure of organic compounds.
http://www.redicals.com
The spectrophotometer technique is to measures light intensity as a function of wavelength.
• Measures the light that passes through a liquid sample
• Spectrophotometer gives readings in Percent Transmittance (%T) and in Absorbance (A)
The document discusses various devices used for biomolecular and cellular research, focusing on those based on interactions with electromagnetic radiation. It describes spectrophotometers that use absorption, emission, or fluorescence of light to measure biomolecule concentrations or study structure. Specific devices covered include UV/visible absorption spectrophotometers, infrared spectrophotometers, Raman spectrometers, and circular dichroism instruments. These tools allow analyzing properties like protein secondary structure, drug interactions at the molecular level, and transport processes.
Spectrophotometry uses light absorption measurements to quantify chemical substances. It works by measuring how much light is absorbed as it passes through a sample solution, with different compounds absorbing different wavelengths. A spectrophotometer directs light through the sample and measures the intensity of the transmitted light with a detector. It can analyze samples using UV, visible, or infrared light depending on the type of analysis needed. The amount of light absorbed follows the Beer-Lambert law and is directly proportional to concentration, allowing for quantitative analysis of substances. Spectrophotometry has many applications in fields like clinical diagnosis, drug analysis, and environmental monitoring.
UV-Visible spectroscopy is considered as an important tool in the analytical chemistry.
Most powerful tool available for the study of atomic and molecular structure.
- Most commonly used techniques in clinical as well as chemical laboratories.
- Used for the qualitative analysis and identification of chemicals.
ain use is for quantitative determination of different organic and inorganic compounds in solution.
Basically, spectroscopy is related to the interaction of light with matter.
As light is absorbed by matter, the result is an increase in the energy content of the atoms or molecules.
The absorption of visible or ultraviolet light by a chemical compound will produce a distinct spectrum.
UV-Visible light range- 200-800 nm
Visible range: 400-800 nm
UV range: 200-400 nm
Spectrophotometry uses the absorption of light by chemical substances to measure concentration. A spectrophotometer directs a beam of light through a sample and measures the intensity of transmitted light, relating it to concentration through Beer's Law. It operates based on Lambert's Law stating light absorption increases with concentration and path length. Common types are single and double beam instruments, with the latter measuring sample and reference simultaneously. Components include a light source, monochromator, sample holder, and detector. Applications include quantifying analytes and studying reaction kinetics and molecular structure.
This document provides an overview of UV-visible spectroscopy. It discusses the history and development of UV-visible spectrometers. It explains that UV-visible spectroscopy involves measuring the absorption of UV or visible light by a sample. This can provide information about molecular structure through electronic transitions. The document also outlines the Beer-Lambert law and how it relates absorbance to concentration. It describes instrumentation components and electronic transitions involved. Applications like detection of impurities and structure elucidation are also mentioned.
The technology uses reclaimed CO₂ as the dyeing medium in a closed loop process. When pressurized, CO₂ becomes supercritical (SC-CO₂). In this state CO₂ has a very high solvent power, allowing the dye to dissolve easily.
PPT on Direct Seeded Rice presented at the three-day 'Training and Validation Workshop on Modules of Climate Smart Agriculture (CSA) Technologies in South Asia' workshop on April 22, 2024.
EWOCS-I: The catalog of X-ray sources in Westerlund 1 from the Extended Weste...Sérgio Sacani
Context. With a mass exceeding several 104 M⊙ and a rich and dense population of massive stars, supermassive young star clusters
represent the most massive star-forming environment that is dominated by the feedback from massive stars and gravitational interactions
among stars.
Aims. In this paper we present the Extended Westerlund 1 and 2 Open Clusters Survey (EWOCS) project, which aims to investigate
the influence of the starburst environment on the formation of stars and planets, and on the evolution of both low and high mass stars.
The primary targets of this project are Westerlund 1 and 2, the closest supermassive star clusters to the Sun.
Methods. The project is based primarily on recent observations conducted with the Chandra and JWST observatories. Specifically,
the Chandra survey of Westerlund 1 consists of 36 new ACIS-I observations, nearly co-pointed, for a total exposure time of 1 Msec.
Additionally, we included 8 archival Chandra/ACIS-S observations. This paper presents the resulting catalog of X-ray sources within
and around Westerlund 1. Sources were detected by combining various existing methods, and photon extraction and source validation
were carried out using the ACIS-Extract software.
Results. The EWOCS X-ray catalog comprises 5963 validated sources out of the 9420 initially provided to ACIS-Extract, reaching a
photon flux threshold of approximately 2 × 10⁻⁸ photons cm−2
s
−1
. The X-ray sources exhibit a highly concentrated spatial distribution,
with 1075 sources located within the central 1 arcmin. We have successfully detected X-ray emissions from 126 out of the 166 known
massive stars of the cluster, and we have collected over 71 000 photons from the magnetar CXO J164710.20-455217.
The debris of the ‘last major merger’ is dynamically youngSérgio Sacani
The Milky Way’s (MW) inner stellar halo contains an [Fe/H]-rich component with highly eccentric orbits, often referred to as the
‘last major merger.’ Hypotheses for the origin of this component include Gaia-Sausage/Enceladus (GSE), where the progenitor
collided with the MW proto-disc 8–11 Gyr ago, and the Virgo Radial Merger (VRM), where the progenitor collided with the
MW disc within the last 3 Gyr. These two scenarios make different predictions about observable structure in local phase space,
because the morphology of debris depends on how long it has had to phase mix. The recently identified phase-space folds in Gaia
DR3 have positive caustic velocities, making them fundamentally different than the phase-mixed chevrons found in simulations
at late times. Roughly 20 per cent of the stars in the prograde local stellar halo are associated with the observed caustics. Based
on a simple phase-mixing model, the observed number of caustics are consistent with a merger that occurred 1–2 Gyr ago.
We also compare the observed phase-space distribution to FIRE-2 Latte simulations of GSE-like mergers, using a quantitative
measurement of phase mixing (2D causticality). The observed local phase-space distribution best matches the simulated data
1–2 Gyr after collision, and certainly not later than 3 Gyr. This is further evidence that the progenitor of the ‘last major merger’
did not collide with the MW proto-disc at early times, as is thought for the GSE, but instead collided with the MW disc within
the last few Gyr, consistent with the body of work surrounding the VRM.
Travis Hills of MN is Making Clean Water Accessible to All Through High Flux ...Travis Hills MN
By harnessing the power of High Flux Vacuum Membrane Distillation, Travis Hills from MN envisions a future where clean and safe drinking water is accessible to all, regardless of geographical location or economic status.
ESR spectroscopy in liquid food and beverages.pptxPRIYANKA PATEL
With increasing population, people need to rely on packaged food stuffs. Packaging of food materials requires the preservation of food. There are various methods for the treatment of food to preserve them and irradiation treatment of food is one of them. It is the most common and the most harmless method for the food preservation as it does not alter the necessary micronutrients of food materials. Although irradiated food doesn’t cause any harm to the human health but still the quality assessment of food is required to provide consumers with necessary information about the food. ESR spectroscopy is the most sophisticated way to investigate the quality of the food and the free radicals induced during the processing of the food. ESR spin trapping technique is useful for the detection of highly unstable radicals in the food. The antioxidant capability of liquid food and beverages in mainly performed by spin trapping technique.
Authoring a personal GPT for your research and practice: How we created the Q...Leonel Morgado
Thematic analysis in qualitative research is a time-consuming and systematic task, typically done using teams. Team members must ground their activities on common understandings of the major concepts underlying the thematic analysis, and define criteria for its development. However, conceptual misunderstandings, equivocations, and lack of adherence to criteria are challenges to the quality and speed of this process. Given the distributed and uncertain nature of this process, we wondered if the tasks in thematic analysis could be supported by readily available artificial intelligence chatbots. Our early efforts point to potential benefits: not just saving time in the coding process but better adherence to criteria and grounding, by increasing triangulation between humans and artificial intelligence. This tutorial will provide a description and demonstration of the process we followed, as two academic researchers, to develop a custom ChatGPT to assist with qualitative coding in the thematic data analysis process of immersive learning accounts in a survey of the academic literature: QUAL-E Immersive Learning Thematic Analysis Helper. In the hands-on time, participants will try out QUAL-E and develop their ideas for their own qualitative coding ChatGPT. Participants that have the paid ChatGPT Plus subscription can create a draft of their assistants. The organizers will provide course materials and slide deck that participants will be able to utilize to continue development of their custom GPT. The paid subscription to ChatGPT Plus is not required to participate in this workshop, just for trying out personal GPTs during it.
Mending Clothing to Support Sustainable Fashion_CIMaR 2024.pdfSelcen Ozturkcan
Ozturkcan, S., Berndt, A., & Angelakis, A. (2024). Mending clothing to support sustainable fashion. Presented at the 31st Annual Conference by the Consortium for International Marketing Research (CIMaR), 10-13 Jun 2024, University of Gävle, Sweden.
Sexuality - Issues, Attitude and Behaviour - Applied Social Psychology - Psyc...PsychoTech Services
A proprietary approach developed by bringing together the best of learning theories from Psychology, design principles from the world of visualization, and pedagogical methods from over a decade of training experience, that enables you to: Learn better, faster!
Current Ms word generated power point presentation covers major details about the micronuclei test. It's significance and assays to conduct it. It is used to detect the micronuclei formation inside the cells of nearly every multicellular organism. It's formation takes place during chromosomal sepration at metaphase.
3. Spectroscopy is the interaction of electromagnetic radiation with matter.
After interaction, may variation in intensity of electromagnetic radiation with
frequency.
The device which is used to measure variation of EMR is called as
spectrophotometer or sometime called as spectrometer.
Spectroscopy is an scientific tool which is used for the study of atomic as well
as molecular structure of matter.
4. Explain
EMR The radiation constitutes electric and magnetic field is known as
electromagnetic radiation (EMR).
EMR may be produced by changing electric and magnetic field
simultaneously which act at right angle to each other and also perpendicular
to the direction of propagation of electromagnetic waves.
Properties of Electromagnetic Radiations
Electromagnetic waves are transverse in nature.
These waves can propagate in vacuum also.
They may produced optical effects.
They can be polarized.
5. The electromagnetic spectrum is bunch of energies which are arranged in
order of increasing wavelength and decreasing frequency.
With increasing wavelength, gamma rays situated in first position with low
wavelength and highest frequency and it has more energy as compare to other
electromagnetic waves.
Cosmic rays having shorter wavelength and highly energetic.
Radio waves are longer wavelength, hence less energetic.
7. UV visible
spectroscopy.
UV-visible spectroscopy uses electromagnetic radiations of UV and Visible
region.
UV rays ranging from 180 to 380 nm and visible region ranging from 380 to
720 nm of electromagnetic spectrum.
UV-Visible spectroscopy refers to absorption spectroscopy.
Molecules containing bonding and non-bonding electrons can be absorbed in
the form of UV or visible light and gets excited into higher molecular orbital.
It is also knows as electron spectroscopy.
8. Princip
al Many molecules absorb UV visible light.
The problems of solution increases as attenuation of the beam increases.
Absorbance directly proportional to the path length (l) and concentration (c) of
absorbing species.
The intensity of absorption is governed by two fundamental laws of absorption
known as Beer and Lambert law.
Beer's and Lambert‘s law: when a beam of light passes through a transparent sample
cell containing a solution of absorbing substance the intensity of light reduces.
9. This is due to :-
reflection of the inner and outer surface of cell.
scattering by particle of solution.
absorption of light by molecule in the solution.
(Note: Since it is not possible to directly measure the amount of radiation absorbed by
partially transparent substance it may be measured by calculating the difference in intensity
between original and transmitted radiation falling on the sample).
Iabsorbed = Io – It
(Where asIo is the original intensity falling on the cell and It total intensity)
10. Beers law :- When rays of monochromatic light passes through and absorbing
medium, its intensity decreases export exponentially as the concentration of
absorbing material increases.
Lambert’s law :- When the ray of monochromatic light passes through an
absorbing medium its intensity decreases exponentially as a length of
absorbing material increases.
11. UV visible spectrophotometer is a devices which is used to measure
absorbance of samples.
Spectrophotometer available in market with two type; one is single beam in
which only one sample can be investigate and another is double beam
spectrophotometer in which two samples can be investigate (questioned &
reference sample).
It consist of following parts;
1) Radiation source.
2) Monochromator .
3) Sample cell.
4) Detector.
5) Data output and recording device.
12.
13. The radiation source is Deuterium lamp used for UV region having
wavelength range of approximately 190-450nm.
For the visible region Tungsten filament bulb is used having wavelength
range from about 332 – 850 nm.
Xenon arc lamp also is used in entire UV visible region.
The condensing mirror is rotated manually to focus the light emitted from
other source into the entrance slit of the monochromator
14. It is a device for isolating monochromatic or narrow band of radiant energy
from the source.
It will allow to pass radiant energy of particular wavelength.
Quartz prism was used in earlier photometer but now they are
completely replaced by diffraction grating.
It mainly consists two parts;
1) Slit
2) Dispersion
15. Pyrex glass in visible region is satisfactory material for sample cell but
below 350 nm (UV region) wavelength quartz i.e. glass of pure silicon
dioxide must be used.
Fig. Various types of Sample Cells
16. Detecto
rThe detector measures the quantity of radiation that passes through the
sample converting it into the electric signal.
The most common detector used are vacuum photo cells and this is based on
photoelectriceffect.
Receiving signal is obtained when a photon of sufficient energy strikes the
metals of face cause the election of an electron.
This is determined by quantitative measurement of amount of light passing
through instrument by meansof detector.
17. Another type of detector is photomultiplier tube (PMT) which is frequently
use for the detection of absorbance in spectroscopy.
Fig. Photomultiplier tube
18. Sample signal output can be analog absorbance or transmittance meter where
the data can be read, recorded and processed.
Some spectrophotometer having attached computer for monitoring the
instrument and record the absorbance.
19. UV-Visible spectroscopy allows transparent solid, liquid and gaseous
sample.
Very small amount such as microgram or microliter sample is sufficient for
detection.
There are some point to be consider while preparing the sample;
High purity of transparent solvent should be used.
Aqueous system often requires for the use of buffer system.
Sample clean up may be required before investigation.
Turbid sample should be filtered to reduced light scattering.
20. UV-Visible spectroscopy used to detect conjugations.
It also used to detects isomers.
Detection of functional group can be possible in this technique.
It is also use for identification and quantification of organic as well as inorganic
compound.
It is also use for research and development of science and technology.
It also play key role in ink and fibers in Forensic science.
UV-Visible spectroscopy is widely used as a significant tool for both qualitative and
quantitative drug analysis .
21. UV-Visible spectroscopy is an quick and inexpensive technique available for
identification of certain class of material.
It can detect minute amount of sample such as microliter or microgram.
Quantity of sample can be done precisely and reproducibly.
22. Extensive sample preparation is required.
The sample should be purify before analysis.
Broad band obtained in this technique. Sometime definite identification is
not possible for this band broadening.
23. UV-Visible spectroscopy is one of the most important tool used for the
purpose of identification and quantification. It has wide applications in
various field such as Chemistry, Forensic Science, Biochemistry,
Pharmaceutical industry, Cosmetics Industry, Petroleum Industry, Food
Industry and many more. It has wide used because most of the molecules
present in the universe shows absorption in UV-Visible region of
electromagnetic spectrum. It acts as a screening technique in most of the cases
to identify molecule before performing other highly sophisticated technique
of that sample molecule. Other advantages with this technique is that it is
simple to perform and inexpensive. But sometime sample preparation is
difficult and it will depends upon the nature of sample.