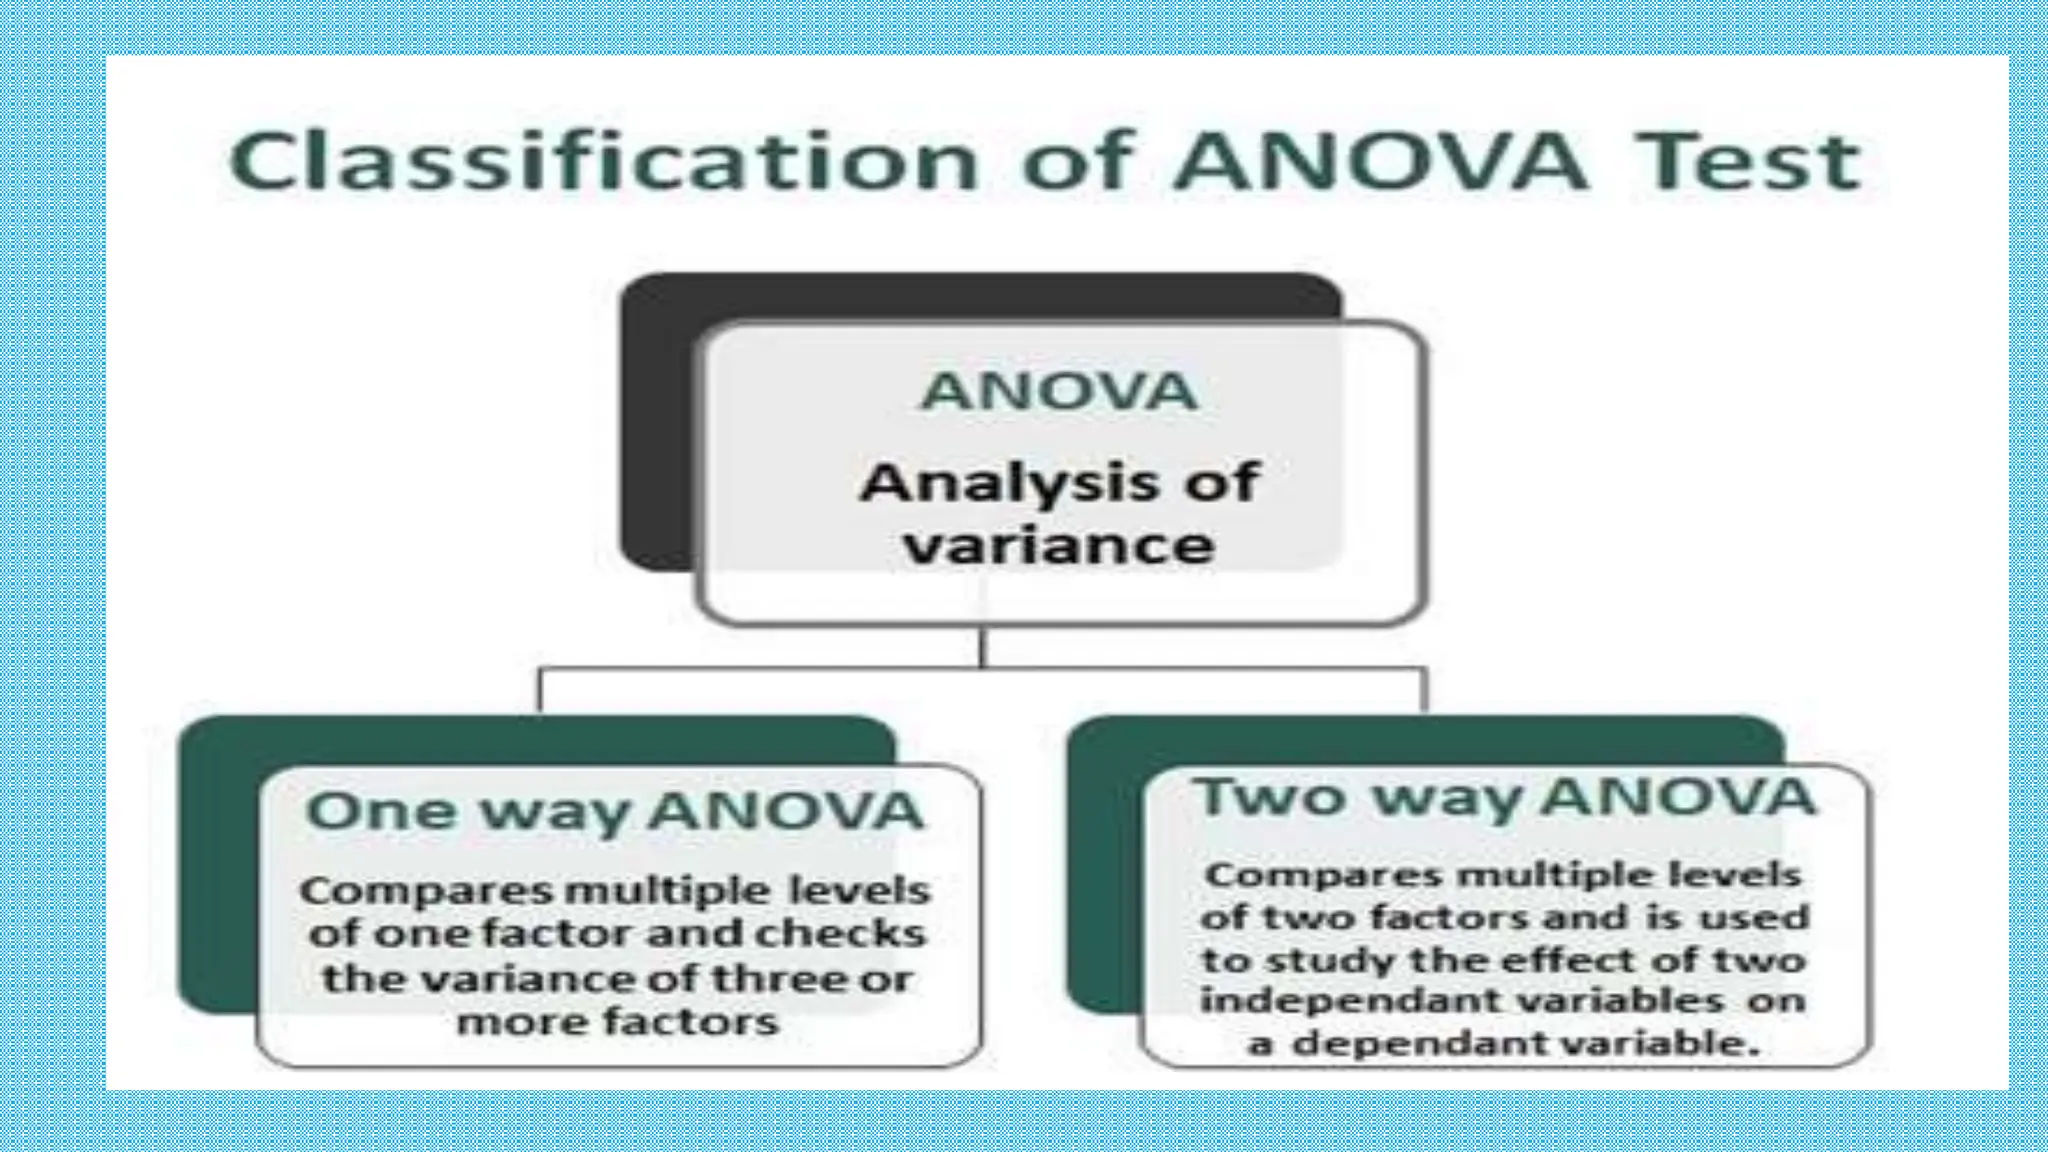
TYPES OF ANOVA
ONE WAY ANOVA:
compares the means of two or more
independent groups in order to determine
whether there is statistical evidence that the
associated population means are significantly
different
 One-Way ANOVA is a parametric test
This test is also known as: One-Factor
ANOVA
FUNCTION:
The one-way analysis of variance (ANOVA) is used to
determine whether there are any statistically significant
differences between the means of three or more
independent (unrelated) groups
TWO HYPOTHESES:
The null hypothesis (H0) is that there is no difference
between the groups and equality between means
(walruses weigh the same in different months).
The alternative hypothesis (H1) is that there is a
difference between the means and groups (walruses have
different weights in different months) .
TWO WAY ANOVA:
A two-way ANOVA is designed to
assess the interrelationship of two
independent variables on a dependent
variable
 compares the mean differences
between groups that have been split
on two independent variables (called
factors).
EXAMPLE:
You are researching which type of fertilizer and
planting density produces the greatest crop yield
in a field experiment. You assign different plots
in a field to a combination of fertilizer type (1, 2,
or 3) and planting density (1=low density,
2=high density), and measure the final crop
yield in per acre LAND at harvest time.
You can use a two-way ANOVA to find out if
fertilizer type and planting density have
an effect on average crop yield.
EXAMPLE:
A pharmacology research laboratory is testing
the effect of four drug candidates on the
concentration of nitric oxide (NO) in rat plasma
(n = 12). The data for the quantification of NO,
in µmol/L, is displayed below. Determine if the
treatments result in a significant change to the
concentration of NO in rat plasma. (α = 0.05)
STEP 1: TABULATE THE DATA ON
EXCEL SPREAD SHEET
STEP 2: “DATA” TAB > CLICK “DATA
ANALYSIS” > CLICK “ANOVA: SINGLE FACTOR”
> PRESS OK
STEP 3: HIGHLIGHT YOUR DATA
STEP 4: CLICK THE HIGHLIGHTED
BOX
STEP 5: SET THE SIGNIFICANCE
LEVEL
STEP 6: SELECT THE CIRCLE TO
THE LEFT OF “OUTPUT RANGE:
STEP 7: CLICK THE HIGHLIGHTED BOX TO
THE RIGHT OF “OUTPUT RANGE:”
STEP 8: CHOOSE AN EMPTY CELL ON YOUR
SPREADSHEET.
STEP 9: CHOOSE AN EMPTY CELL ON YOUR
SPREADSHEET.
STEP 10: CLICK THE HIGHLIGHTED BOX
STEP 11: PRESS “OK”
RESULT: EXCEL SHOULD GENERATE THE
TABLE SHOWN BELOW
INTERPRETATION OF THE RESULT
(PROBLEM 1)
WE performed the test at a significance
level (α) of 0.05. If you obtain a p-value
greater than 0.05, that means there is no
statistically significant difference between
the means due to a factor. However, in the
example shown above, we obtained a p-
value of 0.00281, which is lower than
0.05, meaning there is a statistically
significant difference (we reject H0!).
Since p ≤ 0.05, we have strong statistical
evidence that the factor (treatment) has
an effect (concentration of NO in rat
plasma) that is likely not due to chance
and we may reject H0. We may also state
that since p ≤ 0.05, there is a statistically
significant difference in the mean
concentrations of NO in rat plasma due
to the drug treatments (we accept H1!).

TYPES OF ANOVA.pptx

  • 1.
  • 3.
    ONE WAY ANOVA: comparesthe means of two or more independent groups in order to determine whether there is statistical evidence that the associated population means are significantly different  One-Way ANOVA is a parametric test This test is also known as: One-Factor ANOVA
  • 4.
    FUNCTION: The one-way analysisof variance (ANOVA) is used to determine whether there are any statistically significant differences between the means of three or more independent (unrelated) groups TWO HYPOTHESES: The null hypothesis (H0) is that there is no difference between the groups and equality between means (walruses weigh the same in different months). The alternative hypothesis (H1) is that there is a difference between the means and groups (walruses have different weights in different months) .
  • 5.
    TWO WAY ANOVA: Atwo-way ANOVA is designed to assess the interrelationship of two independent variables on a dependent variable  compares the mean differences between groups that have been split on two independent variables (called factors).
  • 6.
    EXAMPLE: You are researchingwhich type of fertilizer and planting density produces the greatest crop yield in a field experiment. You assign different plots in a field to a combination of fertilizer type (1, 2, or 3) and planting density (1=low density, 2=high density), and measure the final crop yield in per acre LAND at harvest time. You can use a two-way ANOVA to find out if fertilizer type and planting density have an effect on average crop yield.
  • 7.
    EXAMPLE: A pharmacology researchlaboratory is testing the effect of four drug candidates on the concentration of nitric oxide (NO) in rat plasma (n = 12). The data for the quantification of NO, in µmol/L, is displayed below. Determine if the treatments result in a significant change to the concentration of NO in rat plasma. (α = 0.05)
  • 8.
    STEP 1: TABULATETHE DATA ON EXCEL SPREAD SHEET
  • 9.
    STEP 2: “DATA”TAB > CLICK “DATA ANALYSIS” > CLICK “ANOVA: SINGLE FACTOR” > PRESS OK
  • 10.
  • 11.
    STEP 4: CLICKTHE HIGHLIGHTED BOX
  • 12.
    STEP 5: SETTHE SIGNIFICANCE LEVEL
  • 13.
    STEP 6: SELECTTHE CIRCLE TO THE LEFT OF “OUTPUT RANGE:
  • 14.
    STEP 7: CLICKTHE HIGHLIGHTED BOX TO THE RIGHT OF “OUTPUT RANGE:”
  • 15.
    STEP 8: CHOOSEAN EMPTY CELL ON YOUR SPREADSHEET.
  • 16.
    STEP 9: CHOOSEAN EMPTY CELL ON YOUR SPREADSHEET.
  • 17.
    STEP 10: CLICKTHE HIGHLIGHTED BOX
  • 18.
  • 19.
    RESULT: EXCEL SHOULDGENERATE THE TABLE SHOWN BELOW
  • 20.
    INTERPRETATION OF THERESULT (PROBLEM 1) WE performed the test at a significance level (α) of 0.05. If you obtain a p-value greater than 0.05, that means there is no statistically significant difference between the means due to a factor. However, in the example shown above, we obtained a p- value of 0.00281, which is lower than 0.05, meaning there is a statistically significant difference (we reject H0!).
  • 21.
    Since p ≤0.05, we have strong statistical evidence that the factor (treatment) has an effect (concentration of NO in rat plasma) that is likely not due to chance and we may reject H0. We may also state that since p ≤ 0.05, there is a statistically significant difference in the mean concentrations of NO in rat plasma due to the drug treatments (we accept H1!).