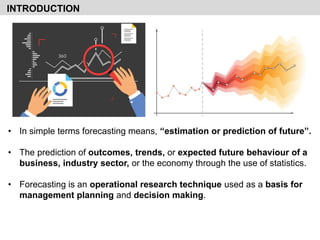
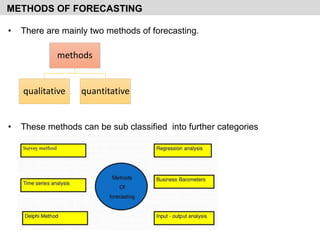
SlideShare a Scribd company logo
FORECASTING TECHNIQUES,
&
TIME SERIES ANALYSIS
Satish Kumar (21n78e@gmail.com)
Architect ,Urban Planner ,Researcher, G.C.A ,Lucknow,
Jamia Millia Islamia-Delhi, G..B.U-Greater Noida
CONTENT OF PRESENTATION
• Introduction
• Meaning
• Definition
• Features of forecasting
• Process of forecasting
• Importance of forecasting
• Advantages of forecasting
• Limitations of forecasting
• Methods of forecasting
• Conclusion
• In simple terms forecasting means, “estimation or prediction of future”.
• The prediction of outcomes, trends, or expected future behaviour of a
business, industry sector, or the economy through the use of statistics.
• Forecasting is an operational research technique used as a basis for
management planning and decision making.
INTRODUCTION
• Forecasting is a systematic guessing of the future course of events.
• Forecasting provides a basis for a planning.
• According to Fayol, forecasting includes both assessing the future
and making provision for it.
Definition
Websters new collegiate dictionary defines that,
“A forecast is a prediction and its purpose is to calculate and predict
some future events or condition.”
Allen L.A., “forecasting is a systemic attempt to probe the future by
inference from known facts.”
Neter & Wasserman, “business forecasting is refers to a statistical
analysis of the past and current movements in the given time series
so as to obtain clues about the future pattern of these movement.
MEANING & DEFINITION
• It is concerned with future events.
• It is necessary for planning process.
• The impact of future events has to be considered in the planning
process.
• It is a guessing of future events.
• It considers all the factors which affect organizational functions.
• Personal observation also helps forecasting.
FEATURES IN FORECASTING
1. Thorough preparation of foundation: The very purpose of thorough
preparation of a foundation is that the forecasting is based on the
foundation.
2. Estimation of future: The brightness of future period can be estimated in
consultation with the key personnel & it may be communicated to all the
employees of the business
3. Collection of results: Relevant records are prepared & maintained to
collect the result.
4. Comparison of results: The actual results are compared with estimated
results to know deviations.
5. This will help the management to estimate the future.
6. Refining the forecast: The forecast can be refined in the light of
deviations which seem to be more realistic.
PROCESS OF FORECASTING
1. Pivotal role in an organization:- Many organizations have failed
because of lack of forecasting or faulty forecasting. The reason is that
planning is based on accurate forecasting.
2. Development of a business:- The performance of specified objectives
depends upon the proper forecasting. So the development of a business
or an organization is fully based on the forecasting.
3. Co-ordination:- Forecasting helps to collect the information about
internal and external factors. Thus collected information provides a basis
for co-ordination.
4. Effective control:- Management executive can ascertain the strength
and weaknesses of sub-ordinates or employees through forecasting.
5. Key to success:- All business organizations are facing risks.
Forecasting provides clues and reduce risk and uncertainties. The
management executives can save the business and get success by
taking appropriate
IMPORTANCE OF FORECASTING
6. Implementation of project:- Many entrepreneurs implement a project on
the basis of their experience .Forecasting helps an entrepreneur to gain
experience and ensures him success.
7. Primacy to planning:- The information required for planning is supplied
by forecasting. So, forecasting is the primacy to the planning
IMPORTANCE OF FORECASTING
• Effective handling of uncertainty
• Better labor relations
• Balanced work-load
• Minimization in the fluctuations of production
• Better use of production facilities
• Better material management
• Better customer service
• Better utilization of capital and resources
• Better design of facilities and production system.
ADVANTAGES OF FORECASTING
• Forecasting is to be made on the basis of certain assumptions
and human judgments which yield wrong result.
• It can not be considered as a scientific method for guessing
future events.
• It does not specify any concrete relationship between past and
future events.
• It requires high degree of skill.
• It needs adequate reliable information so difficult to collect
reliable information.
• Heavy cost and time consuming.
• It can not be applied to a long period..
LIMITATIONS OF FORECASTING
METHODS OF FORECASTING
methods
qualitative quantitative
• There are mainly two methods of forecasting.
• These methods can be sub classified into further categories
1.Regression analysis
• Regression is concerned with obtaining a mathematical equation which
describes the relationship between two variables.
1. The independent variable is the one that is chosen freely or occurs
naturally.
2. The dependent variable occurs as a consequence of the value of the
independent variable.
• It is normally used for estimation purposes.
Simple Linear Regression
• Analysis of single regressor
• One independent variable explains the behavior of dependent variable
Multiple Regression
• Application with more than one regressor
• More than one independent variable explains the behavior of dependent
variable Simple Regression Analysis.
1.Regression analysis
• Type of regression models
• For example , if we take two inter related variables viz. cost of production
and profit ,there will be a direct relationship prevailing between this two
variables.
• It is possible to have an estimate of profit on the basis of cost of
production ,provided other things remain the same.
METHODS
2. Business barometer:-
• Index numbers are used to measure the state of condition of
business condition between two or more periods.
• Business trend, seasonal fluctuations of a business and cyclical
movements are studied with the help of index numbers.
3. Input and output analysis:-
• Under this method, a forecast can be made if the relationship
between input and output is known .
• At the same time , the input requirements can be forecast of the
basis of output.
• In other words, input can be determined on the basis of need of
output.
METHODS
4. Survey method:-
• Field survey can be conducted to collect information regarding
the attitude of people.
5. Time series analysis :-
• This method is quite accurate where future is expected to be
similar to the past.
• Time series analysis can be applied. Only when the data are
available for a long period of time.
METHODS
6. Delphi method:-
1. Rand corporation has developed the Delphi method initially in
1969 to forecast the military events.
2. Then, it has been applied in other areas also. Delphi method is
useful when past data are not available and where the past data
don’t give an indication for the future
3. A systematic forecasting method that involves structured
interaction among a group of experts on a subject.
 An organized method for collecting views and information
pertaining to a specific area.
 Gathering a group of experts to forecast events and assess
complex issues.
METHODS
How to use it:-
Process:-
TIME SERIES ANALYSIS
Definition
• “A time series is a set of observation taken at specified times,
usually at equal intervals”.
• Time series establish relation between “cause” & “Effects”.
• One variable is “Time” which is independent variable & and the
second is “Data” which is the dependent variable
EXAMPLE
• From example 1 it is clear that the sale of milk packets is decrease from
Monday to Friday then again its start to increase.
• Same thing in example 2 the population is continuously increase
IMPORTANCE OF TIME SERIES ANALYSIS
• As the basis of Time series Analysis businessman can predict
about the changes in economy. There are following points which
clear about the its importance:
1. Profit of experience.
2. Safety from future
3. Utility Studies
4. Sales Forecasting
5. Budgetary Analysis
6. Stock Market Analysis
7. Yield Projections
8. Process and Quality Control
9. Inventory Studies
10. Economic Forecasting
11. Risk Analysis & Evaluation of changes.
12. Census Analysis
COMPONENTS OF TIME SERIES ANALYSIS
• The change which are being in time series, They are effected by Economic,
Social, Natural, Industrial & Political Reasons. These reasons are called
components of Time Series.
• Secular trend :The increase or decrease in the movements of a time series is
called Secular trend.
• Seasonal variation :Seasonal variation are short-term fluctuation in a time
series which occur periodically in a year. This continues to repeat year after
year.
• Cyclical variation :Cyclical variations are recurrent upward or downward
movements in a time series but the period of cycle is greater than a year. Also
these variations are not regular as seasonal variation
• Irregular variation :Irregular variations are fluctuations in time series that are
short in duration, erratic in nature and follow no regularity in the occurrence
pattern. These variations are also referred to as residual variations since by
definition they represent what is left out in a time series after trend ,cyclical and
seasonal variations.
1. SECULAR TREND
• Secular trend :
• The increase or decrease in the movements of a time series is called Secular
trend.
• The secular trend refers to the general tendency of data to grow or decline over
a long period of time
• Eg:
• The population of India over years shows a definite rising tendency.
• The death rate in the country after independence shows a falling tendency
because of advancement of literacy and medical facilities.
• Here long period of time does not mean as several years.
• Whether a particular period can be regarded as long period or not in the study
of secular trend depends upon the nature of data.
2. SEASIONAL TREND
• Seasonal variation :
• Seasonal variation are short-term fluctuation in a time series which occur
periodically in a year. This continues to repeat year after year.
• Here the period of time may be monthly, weekly or hourly.
• There occur seasonal fluctuations in a time series due to two factors.
Due to natural forces
Manmadeconvention.
For example
• During winter there is greater demand for woolen clothes, hot drinks etc.
Where as in summer cotton clothes, cold drinks have a greater sale and in rainy
season umbrellas and rain coats have greater demand.
• Rainfall data in a particular area or moisture humidity variation in coastal areas
3. CYCLIC TREND
• Cyclical variation :Cyclical variations are recurrent upward or downward
movements in a time series but the period of cycle is greater than a year.
• Also these variations are not regular as seasonal variation
• One of the best examples for cyclical variations is „Business Cycle‟.
• In this cycle there are four well defined periods or phases.
*Boom
* Decline
* Depression
* Improvement
• The monthly housing demand and supply show strong seasonality within each
year, as well as some strong cyclic behaviour with a period of about 6–10
years. There is no apparent trend in the data over this period.
4. IRREGULAR TREND
• Irregular variation :Irregular variations are fluctuations in time series that are
short in duration, erratic in nature and follow no regularity in the occurrence
pattern.
• These variations are also referred to as residual variations since by definition
they represent what is left out in a time series after trend ,cyclical and seasonal
variations.
• Eg-Study of Earthquake disaster frequency in a particular area
CONCLUSION
• Thus, forecasting involves detailed analysis of the past and
present events with a view to draw conclusions about future
events.
• And to get a clear cut idea about probable events in the future.
FORECATING IN IBM SPSS
IBM SPSS Forecasting allows you to :
1. Control every parameter when building your data model
2. Use IBM SPSS Forecasting Expert Modeler recommendations as a starting point or to check
your work
Features and Benefits
Procedures available in IBM SPSS Forecasting include
PROCDEDURES
FOR
FORECASTING
TSMODEL
TSAPPLY
SEASON
SPECTRA

More Related Content

What's hot

Time Series
Time SeriesTime Series
Time Series
yush313
 

What's hot (20)

Time series slideshare
Time series slideshareTime series slideshare
Time series slideshare
 
Analysis of Time Series
Analysis of Time SeriesAnalysis of Time Series
Analysis of Time Series
 
Time series.ppt
Time series.pptTime series.ppt
Time series.ppt
 
Timeseries forecasting
Timeseries forecastingTimeseries forecasting
Timeseries forecasting
 
Time series analysis
Time series analysisTime series analysis
Time series analysis
 
Time Series Analysis, Components and Application in Forecasting
Time Series Analysis, Components and Application in ForecastingTime Series Analysis, Components and Application in Forecasting
Time Series Analysis, Components and Application in Forecasting
 
Quantitative forecasting
Quantitative forecastingQuantitative forecasting
Quantitative forecasting
 
Lesson 2 stationary_time_series
Lesson 2 stationary_time_seriesLesson 2 stationary_time_series
Lesson 2 stationary_time_series
 
FORECASTING MODELS
FORECASTING MODELSFORECASTING MODELS
FORECASTING MODELS
 
time series analysis
time series analysistime series analysis
time series analysis
 
Time Series - 1
Time Series - 1Time Series - 1
Time Series - 1
 
Time series
Time seriesTime series
Time series
 
Trend analysis and time Series Analysis
Trend analysis and time Series Analysis Trend analysis and time Series Analysis
Trend analysis and time Series Analysis
 
Time Series
Time SeriesTime Series
Time Series
 
Forecasting and methods of forecasting
Forecasting and methods of forecastingForecasting and methods of forecasting
Forecasting and methods of forecasting
 
Applications of regression analysis - Measurement of validity of relationship
Applications of regression analysis - Measurement of validity of relationshipApplications of regression analysis - Measurement of validity of relationship
Applications of regression analysis - Measurement of validity of relationship
 
Time Series Analysis.pptx
Time Series Analysis.pptxTime Series Analysis.pptx
Time Series Analysis.pptx
 
Forecasting
ForecastingForecasting
Forecasting
 
Moving average method maths ppt
Moving average method maths pptMoving average method maths ppt
Moving average method maths ppt
 
Time series Analysis
Time series AnalysisTime series Analysis
Time series Analysis
 

Similar to Forecasting techniques, time series analysis

Sales forecasting techniques
Sales forecasting techniquesSales forecasting techniques
Sales forecasting techniques
Abu Bashar
 
What is Forecasting.pdf
What is Forecasting.pdfWhat is Forecasting.pdf
What is Forecasting.pdf
Pankaj Chandel
 
Demand Forecasting
Demand ForecastingDemand Forecasting
Demand Forecasting
Anupam Basu
 

Similar to Forecasting techniques, time series analysis (20)

Forecasting in Management- Methods,features,advantages,importance and process
Forecasting in Management- Methods,features,advantages,importance and processForecasting in Management- Methods,features,advantages,importance and process
Forecasting in Management- Methods,features,advantages,importance and process
 
Sales forecasting techniques
Sales forecasting techniquesSales forecasting techniques
Sales forecasting techniques
 
forecasting
forecastingforecasting
forecasting
 
Planning and decision making.pptx
Planning and decision making.pptxPlanning and decision making.pptx
Planning and decision making.pptx
 
Topic1
Topic1Topic1
Topic1
 
What is Forecasting.pdf
What is Forecasting.pdfWhat is Forecasting.pdf
What is Forecasting.pdf
 
monitoring and evaluation
monitoring and evaluationmonitoring and evaluation
monitoring and evaluation
 
Forecasting.pptx
Forecasting.pptxForecasting.pptx
Forecasting.pptx
 
O M Unit 3 Forecasting
O M Unit 3 ForecastingO M Unit 3 Forecasting
O M Unit 3 Forecasting
 
PLANNING OF HEALTH SERVICES.. PREPARED BY NAMITA BANSKOTA
PLANNING OF HEALTH SERVICES.. PREPARED BY NAMITA BANSKOTAPLANNING OF HEALTH SERVICES.. PREPARED BY NAMITA BANSKOTA
PLANNING OF HEALTH SERVICES.. PREPARED BY NAMITA BANSKOTA
 
Demand Forecasting
Demand ForecastingDemand Forecasting
Demand Forecasting
 
Unit -III Planning and control M.sc II year.pptx
Unit -III Planning and control M.sc II year.pptxUnit -III Planning and control M.sc II year.pptx
Unit -III Planning and control M.sc II year.pptx
 
Forecasting and Decision Making
Forecasting and Decision MakingForecasting and Decision Making
Forecasting and Decision Making
 
SPPTChap003 (1).pptx
SPPTChap003 (1).pptxSPPTChap003 (1).pptx
SPPTChap003 (1).pptx
 
Forecasting Methods
Forecasting MethodsForecasting Methods
Forecasting Methods
 
Chapter - FIVE - DEMAND FORECASTING.pptx
Chapter - FIVE - DEMAND FORECASTING.pptxChapter - FIVE - DEMAND FORECASTING.pptx
Chapter - FIVE - DEMAND FORECASTING.pptx
 
Forecasting
ForecastingForecasting
Forecasting
 
Ashiq copy
Ashiq   copyAshiq   copy
Ashiq copy
 
Demandforecasting 1207335276942149-9
Demandforecasting 1207335276942149-9Demandforecasting 1207335276942149-9
Demandforecasting 1207335276942149-9
 
3...demand forecasting 1207335276942149-9
3...demand forecasting 1207335276942149-93...demand forecasting 1207335276942149-9
3...demand forecasting 1207335276942149-9
 

More from SATISH KUMAR

More from SATISH KUMAR (7)

Data mining
Data miningData mining
Data mining
 
Role of public participation
Role of public participationRole of public participation
Role of public participation
 
Application of remote sensing,population identification
Application of remote sensing,population identificationApplication of remote sensing,population identification
Application of remote sensing,population identification
 
NCR REGION
NCR REGIONNCR REGION
NCR REGION
 
The dynamics of privatopia
The dynamics of privatopia The dynamics of privatopia
The dynamics of privatopia
 
Planning Theory
Planning TheoryPlanning Theory
Planning Theory
 
Lucknow smart city
Lucknow smart cityLucknow smart city
Lucknow smart city
 

Recently uploaded

Digital Signal Processing Lecture notes n.pdf
Digital Signal Processing Lecture notes n.pdfDigital Signal Processing Lecture notes n.pdf
Digital Signal Processing Lecture notes n.pdf
AbrahamGadissa
 
Automobile Management System Project Report.pdf
Automobile Management System Project Report.pdfAutomobile Management System Project Report.pdf
Automobile Management System Project Report.pdf
Kamal Acharya
 
RS Khurmi Machine Design Clutch and Brake Exercise Numerical Solutions
RS Khurmi Machine Design Clutch and Brake Exercise Numerical SolutionsRS Khurmi Machine Design Clutch and Brake Exercise Numerical Solutions
RS Khurmi Machine Design Clutch and Brake Exercise Numerical Solutions
Atif Razi
 
CFD Simulation of By-pass Flow in a HRSG module by R&R Consult.pptx
CFD Simulation of By-pass Flow in a HRSG module by R&R Consult.pptxCFD Simulation of By-pass Flow in a HRSG module by R&R Consult.pptx
CFD Simulation of By-pass Flow in a HRSG module by R&R Consult.pptx
R&R Consult
 
Hall booking system project report .pdf
Hall booking system project report  .pdfHall booking system project report  .pdf
Hall booking system project report .pdf
Kamal Acharya
 

Recently uploaded (20)

2024 DevOps Pro Europe - Growing at the edge
2024 DevOps Pro Europe - Growing at the edge2024 DevOps Pro Europe - Growing at the edge
2024 DevOps Pro Europe - Growing at the edge
 
Digital Signal Processing Lecture notes n.pdf
Digital Signal Processing Lecture notes n.pdfDigital Signal Processing Lecture notes n.pdf
Digital Signal Processing Lecture notes n.pdf
 
KIT-601 Lecture Notes-UNIT-3.pdf Mining Data Stream
KIT-601 Lecture Notes-UNIT-3.pdf Mining Data StreamKIT-601 Lecture Notes-UNIT-3.pdf Mining Data Stream
KIT-601 Lecture Notes-UNIT-3.pdf Mining Data Stream
 
Democratizing Fuzzing at Scale by Abhishek Arya
Democratizing Fuzzing at Scale by Abhishek AryaDemocratizing Fuzzing at Scale by Abhishek Arya
Democratizing Fuzzing at Scale by Abhishek Arya
 
Introduction to Machine Learning Unit-5 Notes for II-II Mechanical Engineering
Introduction to Machine Learning Unit-5 Notes for II-II Mechanical EngineeringIntroduction to Machine Learning Unit-5 Notes for II-II Mechanical Engineering
Introduction to Machine Learning Unit-5 Notes for II-II Mechanical Engineering
 
BRAKING SYSTEM IN INDIAN RAILWAY AutoCAD DRAWING
BRAKING SYSTEM IN INDIAN RAILWAY AutoCAD DRAWINGBRAKING SYSTEM IN INDIAN RAILWAY AutoCAD DRAWING
BRAKING SYSTEM IN INDIAN RAILWAY AutoCAD DRAWING
 
Cloud-Computing_CSE311_Computer-Networking CSE GUB BD - Shahidul.pptx
Cloud-Computing_CSE311_Computer-Networking CSE GUB BD - Shahidul.pptxCloud-Computing_CSE311_Computer-Networking CSE GUB BD - Shahidul.pptx
Cloud-Computing_CSE311_Computer-Networking CSE GUB BD - Shahidul.pptx
 
NO1 Pandit Amil Baba In Bahawalpur, Sargodha, Sialkot, Sheikhupura, Rahim Yar...
NO1 Pandit Amil Baba In Bahawalpur, Sargodha, Sialkot, Sheikhupura, Rahim Yar...NO1 Pandit Amil Baba In Bahawalpur, Sargodha, Sialkot, Sheikhupura, Rahim Yar...
NO1 Pandit Amil Baba In Bahawalpur, Sargodha, Sialkot, Sheikhupura, Rahim Yar...
 
Pharmacy management system project report..pdf
Pharmacy management system project report..pdfPharmacy management system project report..pdf
Pharmacy management system project report..pdf
 
Explosives Industry manufacturing process.pdf
Explosives Industry manufacturing process.pdfExplosives Industry manufacturing process.pdf
Explosives Industry manufacturing process.pdf
 
Automobile Management System Project Report.pdf
Automobile Management System Project Report.pdfAutomobile Management System Project Report.pdf
Automobile Management System Project Report.pdf
 
retail automation billing system ppt.pptx
retail automation billing system ppt.pptxretail automation billing system ppt.pptx
retail automation billing system ppt.pptx
 
KIT-601 Lecture Notes-UNIT-5.pdf Frame Works and Visualization
KIT-601 Lecture Notes-UNIT-5.pdf Frame Works and VisualizationKIT-601 Lecture Notes-UNIT-5.pdf Frame Works and Visualization
KIT-601 Lecture Notes-UNIT-5.pdf Frame Works and Visualization
 
RS Khurmi Machine Design Clutch and Brake Exercise Numerical Solutions
RS Khurmi Machine Design Clutch and Brake Exercise Numerical SolutionsRS Khurmi Machine Design Clutch and Brake Exercise Numerical Solutions
RS Khurmi Machine Design Clutch and Brake Exercise Numerical Solutions
 
CFD Simulation of By-pass Flow in a HRSG module by R&R Consult.pptx
CFD Simulation of By-pass Flow in a HRSG module by R&R Consult.pptxCFD Simulation of By-pass Flow in a HRSG module by R&R Consult.pptx
CFD Simulation of By-pass Flow in a HRSG module by R&R Consult.pptx
 
Introduction to Machine Learning Unit-4 Notes for II-II Mechanical Engineering
Introduction to Machine Learning Unit-4 Notes for II-II Mechanical EngineeringIntroduction to Machine Learning Unit-4 Notes for II-II Mechanical Engineering
Introduction to Machine Learning Unit-4 Notes for II-II Mechanical Engineering
 
ENERGY STORAGE DEVICES INTRODUCTION UNIT-I
ENERGY STORAGE DEVICES  INTRODUCTION UNIT-IENERGY STORAGE DEVICES  INTRODUCTION UNIT-I
ENERGY STORAGE DEVICES INTRODUCTION UNIT-I
 
Hall booking system project report .pdf
Hall booking system project report  .pdfHall booking system project report  .pdf
Hall booking system project report .pdf
 
İTÜ CAD and Reverse Engineering Workshop
İTÜ CAD and Reverse Engineering WorkshopİTÜ CAD and Reverse Engineering Workshop
İTÜ CAD and Reverse Engineering Workshop
 
Arduino based vehicle speed tracker project
Arduino based vehicle speed tracker projectArduino based vehicle speed tracker project
Arduino based vehicle speed tracker project
 

Forecasting techniques, time series analysis

  • 1. FORECASTING TECHNIQUES, & TIME SERIES ANALYSIS Satish Kumar (21n78e@gmail.com) Architect ,Urban Planner ,Researcher, G.C.A ,Lucknow, Jamia Millia Islamia-Delhi, G..B.U-Greater Noida
  • 2. CONTENT OF PRESENTATION • Introduction • Meaning • Definition • Features of forecasting • Process of forecasting • Importance of forecasting • Advantages of forecasting • Limitations of forecasting • Methods of forecasting • Conclusion
  • 3. • In simple terms forecasting means, “estimation or prediction of future”. • The prediction of outcomes, trends, or expected future behaviour of a business, industry sector, or the economy through the use of statistics. • Forecasting is an operational research technique used as a basis for management planning and decision making. INTRODUCTION
  • 4. • Forecasting is a systematic guessing of the future course of events. • Forecasting provides a basis for a planning. • According to Fayol, forecasting includes both assessing the future and making provision for it. Definition Websters new collegiate dictionary defines that, “A forecast is a prediction and its purpose is to calculate and predict some future events or condition.” Allen L.A., “forecasting is a systemic attempt to probe the future by inference from known facts.” Neter & Wasserman, “business forecasting is refers to a statistical analysis of the past and current movements in the given time series so as to obtain clues about the future pattern of these movement. MEANING & DEFINITION
  • 5. • It is concerned with future events. • It is necessary for planning process. • The impact of future events has to be considered in the planning process. • It is a guessing of future events. • It considers all the factors which affect organizational functions. • Personal observation also helps forecasting. FEATURES IN FORECASTING
  • 6. 1. Thorough preparation of foundation: The very purpose of thorough preparation of a foundation is that the forecasting is based on the foundation. 2. Estimation of future: The brightness of future period can be estimated in consultation with the key personnel & it may be communicated to all the employees of the business 3. Collection of results: Relevant records are prepared & maintained to collect the result. 4. Comparison of results: The actual results are compared with estimated results to know deviations. 5. This will help the management to estimate the future. 6. Refining the forecast: The forecast can be refined in the light of deviations which seem to be more realistic. PROCESS OF FORECASTING
  • 7. 1. Pivotal role in an organization:- Many organizations have failed because of lack of forecasting or faulty forecasting. The reason is that planning is based on accurate forecasting. 2. Development of a business:- The performance of specified objectives depends upon the proper forecasting. So the development of a business or an organization is fully based on the forecasting. 3. Co-ordination:- Forecasting helps to collect the information about internal and external factors. Thus collected information provides a basis for co-ordination. 4. Effective control:- Management executive can ascertain the strength and weaknesses of sub-ordinates or employees through forecasting. 5. Key to success:- All business organizations are facing risks. Forecasting provides clues and reduce risk and uncertainties. The management executives can save the business and get success by taking appropriate IMPORTANCE OF FORECASTING
  • 8. 6. Implementation of project:- Many entrepreneurs implement a project on the basis of their experience .Forecasting helps an entrepreneur to gain experience and ensures him success. 7. Primacy to planning:- The information required for planning is supplied by forecasting. So, forecasting is the primacy to the planning IMPORTANCE OF FORECASTING
  • 9. • Effective handling of uncertainty • Better labor relations • Balanced work-load • Minimization in the fluctuations of production • Better use of production facilities • Better material management • Better customer service • Better utilization of capital and resources • Better design of facilities and production system. ADVANTAGES OF FORECASTING
  • 10. • Forecasting is to be made on the basis of certain assumptions and human judgments which yield wrong result. • It can not be considered as a scientific method for guessing future events. • It does not specify any concrete relationship between past and future events. • It requires high degree of skill. • It needs adequate reliable information so difficult to collect reliable information. • Heavy cost and time consuming. • It can not be applied to a long period.. LIMITATIONS OF FORECASTING
  • 11. METHODS OF FORECASTING methods qualitative quantitative • There are mainly two methods of forecasting. • These methods can be sub classified into further categories
  • 12. 1.Regression analysis • Regression is concerned with obtaining a mathematical equation which describes the relationship between two variables. 1. The independent variable is the one that is chosen freely or occurs naturally. 2. The dependent variable occurs as a consequence of the value of the independent variable. • It is normally used for estimation purposes. Simple Linear Regression • Analysis of single regressor • One independent variable explains the behavior of dependent variable Multiple Regression • Application with more than one regressor • More than one independent variable explains the behavior of dependent variable Simple Regression Analysis.
  • 13. 1.Regression analysis • Type of regression models • For example , if we take two inter related variables viz. cost of production and profit ,there will be a direct relationship prevailing between this two variables. • It is possible to have an estimate of profit on the basis of cost of production ,provided other things remain the same.
  • 14. METHODS 2. Business barometer:- • Index numbers are used to measure the state of condition of business condition between two or more periods. • Business trend, seasonal fluctuations of a business and cyclical movements are studied with the help of index numbers. 3. Input and output analysis:- • Under this method, a forecast can be made if the relationship between input and output is known . • At the same time , the input requirements can be forecast of the basis of output. • In other words, input can be determined on the basis of need of output.
  • 15. METHODS 4. Survey method:- • Field survey can be conducted to collect information regarding the attitude of people. 5. Time series analysis :- • This method is quite accurate where future is expected to be similar to the past. • Time series analysis can be applied. Only when the data are available for a long period of time.
  • 16. METHODS 6. Delphi method:- 1. Rand corporation has developed the Delphi method initially in 1969 to forecast the military events. 2. Then, it has been applied in other areas also. Delphi method is useful when past data are not available and where the past data don’t give an indication for the future 3. A systematic forecasting method that involves structured interaction among a group of experts on a subject.  An organized method for collecting views and information pertaining to a specific area.  Gathering a group of experts to forecast events and assess complex issues.
  • 17. METHODS How to use it:- Process:-
  • 18. TIME SERIES ANALYSIS Definition • “A time series is a set of observation taken at specified times, usually at equal intervals”. • Time series establish relation between “cause” & “Effects”. • One variable is “Time” which is independent variable & and the second is “Data” which is the dependent variable
  • 19. EXAMPLE • From example 1 it is clear that the sale of milk packets is decrease from Monday to Friday then again its start to increase. • Same thing in example 2 the population is continuously increase
  • 20. IMPORTANCE OF TIME SERIES ANALYSIS • As the basis of Time series Analysis businessman can predict about the changes in economy. There are following points which clear about the its importance: 1. Profit of experience. 2. Safety from future 3. Utility Studies 4. Sales Forecasting 5. Budgetary Analysis 6. Stock Market Analysis 7. Yield Projections 8. Process and Quality Control 9. Inventory Studies 10. Economic Forecasting 11. Risk Analysis & Evaluation of changes. 12. Census Analysis
  • 21. COMPONENTS OF TIME SERIES ANALYSIS • The change which are being in time series, They are effected by Economic, Social, Natural, Industrial & Political Reasons. These reasons are called components of Time Series. • Secular trend :The increase or decrease in the movements of a time series is called Secular trend. • Seasonal variation :Seasonal variation are short-term fluctuation in a time series which occur periodically in a year. This continues to repeat year after year. • Cyclical variation :Cyclical variations are recurrent upward or downward movements in a time series but the period of cycle is greater than a year. Also these variations are not regular as seasonal variation • Irregular variation :Irregular variations are fluctuations in time series that are short in duration, erratic in nature and follow no regularity in the occurrence pattern. These variations are also referred to as residual variations since by definition they represent what is left out in a time series after trend ,cyclical and seasonal variations.
  • 22. 1. SECULAR TREND • Secular trend : • The increase or decrease in the movements of a time series is called Secular trend. • The secular trend refers to the general tendency of data to grow or decline over a long period of time • Eg: • The population of India over years shows a definite rising tendency. • The death rate in the country after independence shows a falling tendency because of advancement of literacy and medical facilities. • Here long period of time does not mean as several years. • Whether a particular period can be regarded as long period or not in the study of secular trend depends upon the nature of data.
  • 23. 2. SEASIONAL TREND • Seasonal variation : • Seasonal variation are short-term fluctuation in a time series which occur periodically in a year. This continues to repeat year after year. • Here the period of time may be monthly, weekly or hourly. • There occur seasonal fluctuations in a time series due to two factors. Due to natural forces Manmadeconvention. For example • During winter there is greater demand for woolen clothes, hot drinks etc. Where as in summer cotton clothes, cold drinks have a greater sale and in rainy season umbrellas and rain coats have greater demand. • Rainfall data in a particular area or moisture humidity variation in coastal areas
  • 24. 3. CYCLIC TREND • Cyclical variation :Cyclical variations are recurrent upward or downward movements in a time series but the period of cycle is greater than a year. • Also these variations are not regular as seasonal variation • One of the best examples for cyclical variations is „Business Cycle‟. • In this cycle there are four well defined periods or phases. *Boom * Decline * Depression * Improvement • The monthly housing demand and supply show strong seasonality within each year, as well as some strong cyclic behaviour with a period of about 6–10 years. There is no apparent trend in the data over this period.
  • 25. 4. IRREGULAR TREND • Irregular variation :Irregular variations are fluctuations in time series that are short in duration, erratic in nature and follow no regularity in the occurrence pattern. • These variations are also referred to as residual variations since by definition they represent what is left out in a time series after trend ,cyclical and seasonal variations. • Eg-Study of Earthquake disaster frequency in a particular area
  • 26. CONCLUSION • Thus, forecasting involves detailed analysis of the past and present events with a view to draw conclusions about future events. • And to get a clear cut idea about probable events in the future.
  • 28. IBM SPSS Forecasting allows you to : 1. Control every parameter when building your data model 2. Use IBM SPSS Forecasting Expert Modeler recommendations as a starting point or to check your work Features and Benefits
  • 29. Procedures available in IBM SPSS Forecasting include PROCDEDURES FOR FORECASTING TSMODEL TSAPPLY SEASON SPECTRA