Download to read offline
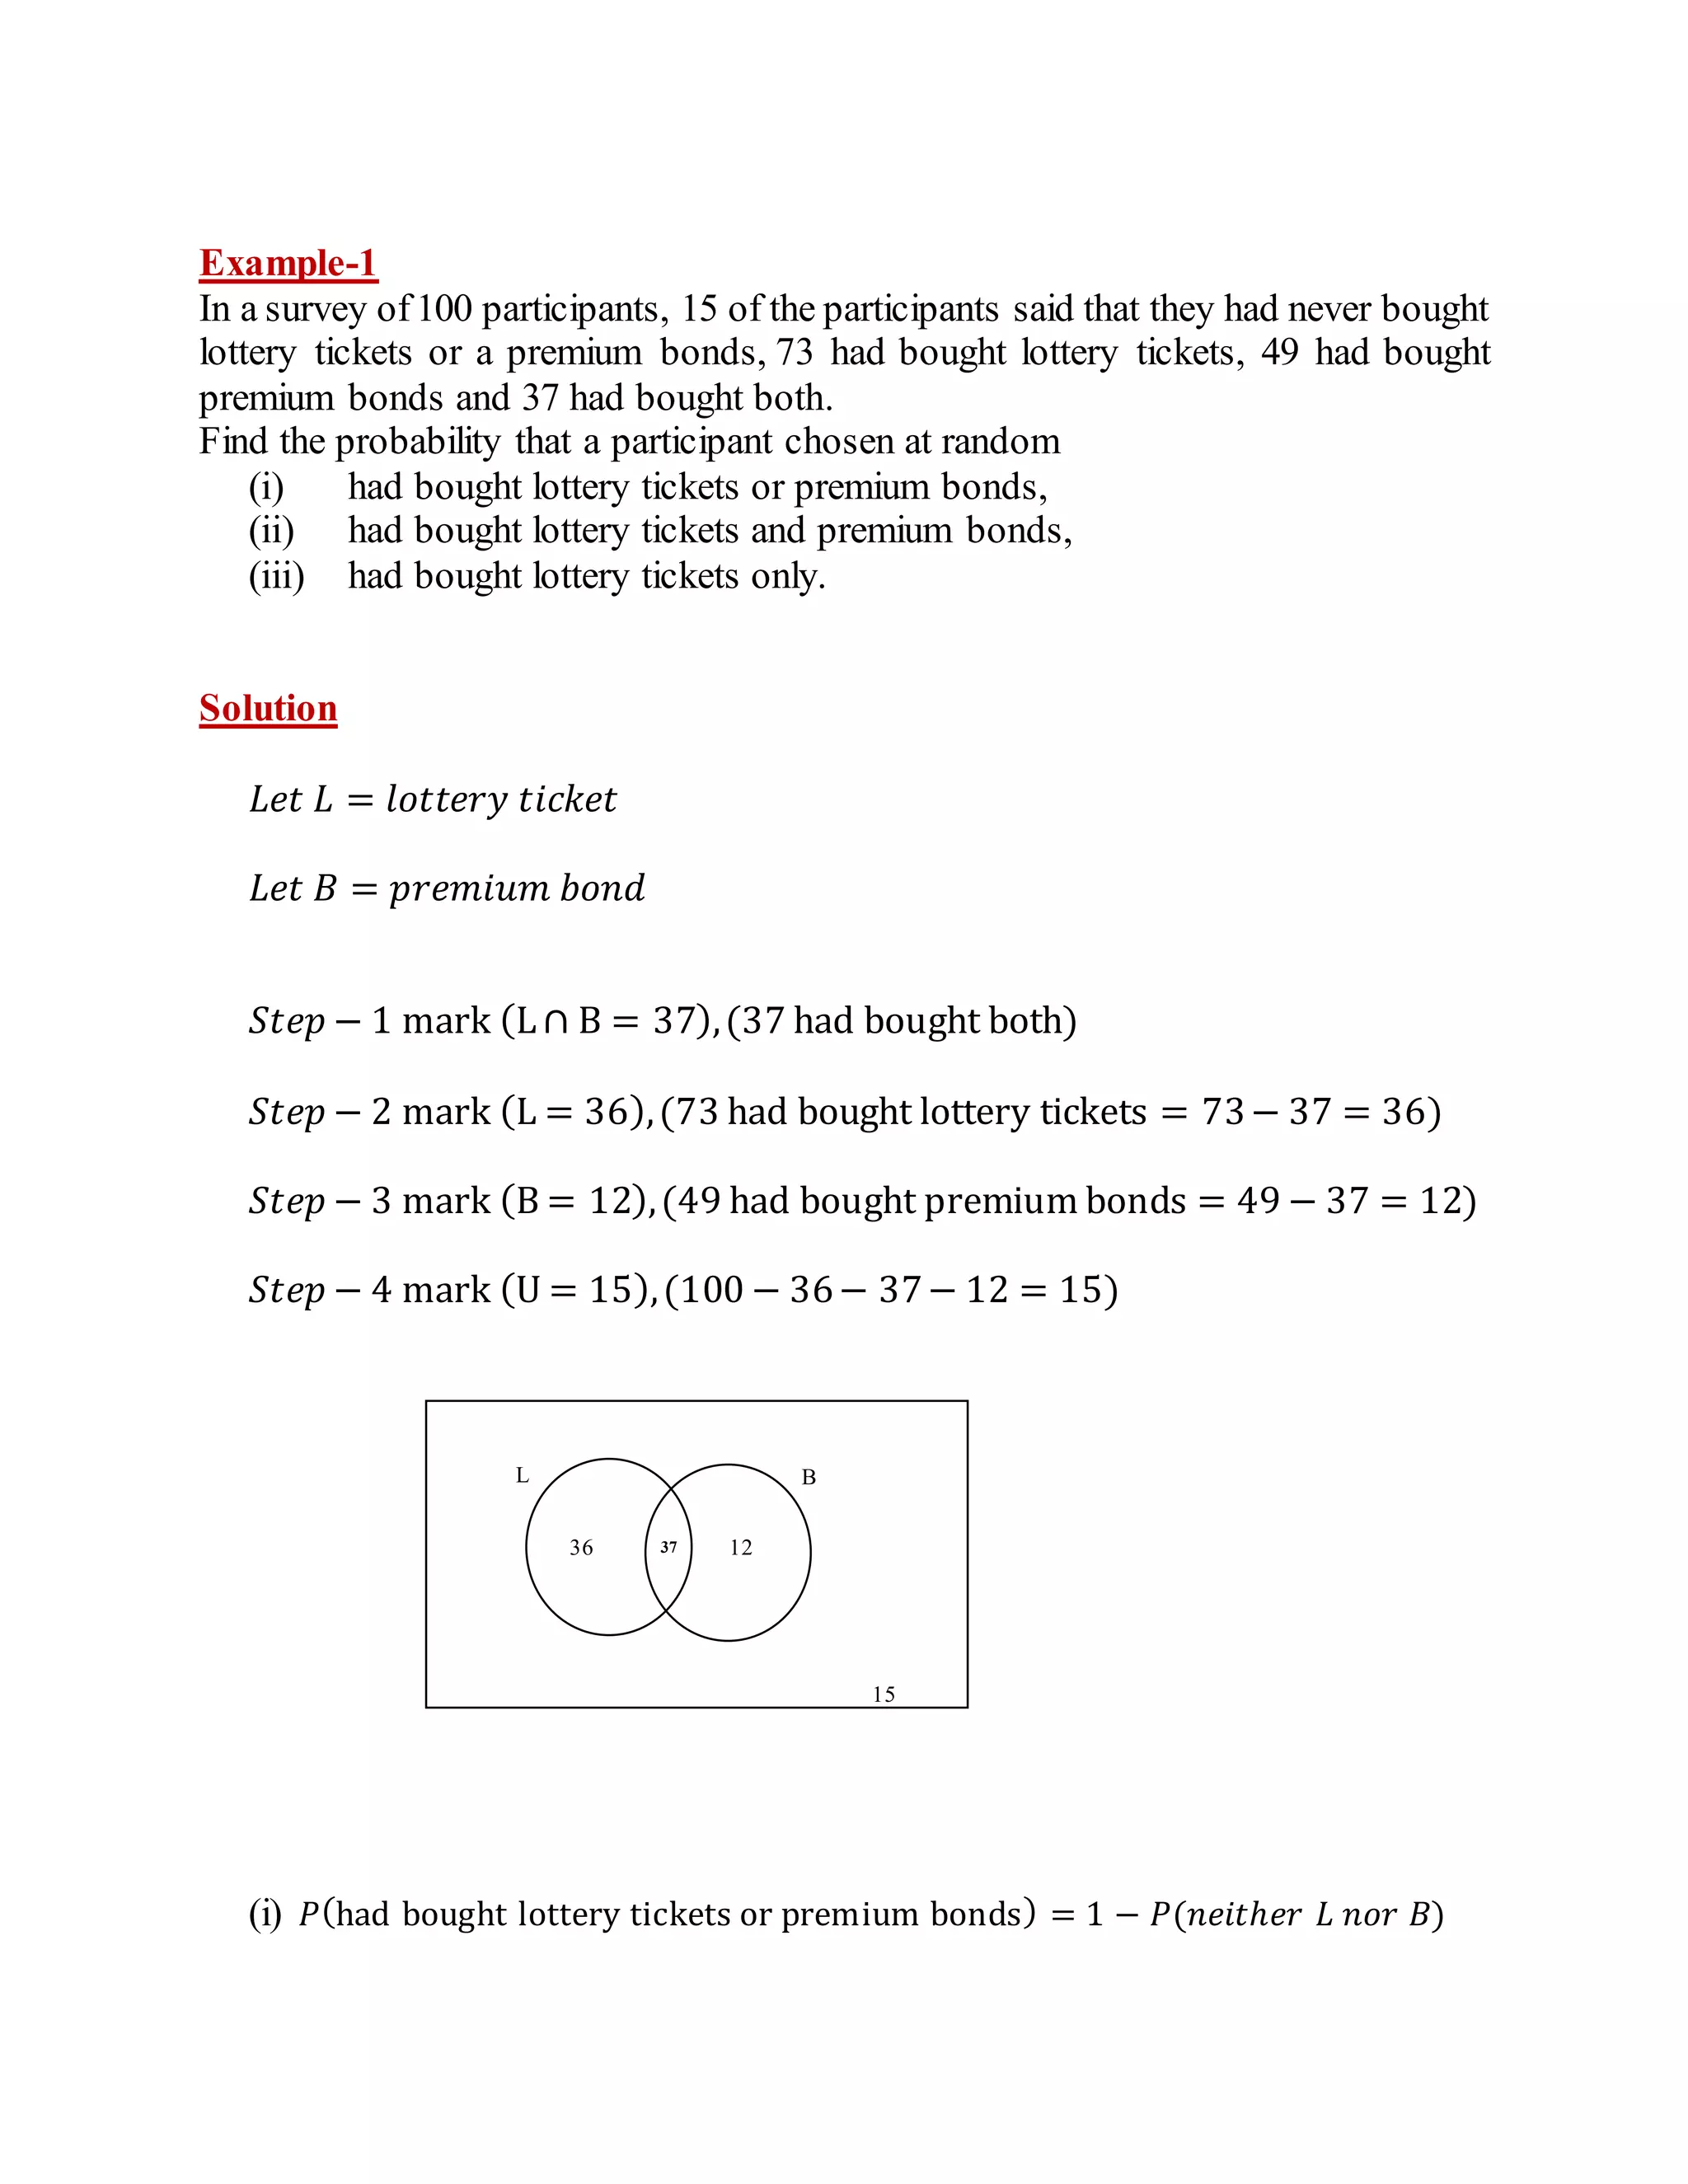
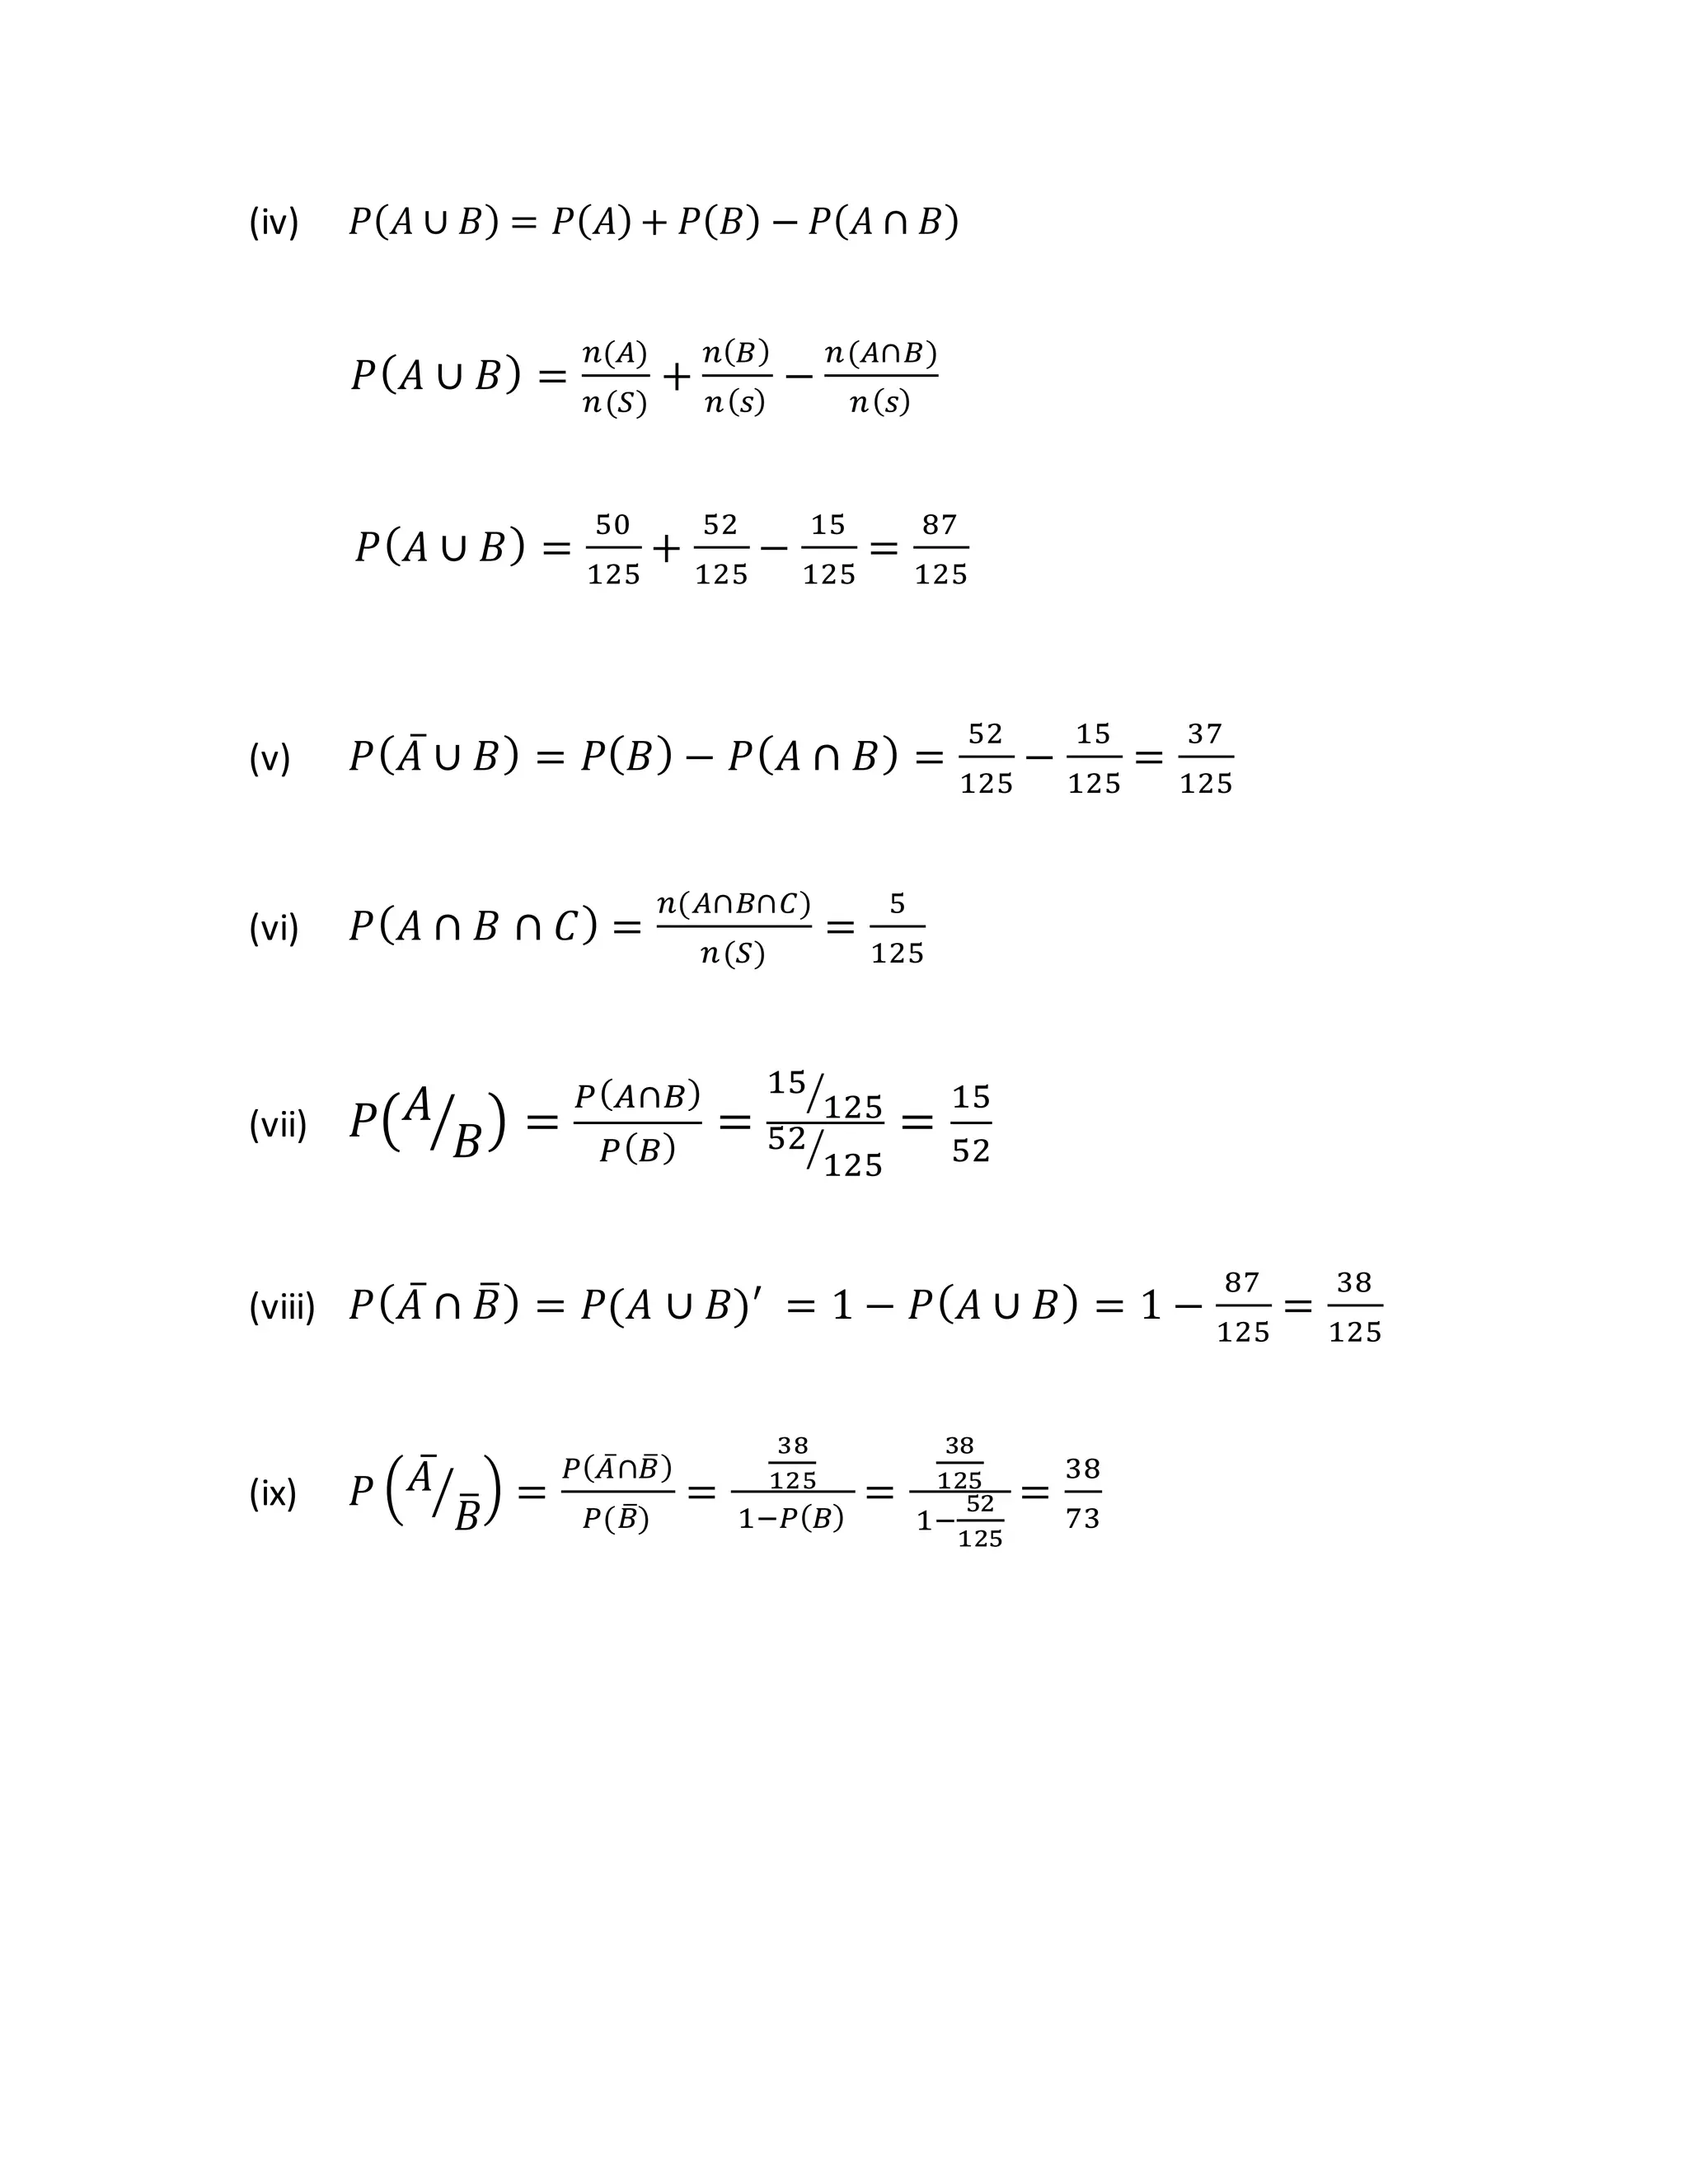

The document contains 4 examples that demonstrate how to calculate probabilities from data presented in Venn diagrams or surveys. Each example provides the data in a table or paragraph and represents it in a Venn diagram. It then shows the step-by-step work to calculate various probabilities requested, such as the probability of an event occurring, not occurring, or the probability of an intersection or union of events.