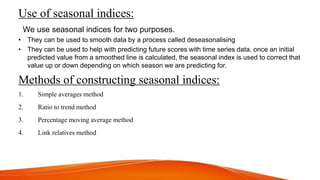
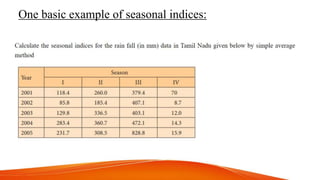
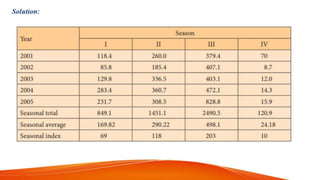
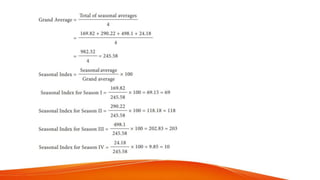
SlideShare a Scribd company logo
1 of 13
prepared by:
• 2246135-Nischal Jaiswal
• 2246138-Nitin Aggarwal
• 2246148-Pritiprasun Sahoo
• 2246174-Sai Smruti Sarangi
• 2246276-Sasindu Hansaka
• 2246277-Krishanth Raahul
submitted to:
MS.Tulasi M Maharatha
Contents :
1. INTRODUCTION AND DEFINATION OF TIME SERIES .
2. COMPONENTS OF TIME SERIES .
3. USES OF SEASONAL INDICES .
4. ONE BASIC EXAMPLE OF SEASONAL INDICES .
Introduction:
We know that planning about future is very necessary for the every business firm, every
govt. institute, every individual and for every country. Every family is also doing planning for
his income expenditure. As like every business is doing planning for possibilities of its
financial resources & sales and for maximization its profit.
,,Definations : "A time series is a set of observation taken at
specified times, usually at equal intervals".
"A time series may be defined as a collection of reading belonging to different time periods
of some economic or composite variables".
By-Ya-Lun-Chau
• Time series establish relation between "cause" & "Effects"
• One variable is "Time" which is independent variable & and the second is "Data" which
is the dependent variable.
Components of Time series:
The change which are being in time series, They are effected by
Economic, Social, Natural, Industrial & Political Reasons. These
reasons are called components of Time Series.
SECULAR TREND :-
SEASONAL VARIATION :-
CYCLICAL VARIATION :-
IRREGULAR VARIATION :-
 Secular trend:-
The increase or decrease in the movements of a time series is called
Secular trend.
A time series data may show upward trend or downward trend for a period of years and
this may be due to factors like:
 increase in population,
 change in technological progress,
 large scale shift in consumers demands,
For example,
• population increases over a period of time,price increases over a period of years, production
of goods on the capital market of the country increases over a period of years.These are the
examples of upward trend.
• The sales of a commodity may decrease over a period of time because of better products
coming to the market. This is an example of declining trend or downward.
 Seasonal variation:
Seasonal variation are short-term fluctuation in a time series which occur
periodically in a year.
This continues to repeat year after year.
 The major factors that are weather conditions and customs of people.
 More woolen clothes are sold in winter than in the season of summer.
 Each year more ice creams are sold in summer and very little in Winter
season.
 The sales in the departmental stores are more during festive seasons that in
the normal days.
 Cyclical Variations:
 Cyclical variations are recurrent
upward or downward movements in
a time series but the period of cycle
is greater than a year. Also these
variations are not regular as
seasonal variation.
 A business cycle showing these
oscillatory movements has to pass
through four phases-prosperity,
recession, depression and
recovery. In a business, these four
phases are completed by passing
one to another in this order.
 Irregular variation:
Irregular variations are fluctuations in time series that are short in
duration, erratic in nature and follow no regularity in the occurrence pattern.
These variations are also referred to as residual variations since by definition
they represent what is left out in a time series after trend,cyclical and seasonal
variations. Irregular fluctuations results due to the occurrence of unforeseen
events like:
 FLOODS,
 EARTHQUAKES,
 WARS,
 FAMINES
Use of seasonal indices:
We use seasonal indices for two purposes.
• They can be used to smooth data by a process called deseasonalising
• They can be used to help with predicting future scores with time series data. once an initial
predicted value from a smoothed line is calculated, the seasonal index is used to correct that
value up or down depending on which season we are predicting for.
Methods of constructing seasonal indices:
1. Simple averages method
2. Ratio to trend method
3. Percentage moving average method
4. Link relatives method
One basic example of seasonal indices:
TIME SERIES
TIME SERIES
TIME SERIES

More Related Content

Similar to TIME SERIES

Business forecasting and timeseries analysis phpapp02
Business forecasting and timeseries analysis phpapp02Business forecasting and timeseries analysis phpapp02
Business forecasting and timeseries analysis phpapp02MD ASADUZZAMAN
 
Theories of trade cycle
Theories of trade cycle Theories of trade cycle
Theories of trade cycle Ram Kumar
 
Trend and Seasonal Components / abshor.marantika / Dwi Puspita Rini
Trend and Seasonal Components / abshor.marantika / Dwi Puspita RiniTrend and Seasonal Components / abshor.marantika / Dwi Puspita Rini
Trend and Seasonal Components / abshor.marantika / Dwi Puspita RiniDwi Puspita Rini
 
time series.pdf
time series.pdftime series.pdf
time series.pdfcollege
 
Module 3 - Time Series.pptx
Module 3 - Time Series.pptxModule 3 - Time Series.pptx
Module 3 - Time Series.pptxnikshaikh786
 
Time serial forcasting
Time serial forcastingTime serial forcasting
Time serial forcastingomaraldabash
 
demand forecasting
demand forecastingdemand forecasting
demand forecastingserveuuu
 
24_KMBN102-Unit 5 economicsLesson 1.pptx
24_KMBN102-Unit 5 economicsLesson 1.pptx24_KMBN102-Unit 5 economicsLesson 1.pptx
24_KMBN102-Unit 5 economicsLesson 1.pptxPriyanshuSingh578922
 
A 063 ashish gupta tradecycle
A 063 ashish gupta tradecycleA 063 ashish gupta tradecycle
A 063 ashish gupta tradecycleashishgupta1602
 
BUSINESS CYCLE (NOTES).pdf
BUSINESS CYCLE (NOTES).pdfBUSINESS CYCLE (NOTES).pdf
BUSINESS CYCLE (NOTES).pdfamu aligarh
 
Forecasting techniques, time series analysis
Forecasting techniques, time series analysisForecasting techniques, time series analysis
Forecasting techniques, time series analysisSATISH KUMAR
 
Demand forecasting by time series analysis
Demand forecasting by time series analysisDemand forecasting by time series analysis
Demand forecasting by time series analysisSunny Gandhi
 
Applied Statistics Chapter 2 Time series (1).ppt
Applied Statistics Chapter 2 Time series (1).pptApplied Statistics Chapter 2 Time series (1).ppt
Applied Statistics Chapter 2 Time series (1).pptswamyvivekp
 
Visualizing Risk and Correlation 9-7-2014 qwafafew
Visualizing Risk and Correlation   9-7-2014   qwafafewVisualizing Risk and Correlation   9-7-2014   qwafafew
Visualizing Risk and Correlation 9-7-2014 qwafafewMacropru Reader
 

Similar to TIME SERIES (20)

Forecasting Methods
Forecasting MethodsForecasting Methods
Forecasting Methods
 
Business forecasting and timeseries analysis phpapp02
Business forecasting and timeseries analysis phpapp02Business forecasting and timeseries analysis phpapp02
Business forecasting and timeseries analysis phpapp02
 
Theories of trade cycle
Theories of trade cycle Theories of trade cycle
Theories of trade cycle
 
Time series
Time seriesTime series
Time series
 
Trend and Seasonal Components / abshor.marantika / Dwi Puspita Rini
Trend and Seasonal Components / abshor.marantika / Dwi Puspita RiniTrend and Seasonal Components / abshor.marantika / Dwi Puspita Rini
Trend and Seasonal Components / abshor.marantika / Dwi Puspita Rini
 
time series.pdf
time series.pdftime series.pdf
time series.pdf
 
Business cycles 2
Business cycles 2Business cycles 2
Business cycles 2
 
Trade cycle
Trade cycleTrade cycle
Trade cycle
 
Module 3 - Time Series.pptx
Module 3 - Time Series.pptxModule 3 - Time Series.pptx
Module 3 - Time Series.pptx
 
Macroeconomics.pptx
Macroeconomics.pptxMacroeconomics.pptx
Macroeconomics.pptx
 
Time serial forcasting
Time serial forcastingTime serial forcasting
Time serial forcasting
 
demand forecasting
demand forecastingdemand forecasting
demand forecasting
 
24_KMBN102-Unit 5 economicsLesson 1.pptx
24_KMBN102-Unit 5 economicsLesson 1.pptx24_KMBN102-Unit 5 economicsLesson 1.pptx
24_KMBN102-Unit 5 economicsLesson 1.pptx
 
A 063 ashish gupta tradecycle
A 063 ashish gupta tradecycleA 063 ashish gupta tradecycle
A 063 ashish gupta tradecycle
 
BUSINESS CYCLE (NOTES).pdf
BUSINESS CYCLE (NOTES).pdfBUSINESS CYCLE (NOTES).pdf
BUSINESS CYCLE (NOTES).pdf
 
Forecasting techniques, time series analysis
Forecasting techniques, time series analysisForecasting techniques, time series analysis
Forecasting techniques, time series analysis
 
Business cycle final ppt
Business cycle final pptBusiness cycle final ppt
Business cycle final ppt
 
Demand forecasting by time series analysis
Demand forecasting by time series analysisDemand forecasting by time series analysis
Demand forecasting by time series analysis
 
Applied Statistics Chapter 2 Time series (1).ppt
Applied Statistics Chapter 2 Time series (1).pptApplied Statistics Chapter 2 Time series (1).ppt
Applied Statistics Chapter 2 Time series (1).ppt
 
Visualizing Risk and Correlation 9-7-2014 qwafafew
Visualizing Risk and Correlation   9-7-2014   qwafafewVisualizing Risk and Correlation   9-7-2014   qwafafew
Visualizing Risk and Correlation 9-7-2014 qwafafew
 

Recently uploaded

JAPAN: ORGANISATION OF PMDA, PHARMACEUTICAL LAWS & REGULATIONS, TYPES OF REGI...
JAPAN: ORGANISATION OF PMDA, PHARMACEUTICAL LAWS & REGULATIONS, TYPES OF REGI...JAPAN: ORGANISATION OF PMDA, PHARMACEUTICAL LAWS & REGULATIONS, TYPES OF REGI...
JAPAN: ORGANISATION OF PMDA, PHARMACEUTICAL LAWS & REGULATIONS, TYPES OF REGI...anjaliyadav012327
 
Presentation by Andreas Schleicher Tackling the School Absenteeism Crisis 30 ...
Presentation by Andreas Schleicher Tackling the School Absenteeism Crisis 30 ...Presentation by Andreas Schleicher Tackling the School Absenteeism Crisis 30 ...
Presentation by Andreas Schleicher Tackling the School Absenteeism Crisis 30 ...EduSkills OECD
 
Z Score,T Score, Percential Rank and Box Plot Graph
Z Score,T Score, Percential Rank and Box Plot GraphZ Score,T Score, Percential Rank and Box Plot Graph
Z Score,T Score, Percential Rank and Box Plot GraphThiyagu K
 
Beyond the EU: DORA and NIS 2 Directive's Global Impact
Beyond the EU: DORA and NIS 2 Directive's Global ImpactBeyond the EU: DORA and NIS 2 Directive's Global Impact
Beyond the EU: DORA and NIS 2 Directive's Global ImpactPECB
 
Activity 01 - Artificial Culture (1).pdf
Activity 01 - Artificial Culture (1).pdfActivity 01 - Artificial Culture (1).pdf
Activity 01 - Artificial Culture (1).pdfciinovamais
 
mini mental status format.docx
mini    mental       status     format.docxmini    mental       status     format.docx
mini mental status format.docxPoojaSen20
 
Accessible design: Minimum effort, maximum impact
Accessible design: Minimum effort, maximum impactAccessible design: Minimum effort, maximum impact
Accessible design: Minimum effort, maximum impactdawncurless
 
The Most Excellent Way | 1 Corinthians 13
The Most Excellent Way | 1 Corinthians 13The Most Excellent Way | 1 Corinthians 13
The Most Excellent Way | 1 Corinthians 13Steve Thomason
 
1029 - Danh muc Sach Giao Khoa 10 . pdf
1029 -  Danh muc Sach Giao Khoa 10 . pdf1029 -  Danh muc Sach Giao Khoa 10 . pdf
1029 - Danh muc Sach Giao Khoa 10 . pdfQucHHunhnh
 
BASLIQ CURRENT LOOKBOOK LOOKBOOK(1) (1).pdf
BASLIQ CURRENT LOOKBOOK  LOOKBOOK(1) (1).pdfBASLIQ CURRENT LOOKBOOK  LOOKBOOK(1) (1).pdf
BASLIQ CURRENT LOOKBOOK LOOKBOOK(1) (1).pdfSoniaTolstoy
 
APM Welcome, APM North West Network Conference, Synergies Across Sectors
APM Welcome, APM North West Network Conference, Synergies Across SectorsAPM Welcome, APM North West Network Conference, Synergies Across Sectors
APM Welcome, APM North West Network Conference, Synergies Across SectorsAssociation for Project Management
 
Software Engineering Methodologies (overview)
Software Engineering Methodologies (overview)Software Engineering Methodologies (overview)
Software Engineering Methodologies (overview)eniolaolutunde
 
Nutritional Needs Presentation - HLTH 104
Nutritional Needs Presentation - HLTH 104Nutritional Needs Presentation - HLTH 104
Nutritional Needs Presentation - HLTH 104misteraugie
 
Student login on Anyboli platform.helpin
Student login on Anyboli platform.helpinStudent login on Anyboli platform.helpin
Student login on Anyboli platform.helpinRaunakKeshri1
 
SOCIAL AND HISTORICAL CONTEXT - LFTVD.pptx
SOCIAL AND HISTORICAL CONTEXT - LFTVD.pptxSOCIAL AND HISTORICAL CONTEXT - LFTVD.pptx
SOCIAL AND HISTORICAL CONTEXT - LFTVD.pptxiammrhaywood
 
Call Girls in Dwarka Mor Delhi Contact Us 9654467111
Call Girls in Dwarka Mor Delhi Contact Us 9654467111Call Girls in Dwarka Mor Delhi Contact Us 9654467111
Call Girls in Dwarka Mor Delhi Contact Us 9654467111Sapana Sha
 

Recently uploaded (20)

JAPAN: ORGANISATION OF PMDA, PHARMACEUTICAL LAWS & REGULATIONS, TYPES OF REGI...
JAPAN: ORGANISATION OF PMDA, PHARMACEUTICAL LAWS & REGULATIONS, TYPES OF REGI...JAPAN: ORGANISATION OF PMDA, PHARMACEUTICAL LAWS & REGULATIONS, TYPES OF REGI...
JAPAN: ORGANISATION OF PMDA, PHARMACEUTICAL LAWS & REGULATIONS, TYPES OF REGI...
 
Presentation by Andreas Schleicher Tackling the School Absenteeism Crisis 30 ...
Presentation by Andreas Schleicher Tackling the School Absenteeism Crisis 30 ...Presentation by Andreas Schleicher Tackling the School Absenteeism Crisis 30 ...
Presentation by Andreas Schleicher Tackling the School Absenteeism Crisis 30 ...
 
Z Score,T Score, Percential Rank and Box Plot Graph
Z Score,T Score, Percential Rank and Box Plot GraphZ Score,T Score, Percential Rank and Box Plot Graph
Z Score,T Score, Percential Rank and Box Plot Graph
 
Mattingly "AI & Prompt Design: Structured Data, Assistants, & RAG"
Mattingly "AI & Prompt Design: Structured Data, Assistants, & RAG"Mattingly "AI & Prompt Design: Structured Data, Assistants, & RAG"
Mattingly "AI & Prompt Design: Structured Data, Assistants, & RAG"
 
Beyond the EU: DORA and NIS 2 Directive's Global Impact
Beyond the EU: DORA and NIS 2 Directive's Global ImpactBeyond the EU: DORA and NIS 2 Directive's Global Impact
Beyond the EU: DORA and NIS 2 Directive's Global Impact
 
Activity 01 - Artificial Culture (1).pdf
Activity 01 - Artificial Culture (1).pdfActivity 01 - Artificial Culture (1).pdf
Activity 01 - Artificial Culture (1).pdf
 
mini mental status format.docx
mini    mental       status     format.docxmini    mental       status     format.docx
mini mental status format.docx
 
Accessible design: Minimum effort, maximum impact
Accessible design: Minimum effort, maximum impactAccessible design: Minimum effort, maximum impact
Accessible design: Minimum effort, maximum impact
 
INDIA QUIZ 2024 RLAC DELHI UNIVERSITY.pptx
INDIA QUIZ 2024 RLAC DELHI UNIVERSITY.pptxINDIA QUIZ 2024 RLAC DELHI UNIVERSITY.pptx
INDIA QUIZ 2024 RLAC DELHI UNIVERSITY.pptx
 
The Most Excellent Way | 1 Corinthians 13
The Most Excellent Way | 1 Corinthians 13The Most Excellent Way | 1 Corinthians 13
The Most Excellent Way | 1 Corinthians 13
 
1029 - Danh muc Sach Giao Khoa 10 . pdf
1029 -  Danh muc Sach Giao Khoa 10 . pdf1029 -  Danh muc Sach Giao Khoa 10 . pdf
1029 - Danh muc Sach Giao Khoa 10 . pdf
 
BASLIQ CURRENT LOOKBOOK LOOKBOOK(1) (1).pdf
BASLIQ CURRENT LOOKBOOK  LOOKBOOK(1) (1).pdfBASLIQ CURRENT LOOKBOOK  LOOKBOOK(1) (1).pdf
BASLIQ CURRENT LOOKBOOK LOOKBOOK(1) (1).pdf
 
Código Creativo y Arte de Software | Unidad 1
Código Creativo y Arte de Software | Unidad 1Código Creativo y Arte de Software | Unidad 1
Código Creativo y Arte de Software | Unidad 1
 
APM Welcome, APM North West Network Conference, Synergies Across Sectors
APM Welcome, APM North West Network Conference, Synergies Across SectorsAPM Welcome, APM North West Network Conference, Synergies Across Sectors
APM Welcome, APM North West Network Conference, Synergies Across Sectors
 
Software Engineering Methodologies (overview)
Software Engineering Methodologies (overview)Software Engineering Methodologies (overview)
Software Engineering Methodologies (overview)
 
Nutritional Needs Presentation - HLTH 104
Nutritional Needs Presentation - HLTH 104Nutritional Needs Presentation - HLTH 104
Nutritional Needs Presentation - HLTH 104
 
Advance Mobile Application Development class 07
Advance Mobile Application Development class 07Advance Mobile Application Development class 07
Advance Mobile Application Development class 07
 
Student login on Anyboli platform.helpin
Student login on Anyboli platform.helpinStudent login on Anyboli platform.helpin
Student login on Anyboli platform.helpin
 
SOCIAL AND HISTORICAL CONTEXT - LFTVD.pptx
SOCIAL AND HISTORICAL CONTEXT - LFTVD.pptxSOCIAL AND HISTORICAL CONTEXT - LFTVD.pptx
SOCIAL AND HISTORICAL CONTEXT - LFTVD.pptx
 
Call Girls in Dwarka Mor Delhi Contact Us 9654467111
Call Girls in Dwarka Mor Delhi Contact Us 9654467111Call Girls in Dwarka Mor Delhi Contact Us 9654467111
Call Girls in Dwarka Mor Delhi Contact Us 9654467111
 

TIME SERIES

  • 1. prepared by: • 2246135-Nischal Jaiswal • 2246138-Nitin Aggarwal • 2246148-Pritiprasun Sahoo • 2246174-Sai Smruti Sarangi • 2246276-Sasindu Hansaka • 2246277-Krishanth Raahul submitted to: MS.Tulasi M Maharatha
  • 2. Contents : 1. INTRODUCTION AND DEFINATION OF TIME SERIES . 2. COMPONENTS OF TIME SERIES . 3. USES OF SEASONAL INDICES . 4. ONE BASIC EXAMPLE OF SEASONAL INDICES .
  • 3. Introduction: We know that planning about future is very necessary for the every business firm, every govt. institute, every individual and for every country. Every family is also doing planning for his income expenditure. As like every business is doing planning for possibilities of its financial resources & sales and for maximization its profit. ,,Definations : "A time series is a set of observation taken at specified times, usually at equal intervals". "A time series may be defined as a collection of reading belonging to different time periods of some economic or composite variables". By-Ya-Lun-Chau • Time series establish relation between "cause" & "Effects" • One variable is "Time" which is independent variable & and the second is "Data" which is the dependent variable.
  • 4. Components of Time series: The change which are being in time series, They are effected by Economic, Social, Natural, Industrial & Political Reasons. These reasons are called components of Time Series. SECULAR TREND :- SEASONAL VARIATION :- CYCLICAL VARIATION :- IRREGULAR VARIATION :-
  • 5.  Secular trend:- The increase or decrease in the movements of a time series is called Secular trend. A time series data may show upward trend or downward trend for a period of years and this may be due to factors like:  increase in population,  change in technological progress,  large scale shift in consumers demands, For example, • population increases over a period of time,price increases over a period of years, production of goods on the capital market of the country increases over a period of years.These are the examples of upward trend. • The sales of a commodity may decrease over a period of time because of better products coming to the market. This is an example of declining trend or downward.
  • 6.  Seasonal variation: Seasonal variation are short-term fluctuation in a time series which occur periodically in a year. This continues to repeat year after year.  The major factors that are weather conditions and customs of people.  More woolen clothes are sold in winter than in the season of summer.  Each year more ice creams are sold in summer and very little in Winter season.  The sales in the departmental stores are more during festive seasons that in the normal days.
  • 7.  Cyclical Variations:  Cyclical variations are recurrent upward or downward movements in a time series but the period of cycle is greater than a year. Also these variations are not regular as seasonal variation.  A business cycle showing these oscillatory movements has to pass through four phases-prosperity, recession, depression and recovery. In a business, these four phases are completed by passing one to another in this order.
  • 8.  Irregular variation: Irregular variations are fluctuations in time series that are short in duration, erratic in nature and follow no regularity in the occurrence pattern. These variations are also referred to as residual variations since by definition they represent what is left out in a time series after trend,cyclical and seasonal variations. Irregular fluctuations results due to the occurrence of unforeseen events like:  FLOODS,  EARTHQUAKES,  WARS,  FAMINES
  • 9. Use of seasonal indices: We use seasonal indices for two purposes. • They can be used to smooth data by a process called deseasonalising • They can be used to help with predicting future scores with time series data. once an initial predicted value from a smoothed line is calculated, the seasonal index is used to correct that value up or down depending on which season we are predicting for. Methods of constructing seasonal indices: 1. Simple averages method 2. Ratio to trend method 3. Percentage moving average method 4. Link relatives method
  • 10. One basic example of seasonal indices: