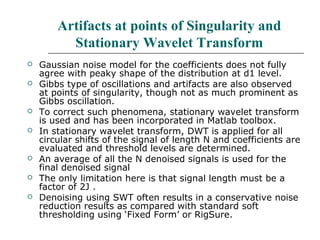
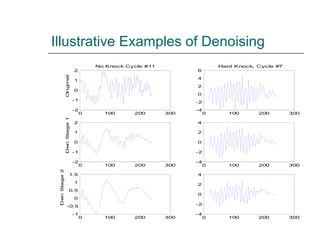
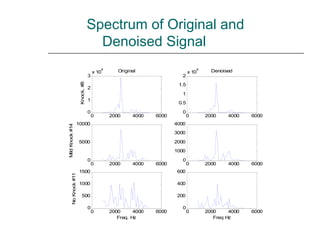
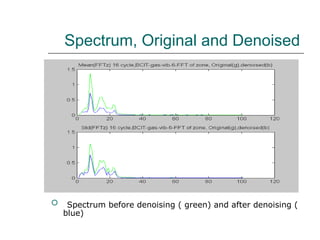
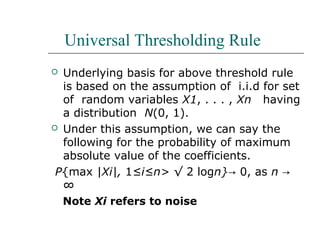
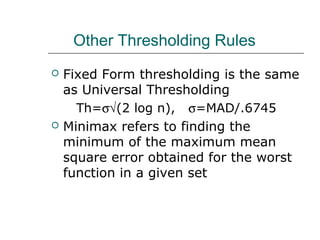
Denoising by wavelets involves manipulating wavelet coefficients to reduce noise, primarily through thresholding techniques like hard and soft thresholding. This process aims to reconstruct a true, noise-free signal while balancing the preservation of smoothness and minimizing risk functions for threshold selection. The document explores various models for noise reduction, emphasizing the importance of statistical estimation in achieving effective denoising outcomes.

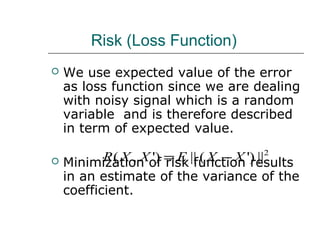
![Risk (Loss) Function
X is the actual (true) value of the signal to be
estimated ( or coefficients) and X’ is an
estimate of the signal X ( or coefficients ).
Since noise component is assumed to be zero
mean Gaussian, the difference is a measure
of an error based on the additive noise model
and given risk function.
It is a measure of the energy of the noise
i.e.∑[n(k)]2
Thus optimization procedure as defined above,
attempts to reduce the energy of the signal X by
an amount equal to the energy of the noise and
thus compensating for the noise in the sense of
L2 norms.](https://image.slidesharecdn.com/thresholdingeqnsforwavelet-170310062007/85/Thresholding-eqns-for-wavelet-37-320.jpg)
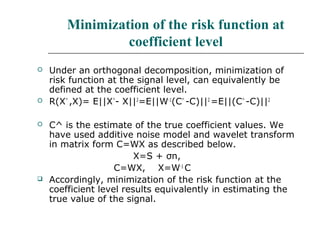
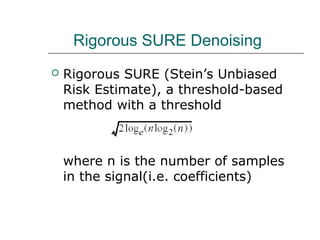
![Universal Thresholding Rule in WP
Universal threshold estimation rule
when applied to wavelet packet is to
be adjusted to the length of
decomposition which is nlog(n).
Threshold is then
Th=σ√[2 log(nlog(n)].](https://image.slidesharecdn.com/thresholdingeqnsforwavelet-170310062007/85/Thresholding-eqns-for-wavelet-43-320.jpg)
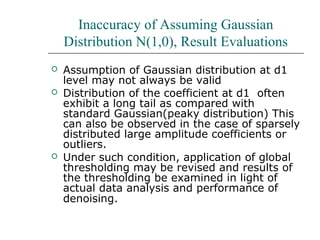
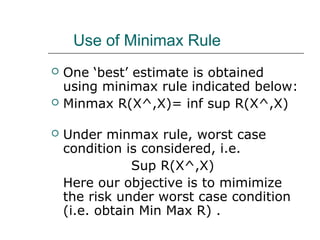
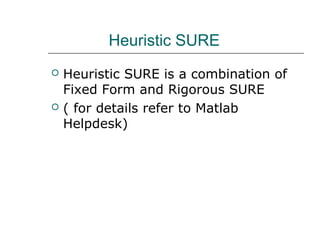
![Level Dependent Thresholding
In level dependent thresholding, thresholds
are rescaled at each level to arrive at a new
estimate corresponding to the standard
deviation of wavelet coefficients at that level.
We consider white noise model and Gaussian
distribution for the coefficient at each level.
This is referred to ‘mln’ [multilevel noise
model] in Matlab toolbox. Threshold level is
determined as follows.
Th(j,n) = σj√(2 log nj), σj =MADj /.6745](https://image.slidesharecdn.com/thresholdingeqnsforwavelet-170310062007/85/Thresholding-eqns-for-wavelet-44-320.jpg)
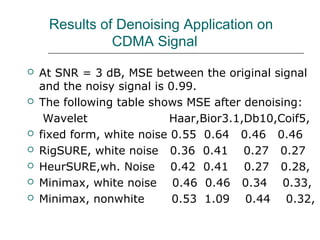
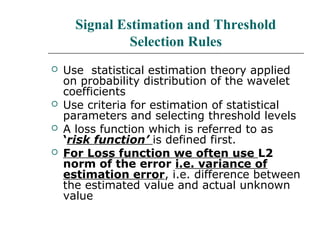
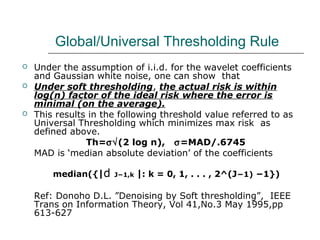
![Denoising in MATLAB
In Matlab, command ‘wden’ is used for denoising:
Sig=wden(s,tptr,sorh,scal,n,wav)
for determining σ for noise thresholding where:
s=signal,
sorh= soft or hard thresholding ‘s’ ,‘h’
scal=1 original model( white noise with unscaled noise),
scal=’sln’ first estimate of the noise variance based on 1st
level details. This uses basic model.
Scal=’mln’, is for nonwhite noise, i.e scale dependent
noise thresholding.
[For further details, please refer to Matlab wavemenu
toolbox]](https://image.slidesharecdn.com/thresholdingeqnsforwavelet-170310062007/85/Thresholding-eqns-for-wavelet-52-320.jpg)