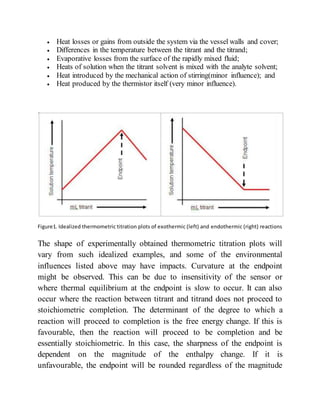
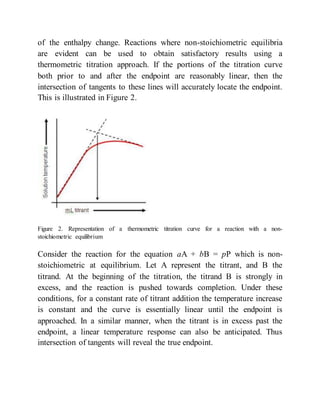
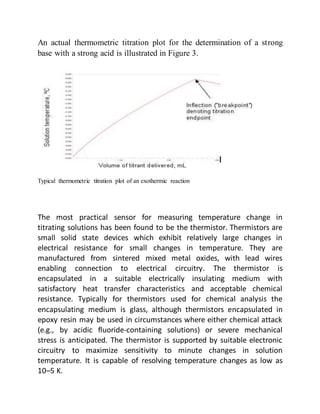
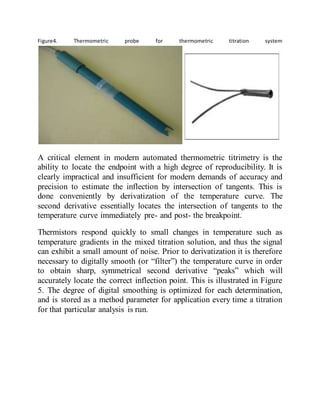
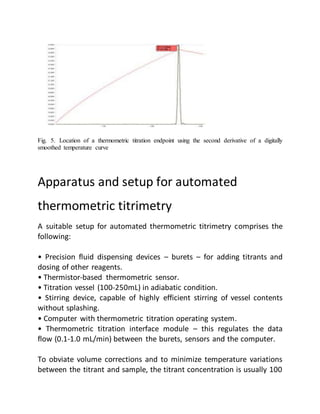

This document provides an overview of thermometric titration. Some key points: - Thermometric titration measures temperature changes that occur during chemical reactions to locate endpoints precisely. It has advantages over subjective visual methods. - The temperature change observed is directly proportional to the heat of reaction and moles of analyte. Second derivatives of temperature curves can precisely locate inflection points. - Parameters like mixing, probe placement, data density, and software filtering must be optimized for accurate results. - Applications include acid-base, redox, precipitation, and complexometric titrations. Common determinations include acids, bases, and metal ions.


![Reactions in solution [ solution kinetics]](https://cdn.slidesharecdn.com/ss_thumbnails/reactionsinsolution-210226024359-thumbnail.jpg?width=640&height=640&fit=bounds)


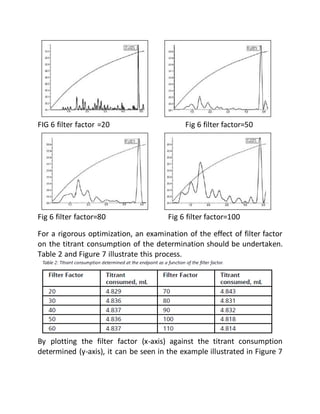
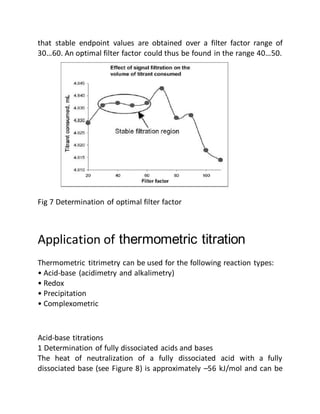
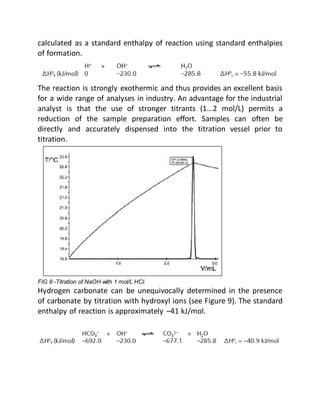
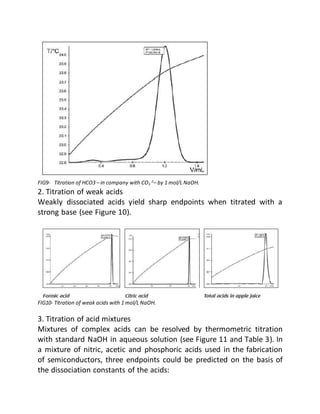
![Differential scanning calorimetry [dsc]](https://cdn.slidesharecdn.com/ss_thumbnails/differentialscanningcalorimetrydsc-151225053831-thumbnail.jpg?width=640&height=640&fit=bounds)


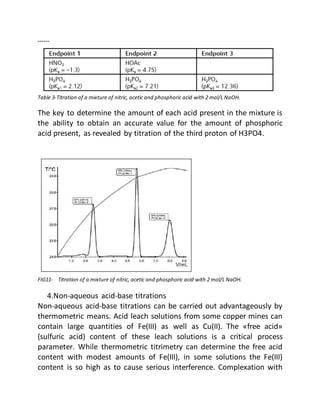
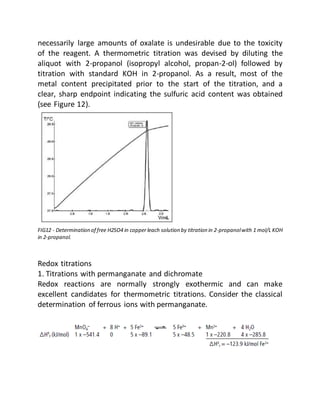
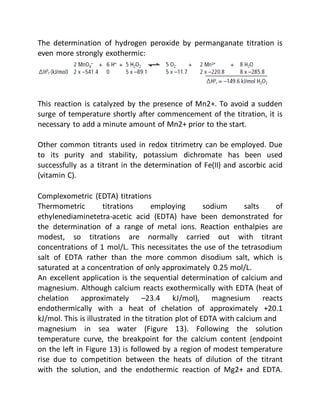
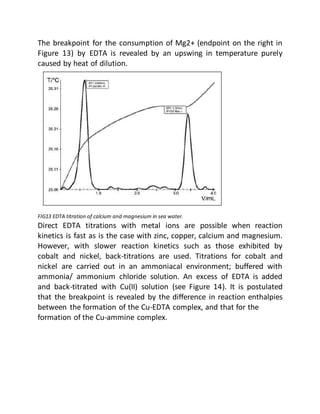
![Acid base titration III [Compatibility Mode].pdf](https://cdn.slidesharecdn.com/ss_thumbnails/acidbasetitrationiiicompatibilitymode-231030064045-e32b2458-thumbnail.jpg?width=640&height=640&fit=bounds)


