1. This document describes using cyclic voltammetry to study the ferrocyanide/ferricyanide redox couple. Key parameters such as peak potentials, currents, and diffusion coefficients are obtained from cyclic voltammograms.
2. Experiments are conducted using a glassy carbon working electrode in solutions of known ferrocyanide concentration. Multiple scans are run at varying scan rates to determine diffusion coefficients from the peak currents.
3. Analysis of peak potentials and currents allows determining the redox potential, verifying the number of electrons transferred, and quantifying the diffusion coefficients of both redox forms. Diffusion coefficients provide insight into the redox process and can be used to determine unknown concentrations.
lecture slide on:
Gibbs free energy and Nernst Equation, Faradaic Processes and Factors Affecting Rates of Electrode Reactions, Potentials and Thermodynamics of Cells, Kinetics of Electrode Reactions, Kinetic controlled reactions,Essentials of Electrode Reactions,BUTLER-VOLMER MODEL FOR THE ONE-STEP, ONE-ELECTRON PROCESS,Current-overpotential curves for the system, Mass Transfer by Migration And Diffusion,MASS-TRANSFER-CONTROLLED REACTIONS,
This Power point presentation was prepared to describe in detail about the two main voltammetry techniques of electrochemistry which is polarography and voltammetry. In these slides, I discussed the working, instrumentation, various electrodes, advantages, disadvantages..etc. Hope you understand the topic.
Knocking Door of Cyclic Voltammetry - cv of CV by Monalin MishraMONALINMISHRA
This ppt presentation shares some short basic knowledge on the electroanalytical technique of Cyclic Voltammetry. It also covers the working of CV with some short videos and photos.It also provides general explanation on some relevent techniques
Definition of chrono potentiometry
Introduction about chrono potentiomerty
Experimental setup of chronopotentiometry
Theory of chronopotentiometry
Output wave function of chrono potentiometry
Analysis of an chronopotentiometry
Main window of chronopotentiometry
used files in chronopotentiometry
disadvantages of chronopotentiometry
Application of chrono potentiometry
compare of chronopotentiometry
Using hardware
Feature of files in chronopotentiometry
In DSC the heat flow is measured and plotted against temperature of furnace or time to get a thermo gram. This is the basis of Differential Scanning Calorimetry (DSC).
The deviation observed above the base (zero) line is called exothermic transition and below is called endothermic transition.
The investigation of thermodynamic properties and reactivity yields interesting insights into the chemistry of newly synthesized substances. With thermal analysis extensive information can be gained from small samples (often only a few milligrams). In addition, the data obtained by thermal analysis can be used to plan and optimize a synthesis. Among the most important applications are identification and purity analysis, and the determination of characteristic temperatures and enthalpies of phase transitions (melting, vaporization), phase transformations, and reactions. Investigations into the kinetics of consecutive reactions and decomposition reactions are also possible. With the instruments available today such analyses can usually be performed quickly and easily. In this review the fundamentals of thermoanalytical methods are described and illustrated with selected examples of applications to low and high molecular weight compounds.
A.) Comparison of Voltammetry to Other Electrochemical Methods
1.) Voltammetry: electrochemical method in which information about an analyte is
obtained by measuring current (i) as a function of applied potential
- only a small amount of sample (analyte) is used
Instrumentation – Three electrodes in solution containing analyte
Working electrode: microelectrode whose potential is varied with time
Reference electrode: potential remains constant (Ag/AgCl electrode or calomel)
Counter electrode: Hg or Pt that completes circuit, conducts e- from signal source through solution to the working electrode
Supporting electrolyte: excess of nonreactive electrolyte (alkali metal) to conduct current
B.) Theory of Voltammetry
1.) Excitation Source: potential set by instrument (working electrode)
- establishes concentration of Reduced and Oxidized Species at electrode based on Nernst Equation:
- reaction at the surface of the electrode
Analyte selectivity is provided by the applied potential on the working electrode.
Electroactive species in the sample solution are drawn towards the working electrode where a half-cell redox reaction takes place.
Another corresponding half-cell redox reaction will also take place at the counter electrode to complete the electron flow.
The resultant current flowing through the electrochemical cell reflects the activity (i.e. concentration) of the electroactive species involved
2.) Current generated at electrode by this process is proportional to concentration at
surface, which in turn is equal to the bulk concentration
For a planar electrode:
measured current (i) = nFADA( )
where:
n = number of electrons in ½ cell reaction
F = Faraday’s constant
A = electrode area (cm2)
D = diffusion coefficient (cm2/s) of A (oxidant)
= slope of curve between CMox,bulk and CMox,s
Stellar Measurements with the New Intensity FormulaIOSR Journals
In this paper a linear relationship in stellar optical spectra has been found by using a
spectroscopical method used on optical light sources where it is possible to organize atomic and ionic data.
This method is based on a new intensity formula in optical emission spectroscopy (OES). Like the HR-diagram ,
it seems to be possible to organize the luminosity of stars from different spectral classes. From that organization
it is possible to determine the temperature , density and mass of stars by using the new intensity formula. These
temperature, density and mass values agree well with literature values. It is also possible to determine the mean
electron temperature of the optical layers (photospheres) of the stars as it is for atoms in the for laboratory
plasmas. The mean value of the ionization energies of the different elements of the stars has shown to be very
significant for each star. This paper also shows that the hydrogen Balmer absorption lines in the stars follow
the new intensity formula.
I am Joshua M. I am a Statistical Physics Assignment Expert at statisticsassignmenthelp.com. I hold a Masters in Statistics from, Michigan State University, UK
I have been helping students with their homework for the past 5 years. I solve assignments related to Statistics.
Visit statisticsassignmenthelp.com or email info@statisticsassignmenthelp.com.
You can also call on +1 678 648 4277 for any assistance with Statistical Physics Assignments .
International Journal of Computational Engineering Research(IJCER)ijceronline
International Journal of Computational Engineering Research(IJCER) is an intentional online Journal in English monthly publishing journal. This Journal publish original research work that contributes significantly to further the scientific knowledge in engineering and Technology.
A model of electron pairing, with depletion of mediating phonons at fermi sur...Qiang LI
We present a model of electron pairing based on nonstationary interpretation of electron-lattice interaction. Electron-lattice system has an intrinsic time dependent characteristic as featured by Golden Rule, by which electrons on matched pairing states are tuned to lattice wave modes, with pairing competition happening among multiple pairings associated with one electron state. The threshold phonon of an electron pair having a good quality factor can become redundant and be released from the pair to produce a binding energy. Lattice modes falling in a common linewidth compete with one another, like modes competing in a lasing system. In cuprates, due to near-parallel band splitting at and near Fermi Surface (EF), a great number of electron pairs are tuned to a relatively small number of lattice wave modes, leading to strong mode competition, transfer of real pairing-mediating phonons from EF towards the “kink”, and depletion of these phonons at and near EF.
Similar to 3rd Year Undergraduate Cyclic Voltammetry Practical (20)
A model of electron pairing, with depletion of mediating phonons at fermi sur...
3rd Year Undergraduate Cyclic Voltammetry Practical
1. 3.6 Cyclic voltammetric study of the ferrocyanide / ferricyanide redox
couple.
All electrochemical reactions are governed at least in part by the Nernst equation (Eqn. 3.23).
This fundamental expression simply specifies the relationship between the potential of an
electrode (E) and the concentrations (C) of the two species (designated O and R) involved in
the redox reaction at that electrode:
O + n e-
→ R (3.22)
E = E° +
RT
nF
ln �
CO
CR
� (3.23)
Where R is the molar gas constant (8.3144 J mol–1
K–1
), T is the absolute temperature (K), n
is the number of moles of electrons transferred in the balanced equation, F is Faraday’s
constant (96,485 C mol-1
), and E° is the standard reduction potential for the reaction.
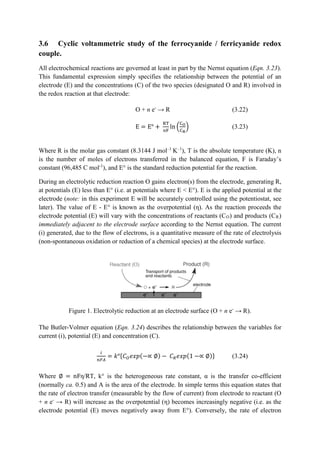
During an electrolytic reduction reaction O gains electron(s) from the electrode, generating R,
at potentials (E) less than E° (i.e. at potentials where E < E°). E is the applied potential at the
electrode (note: in this experiment E will be accurately controlled using the potentiostat, see
later). The value of E - E° is known as the overpotential (η). As the reaction proceeds the
electrode potential (E) will vary with the concentrations of reactants (CO) and products (CR)
immediately adjacent to the electrode surface according to the Nernst equation. The current
(i) generated, due to the flow of electrons, is a quantitative measure of the rate of electrolysis
(non-spontaneous oxidation or reduction of a chemical species) at the electrode surface.
Figure 1. Electrolytic reduction at an electrode surface (O + n e-
→ R).
The Butler-Volmer equation (Eqn. 3.24) describes the relationship between the variables for
current (i), potential (E) and concentration (C).
𝑖𝑖
𝑛𝑛𝑛𝑛𝑛𝑛
= 𝑘𝑘°{𝐶𝐶𝑂𝑂 𝑒𝑒𝑒𝑒𝑒𝑒(−∝ ∅) − 𝐶𝐶𝑅𝑅 𝑒𝑒𝑒𝑒𝑒𝑒(1 −∝ ∅)} (3.24)
Where ∅ = nFη/RT, k° is the heterogeneous rate constant, α is the transfer co-efficient
(normally ca. 0.5) and A is the area of the electrode. In simple terms this equation states that
the rate of electron transfer (measurable by the flow of current) from electrode to reactant (O
+ n e-
→ R) will increase as the overpotential (η) becomes increasingly negative (i.e. as the
electrode potential (E) moves negatively away from E°). Conversely, the rate of electron
2. transfer from the reactant to the electrode (R → O + n e-
) will increase as the overpotential
(η) becomes increasingly positive. Normally current is measured from the point of view of
the electrode. ‘Negative’ current is generated if the electrode supplies electrons to a reactant,
as in the case of a reduction reaction (O + n e-
→ R), whilst ‘positive’ current is generated if
the electrode gains electrons from a reactant, as in the case of an oxidation reaction (R → O +
n e-
).
At some point the current (i) resulting from the redox process (known as the faradaic current)
will become limited by the rate at which the reactant can diffuse to the electrode and/or the
rate that the product diffuses away from the electrode. In this case, the material flux (j) at the
electrode–solution interface dictates the maximum current generated, described by Fick’s law
of diffusion:
𝑗𝑗 = 𝑛𝑛𝑛𝑛𝑛𝑛
𝐶𝐶−𝐶𝐶′
𝛿𝛿
(3.25)
where j is the flux, D is the diffusion co-efficient, C is the concentration in the bulk solution,
Cʹ is the concentration immediately adjacent to the electrode and δ is the Nernst diffusion
layer thickness. In simple terms Fick’s law of diffusion states that the reactant (and product)
will diffuse from regions of high concentration to regions of low concentration at a certain
rate (D). This process gives rise to the formation of a diffusion layer (δ) at the electrode
surface. The thickness of the diffusion layer will increase with time (t) as the electrolysis
reaction proceeds as depicted in Figure 2.
Figure 2. Formation of the Nernst diffusion layer.
The rate (D) at which an electroactive species diffuses toward or away from the electrode
surface is specific for each individual chemical species. In this experiment, the diffusion co-
efficient (D) of electroactive species, [FeCN6]3-/4-
will be determined using an
electrochemical technique known as ‘Cyclic Voltammetry’ (CV). A ‘potentiostat’ is used to
perform the CV experiment. The potentiostat permits the user to accurately control the
potential difference (ΔE) between two electrodes (working electrode and reference
electrode), whilst a third electrode, known as the counter electrode, is used to complete the
circuit (Fig. 3a).
In a CV experiment the voltage applied to the working electrode is scanned linearly from an
initial value, E1, to a predetermined limit, E2 (known as the switching potential), where the
3. direction of the scan is reversed (Fig. 3b). The current response is plotted as a function of the
applied potential producing a cyclic voltammogram (Fig. 3c).
Figure 3. (a) Experimental setup, (b) the potential waveform applied to an electrode during a
typical cyclic voltammetric experiment and (c) a typical cyclic voltammogram.
4. Figure 4. A typical cyclic voltammogram for a reversible redox couple showing parameters
Epa, Epc, Ipa and Ipc. Solid arrows indicate direction of scan.
The parameters of greatest interest for a reversible cyclic voltammogram are the anodic peak
potential (Epa), the cathodic peak potential (Epc), the anodic peak current (ipa), and the
cathodic peak current (ipc) as displayed in Fig. 4.
The redox potential (E°ʹ) of the reversible redox couple can be evaluated according to:
E°ʹ =
Epa + Epc
2
(3.26)
The peak separation (∆Ep) for a reversible, ‘Nernstian’, redox couple provides information
about the number of electrons (n) transferred per mole.
∆𝐸𝐸𝑝𝑝 = (𝐸𝐸𝑝𝑝𝑝𝑝 − 𝐸𝐸𝑝𝑝𝑝𝑝) =
0.0592
𝑛𝑛
(3.27)
Quantitative information regarding the concentration of the species undergoing electrolysis is
obtained from the peak height (ip) according to the Randles-Sevcik equation:
ip = (2.69 × 10⁵) n3/2
A D1/2
C∗
v1/2
(3.28)
where ip (amperes) is the peak current associated with the anodic (ipa) or cathodic (ipc) scan,
n is the number of electrons transferred, A (cm2
) is the geometric area of the electrode, C∗
(mol cm−3
) is the bulk concentration of species, D (cm2
s−1
) is the diffusion coefficient of
species and v (V s−1
) is the experimental scan rate (dE/dt).
The most straightforward method for determining the diffusion coefficient (D) is to measure
the peak current (ip) at several scan rates (v) and then plot ip as a function of v1/2
. The slope
of the best-fit line can then be used to calculate D:
𝐷𝐷 =
(𝑠𝑠𝑠𝑠𝑠𝑠 𝑠𝑠𝑠𝑠)2
𝑛𝑛3 (2.69 ×10⁵ 𝐴𝐴 𝐶𝐶∗)2
(3.29)
In this experiment you will use CV to determine the redox potential (E°ʹ) and diffusion co-
efficients for the ferrocyanide / ferricyanide reversible redox couple:
[Fe(CN)6]3-
+ e-
⇌ [Fe(CN)6]4-
(3.30)
As the peak current (ip) is proportional to concentration (C*) of the electro-active species
undergoing electrolysis, the unknown concentration of a ferricyanide solution will also be
determined.
5. Experimental:
1. Prepare a 5 mM standard solution of K3Fe(CN)6 (Mr 329.24 g mol-1
) in 0.1 M KNO3
solution using the 100 mL volumetric flask provided.
2. Polish the working electrode (3mm diameter glassy carbon) using the alumina slurry
polishing pad, rinse well with DI water and dry.
3. Fill the electrochemical cell with about 8 to 10 mL of the 5 mM solution.
4. Place the working electrode, reference electrode (Ag/AgCl in 1 M KCl) and counter
electrode into the electrochemical cell. Ensure that the electrodes are suspended in
solution i.e. that they are not touching the bottom of the cell (see Fig. 4).
Figure 5. Experimental parameters and software functions.
5. Connect the potentiostat cables to the electrodes (red: working electrode, blue:
reference electrode and black: counter electrode).
6. 6. Double click on PSTrace 4.6 to open the user interface software. From within the
program open the ‘CV_setup’ file located on desktop. Ensure that the parameters
match those displayed in Figure 5.
7. Ensure that the software is connected to the potentiostat (EmStat3+). Click on the
‘Play’ button to initiate a scan at 0.1 V s-1
. The resulting voltammogram should be
similar in shape to that depicted in Fig. 4.
8. Create a personal folder on desktop. Save scan in folder and export to Excel. Save
Excel file separately.
9. Repeat step 8 at the following scan rates: 0.2 V s-1
, 0.3 V s-1
, 0.4 V s-1
, 0.5 V s-1
.
Results analysis:
Using Excel:
1. Plot the scan at 0.1 Vs-1
and evaluate Epa and Epc from graph.
2. Plot i) ipa vs. v1/2
, and ii) ipc vs. v1/2
for each of the scan rates (0.1 V s-1
to 0.5 V s-1
)
and evaluate the slope of the best-fit line (note: plot ipc currents as positive values).
Questions:
1. Calculate the redox potential (E°ʹ) for the ferrocyanide / ferricyanide redox couple.
Compare the value of ΔEp that you measured to that predicted by the Nernst equation.
Is this what you expected? Account for any deviations observed.
2. Calculate the diffusion co-efficients (D) for ferrocyanide (using ipa vs. v1/2
) and
ferricyanide (using ipc vs. v1/2
). Be careful with units! Remember molar
concentrations are expressed as mol dm-3. Are the diffusion co-efficient values
similar? If so, what does this signify?
![transfer from the reactant to the electrode (R → O + n e-
) will increase as the overpotential
(η) becomes increasingly positive. Normally current is measured from the point of view of
the electrode. ‘Negative’ current is generated if the electrode supplies electrons to a reactant,
as in the case of a reduction reaction (O + n e-
→ R), whilst ‘positive’ current is generated if
the electrode gains electrons from a reactant, as in the case of an oxidation reaction (R → O +
n e-
).
At some point the current (i) resulting from the redox process (known as the faradaic current)
will become limited by the rate at which the reactant can diffuse to the electrode and/or the
rate that the product diffuses away from the electrode. In this case, the material flux (j) at the
electrode–solution interface dictates the maximum current generated, described by Fick’s law
of diffusion:
𝑗𝑗 = 𝑛𝑛𝑛𝑛𝑛𝑛
𝐶𝐶−𝐶𝐶′
𝛿𝛿
(3.25)
where j is the flux, D is the diffusion co-efficient, C is the concentration in the bulk solution,
Cʹ is the concentration immediately adjacent to the electrode and δ is the Nernst diffusion
layer thickness. In simple terms Fick’s law of diffusion states that the reactant (and product)
will diffuse from regions of high concentration to regions of low concentration at a certain
rate (D). This process gives rise to the formation of a diffusion layer (δ) at the electrode
surface. The thickness of the diffusion layer will increase with time (t) as the electrolysis
reaction proceeds as depicted in Figure 2.
Figure 2. Formation of the Nernst diffusion layer.
The rate (D) at which an electroactive species diffuses toward or away from the electrode
surface is specific for each individual chemical species. In this experiment, the diffusion co-
efficient (D) of electroactive species, [FeCN6]3-/4-
will be determined using an
electrochemical technique known as ‘Cyclic Voltammetry’ (CV). A ‘potentiostat’ is used to
perform the CV experiment. The potentiostat permits the user to accurately control the
potential difference (ΔE) between two electrodes (working electrode and reference
electrode), whilst a third electrode, known as the counter electrode, is used to complete the
circuit (Fig. 3a).
In a CV experiment the voltage applied to the working electrode is scanned linearly from an
initial value, E1, to a predetermined limit, E2 (known as the switching potential), where the](data:image/gif;base64,R0lGODlhAQABAIAAAAAAAP///yH5BAEAAAAALAAAAAABAAEAAAIBRAA7)