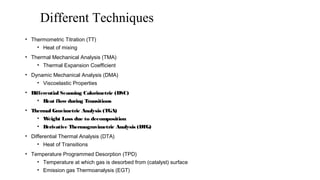
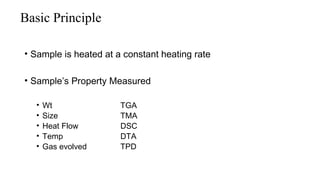
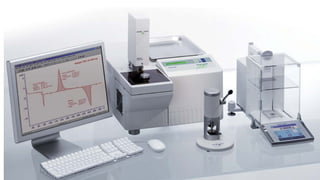
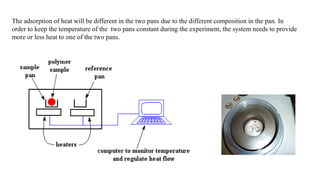
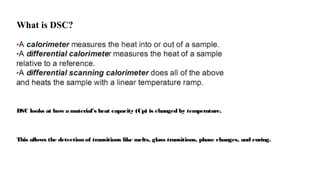
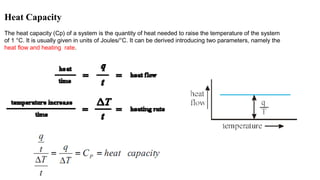
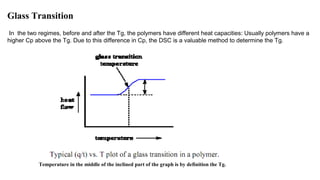
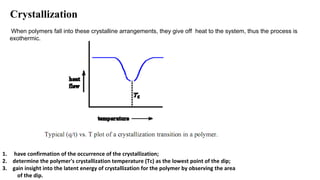
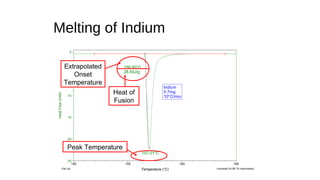
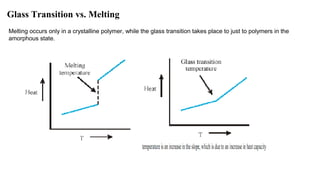
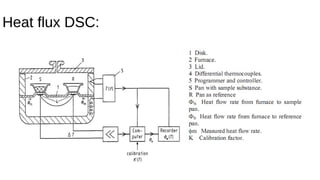
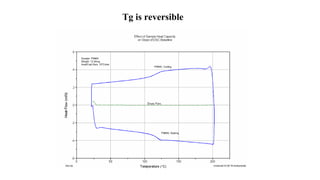
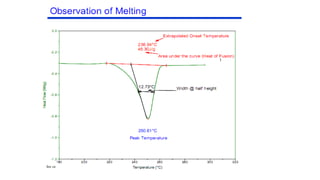
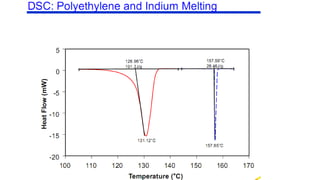
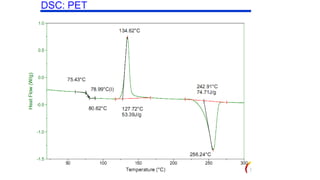
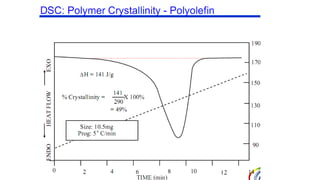
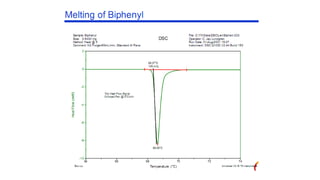
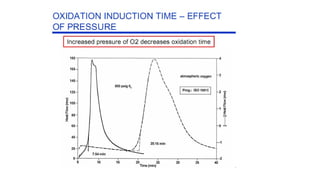
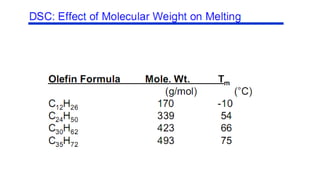
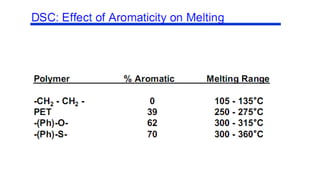
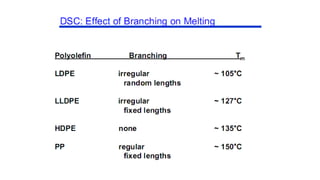
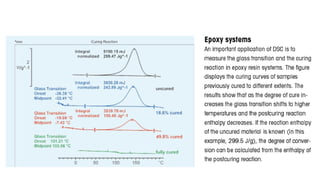
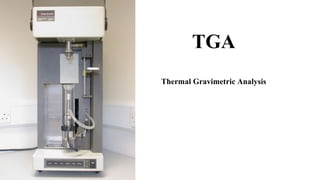
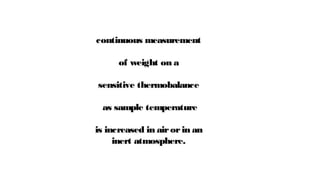
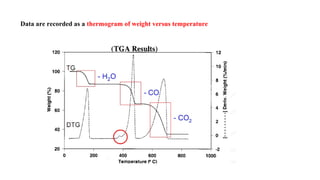
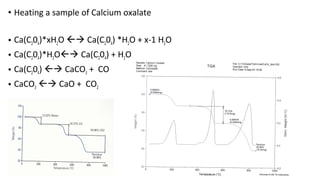
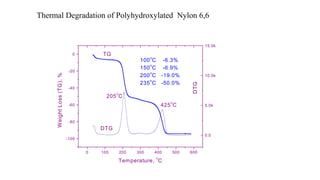
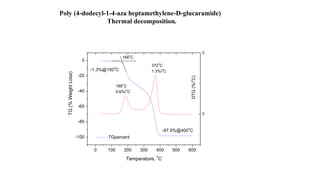
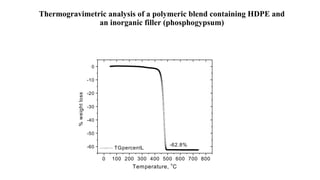
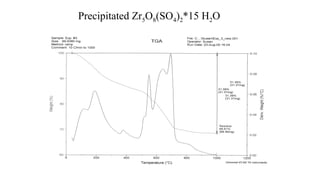
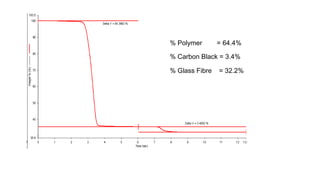
DSC & TGA
Differential Scanning Calorimetry and Thermal Gravimetric Analysis
Pashaie.mokhtar7@gmail.com
Different Techniques
• Thermometric Titration (TT)
• Heat of mixing
• Thermal Mechanical Analysis (TMA)
• Thermal Expansion Coefficient
• Dynamic Mechanical Analysis (DMA)
• Viscoelastic Properties
• Differential Scanning Calorimetric (DSC)
• Heat flow during Transitions
• Thermal Gravimetric Analysis (TGA)
• Weight Loss due to decomposition
• Derivative Thermogravimetric Analysis (DTG)
• Differential Thermal Analysis (DTA)
• Heat of Transitions
• Temperature Programmed Desorption (TPD)
• Temperature at which gas is desorbed from (catalyst) surface
• Emission gas Thermoanalysis (EGT)
Basic Principle
• Sample is heated at a constant heating rate
• Sample’s Property Measured
• Wt TGA
• Size TMA
• Heat Flow DSC
• Temp DTA
• Gas evolved TPD
The adsorption of heat will be different in the two pans due to the different composition in the pan. In
order to keep the temperature of the two pans constant during the experiment, the system needs to provide
more or less heat to one of the two pans.
What is DSC?
DSC looks at how a material’s heat capacity (Cp) is changed by temperature.
This allows the detection of transitions like melts, glass transitions, phase changes, and curing.
Thermal properties of a polymer
Heat Capacity
The heat capacity (Cp) of a system is the quantity of heat needed to raise the temperature of the system
of 1 °C. It is usually given in units of Joules/°C. It can be derived introducing two parameters, namely the
heat flow and heating rate.
Glass Transition
In the two regimes, before and after the Tg, the polymers have different heat capacities: Usually polymers have a
higher Cp above the Tg. Due to this difference in Cp, the DSC is a valuable method to determine the Tg.
Temperature in the middle of the inclined part of the graph is by definition the Tg.
T
V
Tm
Totally crystalline
T
V
Tg
Totally glassy
T
V
TmTg
Semi-crystalline
Crystallization
When polymers fall into these crystalline arrangements, they give off heat to the system, thus the process is
exothermic.
1. have confirmation of the occurrence of the crystallization;
2. determine the polymer's crystallization temperature (Tc) as the lowest point of the dip;
3. gain insight into the latent energy of crystallization for the polymer by observing the area
of the dip.
Melting
melting is an endothermic transition. The melting is a first order transition since when the melting temperature is
reached; the polymer's temperature does not rise until all the crystals have completely melted.
the latent heat of melting can be measured from the area of the peak
Melting of Indium
157.01°C
156.60°C
28.50J/g
Indium
5.7mg
10°C/min
-25
-20
-15
-10
-5
0
HeatFlow(mW)
150 155 160 165
Temperature (°C)Exo Up Universal V4.0B TA Instruments
Peak Temperature
Extrapolated
Onset
Temperature
Heat of
Fusion
Glass Transition vs. Melting
Melting occurs only in a crystalline polymer, while the glass transition takes place to just to polymers in the
amorphous state.
DSC Instruments
Two types of DSC instrument have been widely used:
The heat flux DSC (e.g., TA DSC and Mettler DSC)
The power compensational DSC (Perkin-Elmer system)
Heat flux DSC:
Power compensated DSC
Modulated DSC
the same heat flux DSC cell is used, but a sinusoidal temperature oscillation (modulation) is overlaid on the conventional linear
temperature ramp, resulting heating rate is sometimes faster than the underlying linear heating rate, and sometimes slower than
the underlying rate
Experiment : Thermal behavior of PET
Determine on the PET sample
a. The glass transition, melting and crystallization temperature;
b. The heat of crystrallization and melting.
Preparing sample:
• Cut a piece of PET film from the plastic bottle, clean it with water and dry it.
• Make a thin film with the weight 5-15 mg, (this is the normal sample weight in DSC
experiment).
• Keep the film flat enough and with suitable size for Aluminum pan.
Glass transition sensitivity
Tg is reversible
TGA
Thermal Gravimetric Analysis
continuous measurement
of weight on a
sensitive thermobalance
as sample temperature
is increased in airorin an
inert atmosphere.
Photodiodes
Infrared LED
Meter movement
Balance arm
Tare pan
Sample platform
Thermocouple
Sample pan
Furnace assembly
Purge gas outlet
Heater
Elevator base
Purge gas inlet
Sample pan holder
Quartz Liner
Off-Gases
Balance Purge
Sample
Thermocouple
Sample
Pan
Furnace Core
Purge Gas In
Data are recorded as a thermogram of weight versus temperature
evaporation of residual moisture or solvent
polymer decomposition
Thermal stability studies
 characterize polymers through loss of a known entity
such as HCl from poly(vinylchloride) Thus weight loss can be correlated with
percent vinylchloride in a copolymer.
 determining volatilities of plasticizers and other additives
Some applications
• Heating a sample of Calcium oxalate
• Ca(C204)*xH2O  Ca(C204) *H2O + x-1 H2O
• Ca(C204)*H2O Ca(C204) + H2O
• Ca(C204)  CaCO3 + CO
• CaCO3  CaO + CO2
Thermal Degradation of Polyhydroxylated Nylon 6,6
0 100 200 300 400 500 600
-100
-80
-60
-40
-20
0
100
o
C -6.3%
150
o
C -6.9%
200
o
C -19.0%
235
o
C -50.0%
205
o
C
425
o
C
DTG
TG
DTG
WeightLoss(TG),%
Temperature,
o
C
0.0
5.0k
10.0k
15.0k
Poly (4-dodecyl-1-4-aza heptamethylene-D-glucaramide)
Thermal decomposition.
0 100 200 300 400 500 600
-100
-80
-60
-40
-20
0
TG(%WeightLoss)
Temperature,
o
C
TGpercent
0
2
-97.5%@400
o
C
-1.3%@150
o
C
188
o
C
0.6%/
o
C
372
o
C
1.3%/
o
C
166
o
C
DTG(%/
o
C)
Thermogravimetric analysis of a polymeric blend containing HDPE and
an inorganic filler (phosphogypsum)
0 100 200 300 400 500 600 700 800
-60
-50
-40
-30
-20
-10
0
-62.8%
%weightloss
Temperature,
o
C
TGpercentL
Precipitated Zr5O8(SO4)2*15 H2O
Analysis of Filtrate from Precipitation
• Precipitation
• 5ZrOCl2 + 2H2SO4+ xH2O  Zr5O8(SO4)2*15 H2O (s) + 10
HCl
• Decomposition
• Zr5O8(SO4)2*15 H2O (s)  Zr5O8(SO4)2*14 H2O (s) + H2O (v)
• Zr5O8(SO4)2  5 ZrO2(s) +2 SO2(v)
% Polymer = 64.4%
% Carbon Black = 3.4%
% Glass Fibre = 32.2%

DSC & TGA

  • 1.
    DSC & TGA DifferentialScanning Calorimetry and Thermal Gravimetric Analysis Pashaie.mokhtar7@gmail.com
  • 2.
    Different Techniques • ThermometricTitration (TT) • Heat of mixing • Thermal Mechanical Analysis (TMA) • Thermal Expansion Coefficient • Dynamic Mechanical Analysis (DMA) • Viscoelastic Properties • Differential Scanning Calorimetric (DSC) • Heat flow during Transitions • Thermal Gravimetric Analysis (TGA) • Weight Loss due to decomposition • Derivative Thermogravimetric Analysis (DTG) • Differential Thermal Analysis (DTA) • Heat of Transitions • Temperature Programmed Desorption (TPD) • Temperature at which gas is desorbed from (catalyst) surface • Emission gas Thermoanalysis (EGT)
  • 3.
    Basic Principle • Sampleis heated at a constant heating rate • Sample’s Property Measured • Wt TGA • Size TMA • Heat Flow DSC • Temp DTA • Gas evolved TPD
  • 5.
    The adsorption ofheat will be different in the two pans due to the different composition in the pan. In order to keep the temperature of the two pans constant during the experiment, the system needs to provide more or less heat to one of the two pans.
  • 6.
    What is DSC? DSClooks at how a material’s heat capacity (Cp) is changed by temperature. This allows the detection of transitions like melts, glass transitions, phase changes, and curing.
  • 7.
  • 8.
    Heat Capacity The heatcapacity (Cp) of a system is the quantity of heat needed to raise the temperature of the system of 1 °C. It is usually given in units of Joules/°C. It can be derived introducing two parameters, namely the heat flow and heating rate.
  • 9.
    Glass Transition In thetwo regimes, before and after the Tg, the polymers have different heat capacities: Usually polymers have a higher Cp above the Tg. Due to this difference in Cp, the DSC is a valuable method to determine the Tg. Temperature in the middle of the inclined part of the graph is by definition the Tg.
  • 10.
  • 11.
    Crystallization When polymers fallinto these crystalline arrangements, they give off heat to the system, thus the process is exothermic. 1. have confirmation of the occurrence of the crystallization; 2. determine the polymer's crystallization temperature (Tc) as the lowest point of the dip; 3. gain insight into the latent energy of crystallization for the polymer by observing the area of the dip.
  • 12.
    Melting melting is anendothermic transition. The melting is a first order transition since when the melting temperature is reached; the polymer's temperature does not rise until all the crystals have completely melted. the latent heat of melting can be measured from the area of the peak
  • 16.
    Melting of Indium 157.01°C 156.60°C 28.50J/g Indium 5.7mg 10°C/min -25 -20 -15 -10 -5 0 HeatFlow(mW) 150155 160 165 Temperature (°C)Exo Up Universal V4.0B TA Instruments Peak Temperature Extrapolated Onset Temperature Heat of Fusion
  • 17.
    Glass Transition vs.Melting Melting occurs only in a crystalline polymer, while the glass transition takes place to just to polymers in the amorphous state.
  • 18.
    DSC Instruments Two typesof DSC instrument have been widely used: The heat flux DSC (e.g., TA DSC and Mettler DSC) The power compensational DSC (Perkin-Elmer system)
  • 19.
  • 20.
  • 21.
    Modulated DSC the sameheat flux DSC cell is used, but a sinusoidal temperature oscillation (modulation) is overlaid on the conventional linear temperature ramp, resulting heating rate is sometimes faster than the underlying linear heating rate, and sometimes slower than the underlying rate
  • 22.
    Experiment : Thermalbehavior of PET Determine on the PET sample a. The glass transition, melting and crystallization temperature; b. The heat of crystrallization and melting. Preparing sample: • Cut a piece of PET film from the plastic bottle, clean it with water and dry it. • Make a thin film with the weight 5-15 mg, (this is the normal sample weight in DSC experiment). • Keep the film flat enough and with suitable size for Aluminum pan.
  • 23.
  • 24.
  • 44.
  • 45.
    continuous measurement of weighton a sensitive thermobalance as sample temperature is increased in airorin an inert atmosphere.
  • 46.
    Photodiodes Infrared LED Meter movement Balancearm Tare pan Sample platform Thermocouple Sample pan Furnace assembly Purge gas outlet Heater Elevator base Purge gas inlet Sample pan holder
  • 47.
  • 48.
    Data are recordedas a thermogram of weight versus temperature
  • 49.
    evaporation of residualmoisture or solvent polymer decomposition Thermal stability studies  characterize polymers through loss of a known entity such as HCl from poly(vinylchloride) Thus weight loss can be correlated with percent vinylchloride in a copolymer.  determining volatilities of plasticizers and other additives Some applications
  • 52.
    • Heating asample of Calcium oxalate • Ca(C204)*xH2O  Ca(C204) *H2O + x-1 H2O • Ca(C204)*H2O Ca(C204) + H2O • Ca(C204)  CaCO3 + CO • CaCO3  CaO + CO2
  • 53.
    Thermal Degradation ofPolyhydroxylated Nylon 6,6 0 100 200 300 400 500 600 -100 -80 -60 -40 -20 0 100 o C -6.3% 150 o C -6.9% 200 o C -19.0% 235 o C -50.0% 205 o C 425 o C DTG TG DTG WeightLoss(TG),% Temperature, o C 0.0 5.0k 10.0k 15.0k
  • 54.
    Poly (4-dodecyl-1-4-aza heptamethylene-D-glucaramide) Thermaldecomposition. 0 100 200 300 400 500 600 -100 -80 -60 -40 -20 0 TG(%WeightLoss) Temperature, o C TGpercent 0 2 -97.5%@400 o C -1.3%@150 o C 188 o C 0.6%/ o C 372 o C 1.3%/ o C 166 o C DTG(%/ o C)
  • 55.
    Thermogravimetric analysis ofa polymeric blend containing HDPE and an inorganic filler (phosphogypsum) 0 100 200 300 400 500 600 700 800 -60 -50 -40 -30 -20 -10 0 -62.8% %weightloss Temperature, o C TGpercentL
  • 56.
  • 57.
    Analysis of Filtratefrom Precipitation • Precipitation • 5ZrOCl2 + 2H2SO4+ xH2O  Zr5O8(SO4)2*15 H2O (s) + 10 HCl • Decomposition • Zr5O8(SO4)2*15 H2O (s)  Zr5O8(SO4)2*14 H2O (s) + H2O (v) • Zr5O8(SO4)2  5 ZrO2(s) +2 SO2(v)
  • 58.
    % Polymer =64.4% % Carbon Black = 3.4% % Glass Fibre = 32.2%

Editor's Notes

  • #7 The output of the DSC experiment is the additional quantity of heat which is given to the pan in order to keep the temperature of the two pans equal. In other words, the output of the DSC is a plot of the difference in heat output of the two heaters vs. temperature (T).
  • #12 Decreasing the temperature on a polymer which is in its molten state, the polymer reaches the glass transition temperature (Tg). At this point the mechanical properties of the polymer change from those of a rubber (elastic) to those of a glass (brittle). Below the glass transition temperature, the available polymer motions are limited, but above the glass transition more motions are accessible. It is important to note that the transition does not occur suddenly, but usually takes place over a temperature range. To overcome this problem the temperature in the middle of the inclined part of the graph is by definition the Tg.
  • #14 Above the glass transition, the polymer chains posses a notable mobility. They wiggle and squirm, and never remain in one position for very long. When they reach the right temperature, they will have gained enough energy to move into very ordered arrangements, which we call crystals.
  • #15 At the melting temperature (Tm) the chains are allowed to move around freely, thus they do not possess an ordered arrangements. Upon melting the polymers absorb heat, thus
  • #16 not all the polymers exhibit all these three transitions. The crystallization dip and the melting peak will only show up for polymers that can form crystals. Completely amorphous polymers will not show any crystallization, or any melting either. For the glass transition, there is no dip, and there's no peak, either. This is because there is no latent heat given off, or absorbed, by the polymer during the glass transition. In the glass transition it is just possible to observe a change in the heat capacity of the polymer but there is no latent heat involved: consequently it can be defined as a second order transition. Differently, both melting and crystallization involve giving off or absorbing heat. Since they do have latent heats, they can be defined as first order transitions.
  • #20 After melting the temperature begins to rise again, but at a slower rate. This is due to the higher heat capacity of the molten polymer than the solid crystalline polymer. The case of the glass transition is different. When an amorphous polymer is heated, first the temperature rises at a rate determined by the polymer's heat capacity, just as for a crystalline polymer. When the Tg is reached the temperature does not stop rising. There is no latent heat of glass transition. But the temperature rising rate above the Tg changes, namely the polymer undergoes an increase in its heat capacity.
  • #22 where the sample and reference are heated from the same source and the temperature difference ΔT is measured. This signal is converted to a power difference ΔP(ΔP = ΔQ/dt ) using the calorimetric sensitivity.
  • #23 where the sample and reference are heated by separate, individual heaters, and the temperature difference is kept close to zero, while the difference in the electrical power needed to maintain equal temperatures (ΔP = ΔQ/dt) is measured. To be more precise, the temperature of the furnace is raised or lowered in a linear fashion, and the resultant differential heat flow to the sample and reference is monitored by area thermocouples fixed to the underside of the disk platforms. These thermocouples are connected in series and measure the differential heat flow using the thermal equivalent of Ohm’s Law: D R T dt dq Δ = , where dq/dt= heat flow, _T=temperature difference between reference and sample and RD=thermal resistance of the disk.
  • #26 RAMP
  • #57 290 Delta h baraie 100% cristality
  • #82 دما از 25 تا 1500 سرعت گرمایش 0 تا 200 گازپاش و ذر مواردی اکسیژن n2و h2
  • #83 تجزیه و اکسایش و فرایندهای فیزیکی مانند تبخیر تصعید و واجذبی
  • #85 زغال قیردار سمت چپ ذرصد دوده در پلی اتیلن پایداری یک جز در یک دما