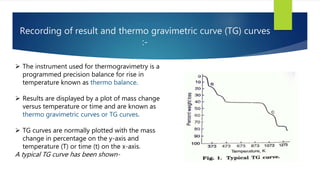
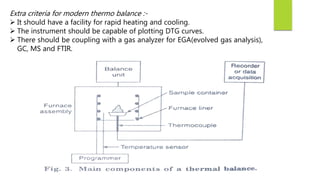
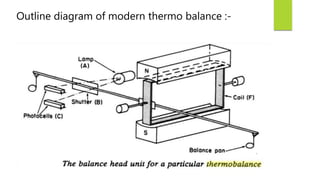
This document discusses Thermo gravimetric analysis (TGA), a technique where the weight of a substance is recorded as it is heated or cooled at a controlled rate. TGA is used to detect changes in mass that occur due to thermal events like desorption, absorption, and chemical reactions. Results are displayed as Thermo gravimetric (TG) curves that plot mass change versus temperature or time. The curves reveal temperatures where mass loss occurs due to decomposition or evaporation, as well as temperatures where the material is stable. TGA can be used to identify materials based on their characteristic temperature ranges of decomposition. Modern TGA instruments precisely measure weight changes, can rapidly heat and cool samples, and are often coupled to additional analytical techniques.
In DSC the heat flow is measured and plotted against temperature of furnace or time to get a thermo gram. This is the basis of Differential Scanning Calorimetry (DSC).
The deviation observed above the base (zero) line is called exothermic transition and below is called endothermic transition.
In DSC the heat flow is measured and plotted against temperature of furnace or time to get a thermo gram. This is the basis of Differential Scanning Calorimetry (DSC).
The deviation observed above the base (zero) line is called exothermic transition and below is called endothermic transition.
Slide covers three methods of thermal analysis i.e., thermogravimetry, differential thermal analysis, and differential scanning calorimetry. Thermal analysis methods are well-established techniques in research laboratories of pharmaceutical industry. Thermal analysis includes all methods measuring some parameter during the heating of a sample .Thermal analysis is widely used to study the thermal stability, char content, and decomposition temperature of polymer composites reinforced with natural/synthetic fibers/or nanosized fillers etc.
Differential Thermal Analysis (DTA),principle of DTA, working of DTA, instrumentation of DTA, thermogram factors affecting DTA curve, advantages and disadvantages, applications of DTA, Thermogravimetry (TG),types of TG, principle of TG, working of TG, instrumentation of TG, thermogram of TG, factors affecting TG curve, advantages and disadvantages, applications of TG
it is a method of miscellaneous instrumental analytical technique. it is one of the thermal analytical techniques used. it also has wide applications in the field of pharmacy.
Exploring Thermal Gravimetric Analysis: Applications, Techniques, and InsightsAshish Gadage
Embark on a scientific journey into the realm of Thermal Gravimetric Analysis (TGA) with our comprehensive PowerPoint presentation. Uncover the principles and applications of TGA, examining its significance in material science, chemistry, and various industries. From the basics of weight loss analysis to advanced techniques and real-world applications, this presentation offers a deep dive into the world of TGA. Join us as we unravel the mysteries of thermal analysis and its pivotal role in understanding material behavior and composition.
Thermogravimetric analysis or thermal gravimetric analysis (TGA) is a method of thermal analysis in which the mass of a sample is measured over time as the temperature changes
The investigation of thermodynamic properties and reactivity yields interesting insights into the chemistry of newly synthesized substances. With thermal analysis extensive information can be gained from small samples (often only a few milligrams). In addition, the data obtained by thermal analysis can be used to plan and optimize a synthesis. Among the most important applications are identification and purity analysis, and the determination of characteristic temperatures and enthalpies of phase transitions (melting, vaporization), phase transformations, and reactions. Investigations into the kinetics of consecutive reactions and decomposition reactions are also possible. With the instruments available today such analyses can usually be performed quickly and easily. In this review the fundamentals of thermoanalytical methods are described and illustrated with selected examples of applications to low and high molecular weight compounds.
Multi-source connectivity as the driver of solar wind variability in the heli...Sérgio Sacani
The ambient solar wind that flls the heliosphere originates from multiple
sources in the solar corona and is highly structured. It is often described
as high-speed, relatively homogeneous, plasma streams from coronal
holes and slow-speed, highly variable, streams whose source regions are
under debate. A key goal of ESA/NASA’s Solar Orbiter mission is to identify
solar wind sources and understand what drives the complexity seen in the
heliosphere. By combining magnetic feld modelling and spectroscopic
techniques with high-resolution observations and measurements, we show
that the solar wind variability detected in situ by Solar Orbiter in March
2022 is driven by spatio-temporal changes in the magnetic connectivity to
multiple sources in the solar atmosphere. The magnetic feld footpoints
connected to the spacecraft moved from the boundaries of a coronal hole
to one active region (12961) and then across to another region (12957). This
is refected in the in situ measurements, which show the transition from fast
to highly Alfvénic then to slow solar wind that is disrupted by the arrival of
a coronal mass ejection. Our results describe solar wind variability at 0.5 au
but are applicable to near-Earth observatories.
Cancer cell metabolism: special Reference to Lactate PathwayAADYARAJPANDEY1
Normal Cell Metabolism:
Cellular respiration describes the series of steps that cells use to break down sugar and other chemicals to get the energy we need to function.
Energy is stored in the bonds of glucose and when glucose is broken down, much of that energy is released.
Cell utilize energy in the form of ATP.
The first step of respiration is called glycolysis. In a series of steps, glycolysis breaks glucose into two smaller molecules - a chemical called pyruvate. A small amount of ATP is formed during this process.
Most healthy cells continue the breakdown in a second process, called the Kreb's cycle. The Kreb's cycle allows cells to “burn” the pyruvates made in glycolysis to get more ATP.
The last step in the breakdown of glucose is called oxidative phosphorylation (Ox-Phos).
It takes place in specialized cell structures called mitochondria. This process produces a large amount of ATP. Importantly, cells need oxygen to complete oxidative phosphorylation.
If a cell completes only glycolysis, only 2 molecules of ATP are made per glucose. However, if the cell completes the entire respiration process (glycolysis - Kreb's - oxidative phosphorylation), about 36 molecules of ATP are created, giving it much more energy to use.
IN CANCER CELL:
Unlike healthy cells that "burn" the entire molecule of sugar to capture a large amount of energy as ATP, cancer cells are wasteful.
Cancer cells only partially break down sugar molecules. They overuse the first step of respiration, glycolysis. They frequently do not complete the second step, oxidative phosphorylation.
This results in only 2 molecules of ATP per each glucose molecule instead of the 36 or so ATPs healthy cells gain. As a result, cancer cells need to use a lot more sugar molecules to get enough energy to survive.
introduction to WARBERG PHENOMENA:
WARBURG EFFECT Usually, cancer cells are highly glycolytic (glucose addiction) and take up more glucose than do normal cells from outside.
Otto Heinrich Warburg (; 8 October 1883 – 1 August 1970) In 1931 was awarded the Nobel Prize in Physiology for his "discovery of the nature and mode of action of the respiratory enzyme.
WARNBURG EFFECT : cancer cells under aerobic (well-oxygenated) conditions to metabolize glucose to lactate (aerobic glycolysis) is known as the Warburg effect. Warburg made the observation that tumor slices consume glucose and secrete lactate at a higher rate than normal tissues.
Earliest Galaxies in the JADES Origins Field: Luminosity Function and Cosmic ...Sérgio Sacani
We characterize the earliest galaxy population in the JADES Origins Field (JOF), the deepest
imaging field observed with JWST. We make use of the ancillary Hubble optical images (5 filters
spanning 0.4−0.9µm) and novel JWST images with 14 filters spanning 0.8−5µm, including 7 mediumband filters, and reaching total exposure times of up to 46 hours per filter. We combine all our data
at > 2.3µm to construct an ultradeep image, reaching as deep as ≈ 31.4 AB mag in the stack and
30.3-31.0 AB mag (5σ, r = 0.1” circular aperture) in individual filters. We measure photometric
redshifts and use robust selection criteria to identify a sample of eight galaxy candidates at redshifts
z = 11.5 − 15. These objects show compact half-light radii of R1/2 ∼ 50 − 200pc, stellar masses of
M⋆ ∼ 107−108M⊙, and star-formation rates of SFR ∼ 0.1−1 M⊙ yr−1
. Our search finds no candidates
at 15 < z < 20, placing upper limits at these redshifts. We develop a forward modeling approach to
infer the properties of the evolving luminosity function without binning in redshift or luminosity that
marginalizes over the photometric redshift uncertainty of our candidate galaxies and incorporates the
impact of non-detections. We find a z = 12 luminosity function in good agreement with prior results,
and that the luminosity function normalization and UV luminosity density decline by a factor of ∼ 2.5
from z = 12 to z = 14. We discuss the possible implications of our results in the context of theoretical
models for evolution of the dark matter halo mass function.
Slide 1: Title Slide
Extrachromosomal Inheritance
Slide 2: Introduction to Extrachromosomal Inheritance
Definition: Extrachromosomal inheritance refers to the transmission of genetic material that is not found within the nucleus.
Key Components: Involves genes located in mitochondria, chloroplasts, and plasmids.
Slide 3: Mitochondrial Inheritance
Mitochondria: Organelles responsible for energy production.
Mitochondrial DNA (mtDNA): Circular DNA molecule found in mitochondria.
Inheritance Pattern: Maternally inherited, meaning it is passed from mothers to all their offspring.
Diseases: Examples include Leber’s hereditary optic neuropathy (LHON) and mitochondrial myopathy.
Slide 4: Chloroplast Inheritance
Chloroplasts: Organelles responsible for photosynthesis in plants.
Chloroplast DNA (cpDNA): Circular DNA molecule found in chloroplasts.
Inheritance Pattern: Often maternally inherited in most plants, but can vary in some species.
Examples: Variegation in plants, where leaf color patterns are determined by chloroplast DNA.
Slide 5: Plasmid Inheritance
Plasmids: Small, circular DNA molecules found in bacteria and some eukaryotes.
Features: Can carry antibiotic resistance genes and can be transferred between cells through processes like conjugation.
Significance: Important in biotechnology for gene cloning and genetic engineering.
Slide 6: Mechanisms of Extrachromosomal Inheritance
Non-Mendelian Patterns: Do not follow Mendel’s laws of inheritance.
Cytoplasmic Segregation: During cell division, organelles like mitochondria and chloroplasts are randomly distributed to daughter cells.
Heteroplasmy: Presence of more than one type of organellar genome within a cell, leading to variation in expression.
Slide 7: Examples of Extrachromosomal Inheritance
Four O’clock Plant (Mirabilis jalapa): Shows variegated leaves due to different cpDNA in leaf cells.
Petite Mutants in Yeast: Result from mutations in mitochondrial DNA affecting respiration.
Slide 8: Importance of Extrachromosomal Inheritance
Evolution: Provides insight into the evolution of eukaryotic cells.
Medicine: Understanding mitochondrial inheritance helps in diagnosing and treating mitochondrial diseases.
Agriculture: Chloroplast inheritance can be used in plant breeding and genetic modification.
Slide 9: Recent Research and Advances
Gene Editing: Techniques like CRISPR-Cas9 are being used to edit mitochondrial and chloroplast DNA.
Therapies: Development of mitochondrial replacement therapy (MRT) for preventing mitochondrial diseases.
Slide 10: Conclusion
Summary: Extrachromosomal inheritance involves the transmission of genetic material outside the nucleus and plays a crucial role in genetics, medicine, and biotechnology.
Future Directions: Continued research and technological advancements hold promise for new treatments and applications.
Slide 11: Questions and Discussion
Invite Audience: Open the floor for any questions or further discussion on the topic.
Richard's entangled aventures in wonderlandRichard Gill
Since the loophole-free Bell experiments of 2020 and the Nobel prizes in physics of 2022, critics of Bell's work have retreated to the fortress of super-determinism. Now, super-determinism is a derogatory word - it just means "determinism". Palmer, Hance and Hossenfelder argue that quantum mechanics and determinism are not incompatible, using a sophisticated mathematical construction based on a subtle thinning of allowed states and measurements in quantum mechanics, such that what is left appears to make Bell's argument fail, without altering the empirical predictions of quantum mechanics. I think however that it is a smoke screen, and the slogan "lost in math" comes to my mind. I will discuss some other recent disproofs of Bell's theorem using the language of causality based on causal graphs. Causal thinking is also central to law and justice. I will mention surprising connections to my work on serial killer nurse cases, in particular the Dutch case of Lucia de Berk and the current UK case of Lucy Letby.
2. Introduction & Principle :-
It is a technique where by weight of substance in an environment heated or cold at a
controlled rate , is recorded as a function of time or temperature.
The principle of TGA is based on the simple fact that the sample weight continuously as it is
being heated to elevated temperature and change in the mass of a sample are studied.
Change in temperature affect the sample not all the thermal events bring changes in the
mass of substance ( Melting , Crystallization ) But some thermal events like desorption ,
absorption , vaporization , redox reaction bring a drastic change in the mass of sample.
It is a technique which is studied under thermal analysis and is employed for detection of
such type of material which undergoes mass changes gain or lost when subjected to
thermal events
3. Recording of result and thermo gravimetric curve (TG) curves
:-
The instrument used for thermogravimetry is a
programmed precision balance for rise in
temperature known as thermo balance.
Results are displayed by a plot of mass change
versus temperature or time and are known as
thermo gravimetric curves or TG curves.
TG curves are normally plotted with the mass
change in percentage on the y-axis and
temperature (T) or time (t) on the x-axis.
A typical TG curve has been shown-
4. There are two temperature in a reaction –
o Ti (procedural decomposition temperature) representing the lowest
temperature at which the onset of a mass change is seen.
o Tf (final temperature) representing the lowest temperature at which
the process has been completed respectively.
The reaction temperature and interval depend on the experimental
condition , therefore they do not have any fixed
value.
5. INFORMATION OBTAINED FROM A TG CURVE
• Plateaus is the horizontal portion of the TG curve where the mass is essentially constant or
there is no change in mass.
• Curved portion indicates the weight losses.
• Procedural decomposition temperature Ti is that temperature at which the cumulative mass
change reaches magnitude that the thermo balance can detect.
• Final temperature Ff is the temperature at which the cumulative mass changes maximum.
• Reaction interval- reaction interval is the temperature difference between Ff -Ti
6. It can be concluded that thermogravimetry is concerned with the change in
weight of a material as its temperature changes.
First this determines the temperature at which the material losses weight.
This loss indicated decomposition or evaporation of the sample.
Second, the temperature at which no weight loss takes place is revealed,
which indicates the stability of the material.
These temperature range are physical properties of chemical compound and
can be used for their identification.
The CuSO4.5H2O has four distinct regions of decomposition :-
(i) CuSO4.5H2O CuSO4.H2O (363-423K)
(ii) CuSO4.H2O CuSO4 (473-548K)
(iii) CuSO4 CuO + SO2 + 1/2O2 (973-1173K)
(iv) 2CuO Cu2O + 1/2O2 (1273-1373K)
7. INSTRUMENTATION
A.Thermo balance or recording balance
B. Sample holder
C.Heating device
D.Furnace
E. Furnace temperature programmer
F. Recorder
8. Thermo balance
• It is the most important component of TGA.
• Thermo balance is used to record a change in mass of sample/ substance .
• A ideal microbalance must posses following features:
a) It should accurately and reproducibly record the change in mass of sample in wide range
of atmospheric condition and temperature.
b) It should provide electronic signals to record the change in mass using a recorder.
c) It should be very sensitive, mechanically stable and respond quickly to changes in weight.
d) The sample holder should be in hot zone of furnace and this zone should be of uniform
temperature.
e) Its operation should be user friendly.
9. Extra criteria for modern thermo balance :-
It should have a facility for rapid heating and cooling.
The instrument should be capable of plotting DTG curves.
There should be coupling with a gas analyzer for EGA(evolved gas analysis),
GC, MS and FTIR.
10. Recorder balance are of two types :-
1. Deflection type instrument -
a) Beam type
b) Helical type
c) Cantilevered beam
d) Torsion wire
Recorder balance
2. Null type instrument
11. Deflection balance :-
i. Beam type- in these balances, the conversion of deflection beams takes place into the
weight change. The curves formed identified by the help of photographic recorded
trace, the signal generated by displacement- measuring electromechanically.
ii. Helical type- in these balance, elongation or contraction of spring occurs with change
in weight which is recorded by the help of transducer.
iii. Cantilevered beam- in these balance, one end of beam is fixed and on other end sample
is placed. It undergoes deflection which can be recorded by the help of photographic
recorded trace, signals generated by displacement –measuring electromechanically.
iv. Torsion wire- in these balances , the beam is attached to hard torsion wire which act as
fulcrum. The wire is attached to one or both end of balance to make the deflection of
beam proportional to weight change, which can be detected by the help of
photographic recorded trace, signal generated by displacement transducer.
12.
13. Null point balance
It consist of a sensor which detect the
deviation from null point and restores
the balance to its null point by means of
restoring force.
15. Sample holder or Crucible:-
• The sample to be studied is placed in sample holder or crucible. It is attached to
the weighing arm of Microbalance.
• There are different varieties of crucibles used. Some differ in shape and size while
some differ in materials used.
• They are made from platinum, aluminium,quarts or alumina and some other
materials like graphite, stainless steel, glass etc.
• Crucibles should have temperature at least 100k greater than temperature range of
experiment and must transfer heat uniformly to sample. Therefore, the shape ,
thermal conductivity and thermal mass of crucibles are important which depends
on the weight and nature of sample and temperature range.
16. There are different types of crucibles.
Shallow Pans: These are used for such samples in which diffusion is the
rate controlling step. Volatile substances produced during reaction
must escape out which is determined as weight loss. In some sample i.e.
polymers, byproducts may form, therefore, the sample is placed after
forming a thin layer of it so that as soon as volatile substance is formed,
it will escape.
Deep Crucibles: These are used in such cases where side reactions are
required such as in study of industrial scale calcinations.
Loosely covered Crucibles: These are used in self-generated
atmospheric studies.
17. Retort Cups: These are used in boiling point studies. It provides single plat of
reflux for a boiling point determination.
Different types of crucibles are used for different materials i.e. Flat crucibles
with small lip are used for powdered sample whereas walled crucibles are used
for liquid samples. Therefore, the form of crucibles used will determine the
temperature gradients in sample
18. Furnace (Heater/Boiler/Oven):
The furnace should be designed in such a way that it produces a
linear heating range.
It should have a hot zone which can hold sample and crucible and its
temperature corresponds to the temperature of furnace.
There are different combinations of microbalance and furnace
available. The furnace heating coil should be wound in such a way
that there is no magnetic interaction between coil and sample or
there can cause apparent mass change.
Coils used are made of different materials with variant temperature
changes viz.
Nichrome wire for T<1300 K,
Platinum for T>1300 K,
Platinum-10% rhodium Alloy for T<1800 K.
19. The size of furnace is important. A high mass furnace may have a
high range of temperature and obtain uniform hot zone but
requires more time to achieve the desired temperature.
Comparatively, a low mass furnace may heat quickly but it’s very
difficult to control rise in temperature and maintain hot zone.
Position of furnace with respect to balance :-
20. Furnace temperature programmer or temperature
measurement
It is done with the help of thermocouple.
Different materials are used for measuring different ranges of temperatures i.e. chromyl or
calomel (alloys of Platinum) thermocouples are used for T=1100 ºC, tungsten or rhenium
thermocouples are used for higher temperature.
The position of thermocouple is important.
It can be adjusted in following ways (Figure):
i. Thermocouple is placed near the sample container and has no contact with sample
container. This arrangement in not preferred in low-pressures.
ii. The sample is kept inside the sample holder but not in contact with it. It responds to
small temperature changes only.
iii. Thermocouple is placed either in contact with sample or with sample container. This
method is best and commonly employed.
21. Heating Rate: The heating rate is the rate of temperature increase,
which is customarily quoted in degrees per minute (on the Celsius or
Kelvin scales). The heating or cooling rate is said to be constant when
the temperature/time curve is linear.
22. Data Recording Unit or Recorder
The recording systems are mainly of 2 types:
1. Time-base potentiometric strip chart recorder.
2. X-Y recorder.
• In some instruments, light beam galvanometer, photographic paper recorders or one
recorder with two or more pens are also used.
• In the X-Y recorder, we get curves having plot of weights directly against
temperatures.
• However, the percentage mass change against temperature or time would be more
useful.