

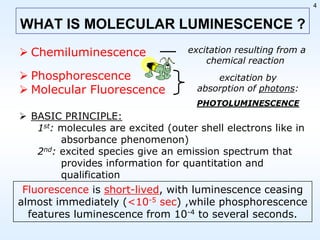
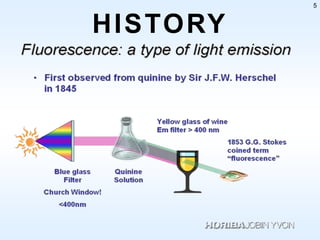
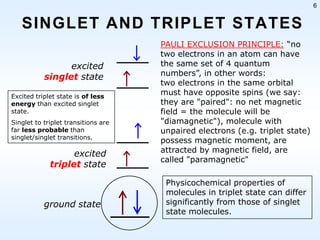
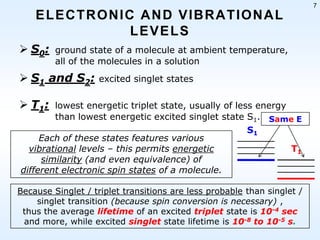
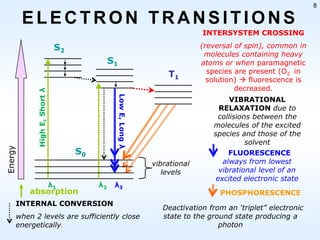
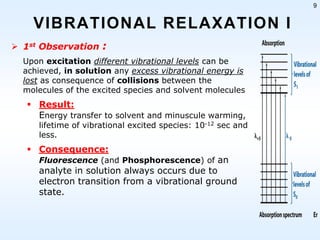
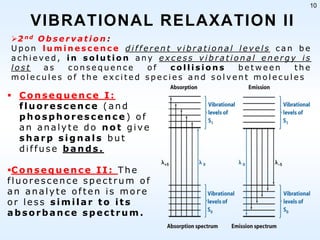
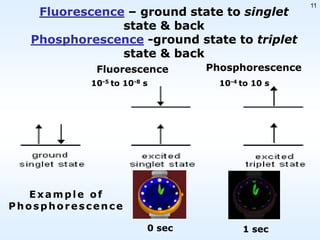
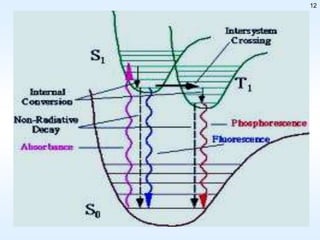
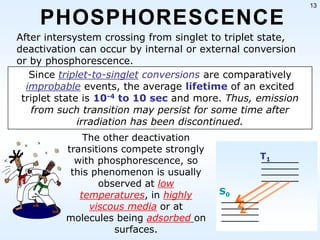

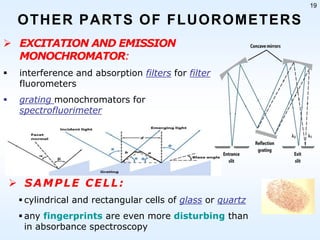
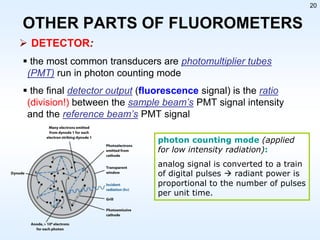
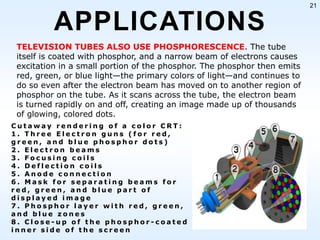


This document discusses phosphorescence spectroscopy and provides information about molecular luminescence, including fluorescence and phosphorescence. It describes the basic principles, including how molecules are excited to higher energy states and then emit light as they relax to lower energy states. Singlet and triplet states are defined, along with electronic and vibrational energy levels. Electron transitions like internal conversion, intersystem crossing, and vibrational relaxation are explained. Instrumentation for measuring phosphorescence is also summarized, including components like light sources, monochromators, sample cells, and detectors. Some applications of phosphorescence are mentioned, such as in television screens, pigments, and glow-in-the-dark toys.


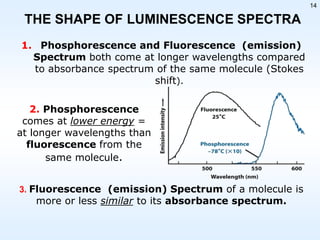
![Polarography[1]](https://cdn.slidesharecdn.com/ss_thumbnails/polarography1-210816031327-thumbnail.jpg?width=640&height=640&fit=bounds)


