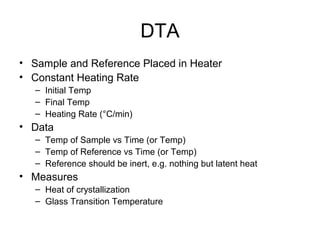
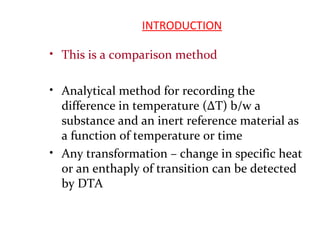
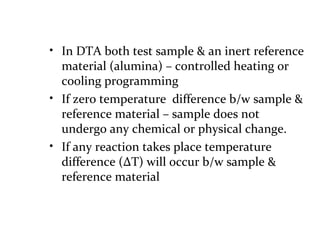
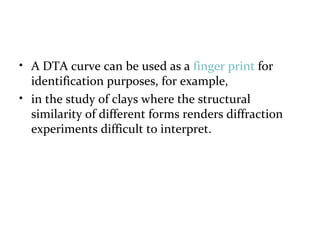
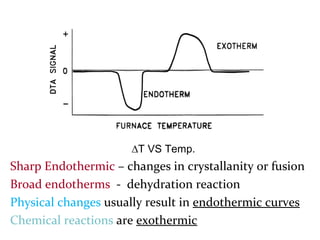
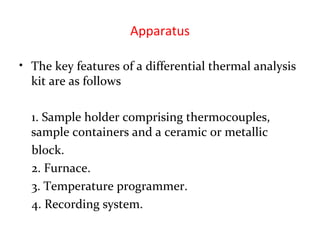
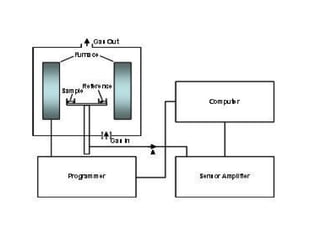
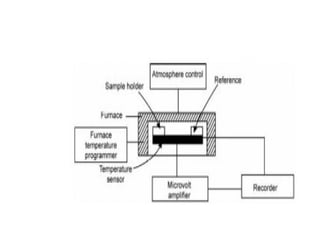
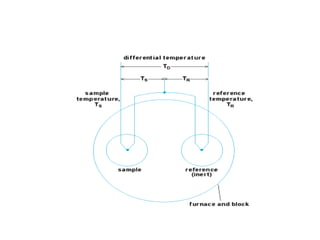
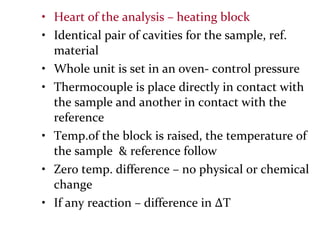
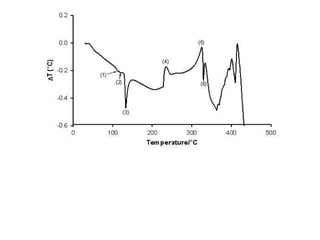
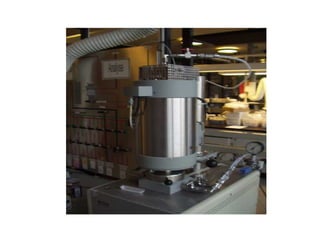
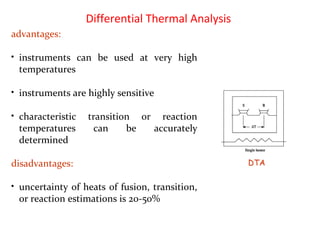
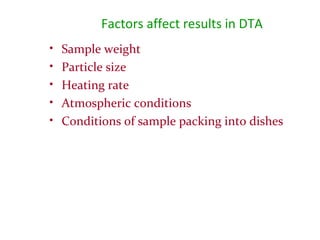
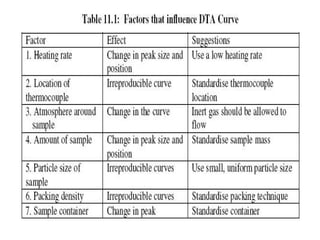
1
BY
Dr. Suman Pattanayak
Associate Professor
Department of Pharma Analysis & QA.
Vijaya Institute of Pharmaceutical Sciences for Women
M. Pharm/ I Sem
Advance Pharmaceutical Analysis
Different Techniques
• Thermometric Titration (TT)
– Heat of mixing
• Thermal Mechanical Analysis (TMA)
– Thermal Expansion Coefficient
• Dynamic Mechanical Analysis (DMA)
– Viscoelastic Properties
• Differential Scanning Calorimetric (DSC)
– Heat flow during Transitions
• Thermal Gravimetric Analysis (TGA)
– Weight Loss due to decomposition
– Derivative Thermogravimetric Analysis (DTG)
• Differential Thermal Analysis (DTA)
– Heat of Transitions
• Temperature Programmed Desorption (TPD)
– Temperature at which gas is desorbed from (catalyst) surface
– Emission gas Thermoanalysis (EGT)
Basic Principle
• Sample is heated at a constant heating
rate
• Sample’s Property Measured
– Wt TGA
– Size TMA
– Heat Flow DSC
– Temp DTA
– Gas evolved TPD
TGA
• Constant Heating
Rate
– Initial Temp
– Final Temp
– Heating Rate (°C/min)
• Data
– Weight vs Time
– Weight vs Temp.
• Differential This Data
(DTG)
DSC
DSC
• Constant Heating Rate
– Initial Temp
– Final Temp
– Heating Rate (°C/min)
• Data
– Heat flow to sample minus
Heat flow to reference vs
Time (Temp.)
• Measures heat of
crystallization
Polymer without weight change in this temperature range
DTA
• Sample and Reference Placed in Heater
• Constant Heating Rate
– Initial Temp
– Final Temp
– Heating Rate (°C/min)
• Data
– Temp of Sample vs Time (or Temp)
– Temp of Reference vs Time (or Temp)
– Reference should be inert, e.g. nothing but latent heat
• Measures
– Heat of crystallization
– Glass Transition Temperature
DTA + DTG
TMA
• Constant Heating Rate
– Initial Temp
– Final Temp
– Heating Rate (°C/min)
• Data
– Size of Sample vs Time (or Temp.)
• Measures
– Thermal Expansion Coefficient
– Volume change on crystalization or crystal
transformations
– Sintering
– Glass Transitions in Polymers
TMA
Polymer with glass transition
DMA
• Constant Heating Rate
– Initial Temp
– Final Temp
– Heating Rate (°C/min)
• Data
– Force vs Time (or Temp.)
– Force delay vs Time (or
Temp.)
– Viscoelastic Properties
• Storage and Loss Modulus
• Measures
– Glass Transition
– Viscoelastic Properties Polymer with Glass Transition
We have TGA - only
• Heating a sample of Calcium oxalate
• Ca(C204)*xH2O  Ca(C204) *H2O + x-1 H2O
• Ca(C204)*H2O Ca(C204) + H2O
• Ca(C204)  CaCO3 + CO
• CaCO3  CaO + CO2
TGA
• Constant Heating
Rate
– Initial Temp
– Final Temp
– Heating Rate (°C/min)
• Data
– Weight vs Time
– Weight vs Temp.
• Differential This Data
(DTG)
TGA – Ca(C204)*xH2O
Different Heating Rates
Heating Rate
• Heating Too Fast
– Overlaps Transitions
• Interpretation Problems
• Kinetics of Decomposition
– Sample Size
– Mass Transfer
• Convective Mass Transfer
• Pore Diffusion
– Heat Transfer
• Convective Heat Transfer
• Thermal Conductivity
– Porous solid
Precipitated Zr5O8(SO4)2*15 H2O
This sample was dried fro 48 hrs at 110C before TGA analysis.
What is going on?
Analysis of Filtrate from
Precipitation
• Precipitation
• 5ZrOCl2 + 2H2SO4 + xH2O 
Zr5O8(SO4)2*15 H2O (s) + 10 HCl
• Decomposition
• Zr5O8(SO4)2*15 H2O (s) 
Zr5O8(SO4)2*14 H2O (s) + H2O (v)
• Zr5O8(SO4)2  5
ZrO2 (s) +2 SO2 (v)
INTRODUCTION
• This is a comparison method
• Analytical method for recording the
difference in temperature (∆T) b/w a
substance and an inert reference material as
a function of temperature or time
• Any transformation – change in specific heat
or an enthaply of transition can be detected
by DTA
• In DTA both test sample & an inert reference
material (alumina) – controlled heating or
cooling programming
• If zero temperature difference b/w sample &
reference material – sample does not
undergo any chemical or physical change.
• If any reaction takes place temperature
difference (∆T) will occur b/w sample &
reference material
• A DTA curve can be used as a finger print for
identification purposes, for example,
• in the study of clays where the structural
similarity of different forms renders diffraction
experiments difficult to interpret.
∆T VS Temp.
Sharp Endothermic – changes in crystallanity or fusion
Broad endotherms - dehydration reaction
Physical changes usually result in endothermic curves
Chemical reactions are exothermic
Apparatus
• The key features of a differential thermal analysis
kit are as follows
1. Sample holder comprising thermocouples,
sample containers and a ceramic or metallic
block.
2. Furnace.
3. Temperature programmer.
4. Recording system.
• Heart of the analysis – heating block
• Identical pair of cavities for the sample, ref.
material
• Whole unit is set in an oven- control pressure
• Thermocouple is place directly in contact with
the sample and another in contact with the
reference
• Temp.of the block is raised, the temperature of
the sample & reference follow
• Zero temp. difference – no physical or chemical
change
• If any reaction – difference in ∆T
Differential Thermal Analysis
advantages:
• instruments can be used at very high
temperatures
• instruments are highly sensitive
• characteristic transition or reaction
temperatures can be accurately
determined
disadvantages:
• uncertainty of heats of fusion, transition,
or reaction estimations is 20-50%
DTA
Factors affect results in DTA
• Sample weight
• Particle size
• Heating rate
• Atmospheric conditions
• Conditions of sample packing into dishes
Applications
• Quantitative identification and purity
assessment of materials are accomplished by
comparing the DTA curve of sample to that of
a reference curve
• Impurities may be detected by depression of
the M.P
4 thermal analysis.ppt1 jntu pharmacy

4 thermal analysis.ppt1 jntu pharmacy

  • 1.
    1 BY Dr. Suman Pattanayak AssociateProfessor Department of Pharma Analysis & QA. Vijaya Institute of Pharmaceutical Sciences for Women M. Pharm/ I Sem Advance Pharmaceutical Analysis
  • 2.
    Different Techniques • ThermometricTitration (TT) – Heat of mixing • Thermal Mechanical Analysis (TMA) – Thermal Expansion Coefficient • Dynamic Mechanical Analysis (DMA) – Viscoelastic Properties • Differential Scanning Calorimetric (DSC) – Heat flow during Transitions • Thermal Gravimetric Analysis (TGA) – Weight Loss due to decomposition – Derivative Thermogravimetric Analysis (DTG) • Differential Thermal Analysis (DTA) – Heat of Transitions • Temperature Programmed Desorption (TPD) – Temperature at which gas is desorbed from (catalyst) surface – Emission gas Thermoanalysis (EGT)
  • 3.
    Basic Principle • Sampleis heated at a constant heating rate • Sample’s Property Measured – Wt TGA – Size TMA – Heat Flow DSC – Temp DTA – Gas evolved TPD
  • 4.
    TGA • Constant Heating Rate –Initial Temp – Final Temp – Heating Rate (°C/min) • Data – Weight vs Time – Weight vs Temp. • Differential This Data (DTG)
  • 5.
  • 6.
    DSC • Constant HeatingRate – Initial Temp – Final Temp – Heating Rate (°C/min) • Data – Heat flow to sample minus Heat flow to reference vs Time (Temp.) • Measures heat of crystallization Polymer without weight change in this temperature range
  • 7.
    DTA • Sample andReference Placed in Heater • Constant Heating Rate – Initial Temp – Final Temp – Heating Rate (°C/min) • Data – Temp of Sample vs Time (or Temp) – Temp of Reference vs Time (or Temp) – Reference should be inert, e.g. nothing but latent heat • Measures – Heat of crystallization – Glass Transition Temperature
  • 8.
  • 9.
    TMA • Constant HeatingRate – Initial Temp – Final Temp – Heating Rate (°C/min) • Data – Size of Sample vs Time (or Temp.) • Measures – Thermal Expansion Coefficient – Volume change on crystalization or crystal transformations – Sintering – Glass Transitions in Polymers
  • 10.
  • 11.
    DMA • Constant HeatingRate – Initial Temp – Final Temp – Heating Rate (°C/min) • Data – Force vs Time (or Temp.) – Force delay vs Time (or Temp.) – Viscoelastic Properties • Storage and Loss Modulus • Measures – Glass Transition – Viscoelastic Properties Polymer with Glass Transition
  • 12.
    We have TGA- only • Heating a sample of Calcium oxalate • Ca(C204)*xH2O  Ca(C204) *H2O + x-1 H2O • Ca(C204)*H2O Ca(C204) + H2O • Ca(C204)  CaCO3 + CO • CaCO3  CaO + CO2
  • 13.
    TGA • Constant Heating Rate –Initial Temp – Final Temp – Heating Rate (°C/min) • Data – Weight vs Time – Weight vs Temp. • Differential This Data (DTG)
  • 14.
  • 15.
  • 16.
    Heating Rate • HeatingToo Fast – Overlaps Transitions • Interpretation Problems • Kinetics of Decomposition – Sample Size – Mass Transfer • Convective Mass Transfer • Pore Diffusion – Heat Transfer • Convective Heat Transfer • Thermal Conductivity – Porous solid
  • 17.
    Precipitated Zr5O8(SO4)2*15 H2O Thissample was dried fro 48 hrs at 110C before TGA analysis. What is going on?
  • 18.
    Analysis of Filtratefrom Precipitation • Precipitation • 5ZrOCl2 + 2H2SO4 + xH2O  Zr5O8(SO4)2*15 H2O (s) + 10 HCl • Decomposition • Zr5O8(SO4)2*15 H2O (s)  Zr5O8(SO4)2*14 H2O (s) + H2O (v) • Zr5O8(SO4)2  5 ZrO2 (s) +2 SO2 (v)
  • 19.
    INTRODUCTION • This isa comparison method • Analytical method for recording the difference in temperature (∆T) b/w a substance and an inert reference material as a function of temperature or time • Any transformation – change in specific heat or an enthaply of transition can be detected by DTA
  • 20.
    • In DTAboth test sample & an inert reference material (alumina) – controlled heating or cooling programming • If zero temperature difference b/w sample & reference material – sample does not undergo any chemical or physical change. • If any reaction takes place temperature difference (∆T) will occur b/w sample & reference material
  • 21.
    • A DTAcurve can be used as a finger print for identification purposes, for example, • in the study of clays where the structural similarity of different forms renders diffraction experiments difficult to interpret.
  • 22.
    ∆T VS Temp. SharpEndothermic – changes in crystallanity or fusion Broad endotherms - dehydration reaction Physical changes usually result in endothermic curves Chemical reactions are exothermic
  • 23.
    Apparatus • The keyfeatures of a differential thermal analysis kit are as follows 1. Sample holder comprising thermocouples, sample containers and a ceramic or metallic block. 2. Furnace. 3. Temperature programmer. 4. Recording system.
  • 27.
    • Heart ofthe analysis – heating block • Identical pair of cavities for the sample, ref. material • Whole unit is set in an oven- control pressure • Thermocouple is place directly in contact with the sample and another in contact with the reference • Temp.of the block is raised, the temperature of the sample & reference follow • Zero temp. difference – no physical or chemical change • If any reaction – difference in ∆T
  • 30.
    Differential Thermal Analysis advantages: •instruments can be used at very high temperatures • instruments are highly sensitive • characteristic transition or reaction temperatures can be accurately determined disadvantages: • uncertainty of heats of fusion, transition, or reaction estimations is 20-50% DTA
  • 31.
    Factors affect resultsin DTA • Sample weight • Particle size • Heating rate • Atmospheric conditions • Conditions of sample packing into dishes
  • 33.
    Applications • Quantitative identificationand purity assessment of materials are accomplished by comparing the DTA curve of sample to that of a reference curve • Impurities may be detected by depression of the M.P