In this document, I have tried to illustrate most of the hypothesis testing like 1 sample,2 samples, etc, which I have covered to analyze the machine learning algorithms. I have focused on Independent statistical testing.
Now the question is why we use statistical testing? the answer is that we use statistical testing for significance analysis of our results, which I am going to deliver
Ducan’s multiple range test - - Dr. Manu Melwin Joy - School of Management St...manumelwin
In 1955, Duncan devised a method to compare each treatment mean with every other treatment mean. The procedure is simple and powerful and has become very popular among researchers, especially in the plant science area.
Comparing the unpaired t test, small sample formula with the one with large sample formula and the Welch's test. The latter is an unpaired t test for samples of unequal sizes with unequal variances.
The slides discuss comparing two means to ascertain which mean is of greater statistical significance. In these slides we will learn about three research questions in which the t-test can be used to analyze the data and compare the means from two independent groups, two paired samples, and a sample and a population.
Research methodology - Estimation Theory & Hypothesis Testing, Techniques of ...The Stockker
Fundamentals, Standard Error, Estimation, Interval Estimation, Hypothesis, Characteristics of Hypothesis, Testing The Hypothesis, Type I & Type II error, One tailed & Two tailed test, Tabulated Values, Chi-square (2) Test, Analysis of variance (ANOVA) Introduction, The Sign Test, The rank sum test or The Mann-Whitney U test, Determination of Sample Size
This document contain all topics of research methodology of module-3 according to the syllabus of BPUT odisha. The document is done for the PG and PHD students who are doing research.
Week 5 Lecture 14 The Chi Square TestQuite often, patterns of .docxcockekeshia
Week 5 Lecture 14
The Chi Square Test
Quite often, patterns of responses or measures give us a lot of information. Patterns are generally the result of counting how many things fit into a particular category. Whenever we make a histogram, bar, or pie chart we are looking at the pattern of the data. Frequently, changes in these visual patterns will be our first clues that things have changed, and the first clue that we need to initiate a research study (Lind, Marchel, & Wathen, 2008).
One of the most useful test in examining patterns and relationships in data involving counts (how many fit into this category, how many into that, etc.) is the chi-square. It is extremely easy to calculate and has many more uses than we will cover. Examining patterns involves two uses of the Chi-square - the goodness of fit and the contingency table. Both of these uses have a common trait: they involve counts per group. In fact, the chi-square is the only statistic we will look at that we use when we have counts per multiple groups (Tanner & Youssef-Morgan, 2013). Chi Square Goodness of Fit Test
The goodness of fit test checks to see if the data distribution (counts per group) matches some pattern we are interested in. Example: Are the employees in our example company distributed equal across the grades? Or, a more reasonable expectation for a company might be are the employees distributed in a pyramid fashion – most on the bottom and few at the top?
The Chi Square test compares the actual versus a proposed distribution of counts by generating a measure for each cell or count: (actual – expected)2/actual. Summing these for all of the cells or groups provides us with the Chi Square Statistic. As with our other tests, we determine the p-value of getting a result as large or larger to determine if we reject or not reject our null hypothesis. An example will show the approach using Excel.
Regardless of the Chi Square test, the chi square related functions are found in the fx Statistics window rather than the Data Analysis where we found the t and ANOVA test functions. The most important for us are:
· CHISQ.TEST (actual range, expected range) – returns the p-value for the test
· CHISQ.INV.RT(p-value, df) – returns the actual Chi Square value for the p-value or probability value used.
· CHISQ.DIST.RT(X, df) – returns the p-value for a given value.
When we have a table of actual and expected results, using the =CHISQ.TEST(actual range, expected range) will provide us with the p-value of the calculated chi square value (but does not give us the actual calculated chi square value for the test). We can compare this value against our alpha criteria (generally 0.05) to make our decision about rejecting or not rejecting the null hypothesis.
If, after finding the p-value for our chi square test, we want to determine the calculated value of the chi square statistic, we can use the =CHISQ.INV.RT(probability, df) function, the value for probability is .
Instructions for Submissions thorugh G- Classroom.pptxJheel Barad
This presentation provides a briefing on how to upload submissions and documents in Google Classroom. It was prepared as part of an orientation for new Sainik School in-service teacher trainees. As a training officer, my goal is to ensure that you are comfortable and proficient with this essential tool for managing assignments and fostering student engagement.
The French Revolution, which began in 1789, was a period of radical social and political upheaval in France. It marked the decline of absolute monarchies, the rise of secular and democratic republics, and the eventual rise of Napoleon Bonaparte. This revolutionary period is crucial in understanding the transition from feudalism to modernity in Europe.
For more information, visit-www.vavaclasses.com
Read| The latest issue of The Challenger is here! We are thrilled to announce that our school paper has qualified for the NATIONAL SCHOOLS PRESS CONFERENCE (NSPC) 2024. Thank you for your unwavering support and trust. Dive into the stories that made us stand out!
2024.06.01 Introducing a competency framework for languag learning materials ...Sandy Millin
http://sandymillin.wordpress.com/iateflwebinar2024
Published classroom materials form the basis of syllabuses, drive teacher professional development, and have a potentially huge influence on learners, teachers and education systems. All teachers also create their own materials, whether a few sentences on a blackboard, a highly-structured fully-realised online course, or anything in between. Despite this, the knowledge and skills needed to create effective language learning materials are rarely part of teacher training, and are mostly learnt by trial and error.
Knowledge and skills frameworks, generally called competency frameworks, for ELT teachers, trainers and managers have existed for a few years now. However, until I created one for my MA dissertation, there wasn’t one drawing together what we need to know and do to be able to effectively produce language learning materials.
This webinar will introduce you to my framework, highlighting the key competencies I identified from my research. It will also show how anybody involved in language teaching (any language, not just English!), teacher training, managing schools or developing language learning materials can benefit from using the framework.
Synthetic Fiber Construction in lab .pptxPavel ( NSTU)
Synthetic fiber production is a fascinating and complex field that blends chemistry, engineering, and environmental science. By understanding these aspects, students can gain a comprehensive view of synthetic fiber production, its impact on society and the environment, and the potential for future innovations. Synthetic fibers play a crucial role in modern society, impacting various aspects of daily life, industry, and the environment. ynthetic fibers are integral to modern life, offering a range of benefits from cost-effectiveness and versatility to innovative applications and performance characteristics. While they pose environmental challenges, ongoing research and development aim to create more sustainable and eco-friendly alternatives. Understanding the importance of synthetic fibers helps in appreciating their role in the economy, industry, and daily life, while also emphasizing the need for sustainable practices and innovation.
Thesis Statement for students diagnonsed withADHD.ppt
Day 3 SPSS
1. 1
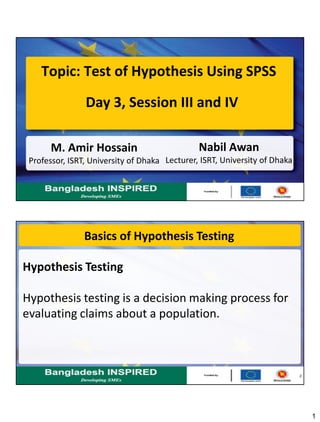
Topic: Test of Hypothesis Using SPSS
Nabil Awan
Lecturer, ISRT, University of Dhaka
Day 3, Session III and IV
M. Amir Hossain
Professor, ISRT, University of Dhaka
2
Basics of Hypothesis Testing
Hypothesis Testing
Hypothesis testing is a decision making process for
evaluating claims about a population.
2. 2
3
Basics of Hypothesis Testing
The researcher must
1) Define the population under study
2) State the hypothesis that is under investigation
3) Give the significance level
4) Select a sample from the population
5) Collect the data
6) Perform the statistical test
7) Reach a conclusion
4
Basics of Hypothesis Testing
How to set your hypotheses
1) Set the researcher’s hypothesis as alternative
hypothesis.
2) When you are testing if a parameter differs from a
certain value, set that particular value as the null
value.
3) If you are testing a difference between two
samples, set 0 as the null value.
3. 3
5
Basics of Hypothesis Testing
Definition of P-value
The probability of observing more extreme
observations (or observing more extreme test
statistics).
• Decisions are taken based on P-values.
• P-value stands for probability value.
6
Basics of Hypothesis Testing
Two-tailed test
If the sample statistic falls
in this region, we would
not reject H0.
We would reject H0 if
the sample statistic
falls in these regions.
e.g.
H0: 1 = 2
H1: 1 2
4. 4
7
Basics of Hypothesis Testing
One-tailed test
If the sample statistic falls
in this region, we would
not reject H0.
We would reject H0 if
the sample statistic
falls in these regions.
e.g.
H0: 1 = 2
H1: 1 > 2
8
Basics of Hypothesis Testing
One-tailed test
If the sample statistic falls
in this region, we would
not reject H0.
We would reject H0 if
the sample statistic
falls in these regions.
e.g.
H0: 1 = 2
H1: 1 < 2
5. 5
9
Basics of Hypothesis Testing
You reject your null hypothesis when the p-value
is lower than α i.e. there is more chance of
observing more extreme observations than those
obtained from the sample.
• The area of the rejection region is α.
• α is called the level of significance.
10
One Sample t-test (Test of Population Mean)
Suppose that we want to answer the question: Can
you conclude that a certain population mean is not
50? The null hypothesis is
H0: = 50
and the alternative hypothesis is
H1: 50.
6. 6
11
One Sample t-test (Test of Population Mean)
For example, using the hsb2.sav data file, say we
wish to test whether the average writing score
(write) differs significantly from 50. We can do this
as shown below.
t-test
/testval = 50
/variable = write.
12
One Sample t-test (Test of Population Mean)
Decision: We can reject the null hypothesis in
favor of the alternative hypothesis.
7. 7
13
Two Sample t-test (Test of Two Population Means)
Suppose we want to show that the students in one
group have a different average score than those of
another. Then we might formulate the null
hypothesis that there is no difference, namely,
H0: 1 = 2.
The alternative hypothesis is
H1: 1 2.
14
Two Sample t-test (Test of Two Population Means)
For example, using the hsb2.sav data file, say we
wish to test whether the mean for write is the
same for males and females. We can do that as
follows:
t-test groups = female(0 1)
/variables = write.
8. 8
15
Two Sample t-test (Test of Two Population Means)
Decision: We can reject the null hypothesis in
favor of the alternative hypothesis.
16
Two Sample Paired t-test
Reasons for pairing
It frequently happens that true differences do not exist between two
populations with respect to the variable of interest, but the presence
of extraneous sources of variation may cause rejection of the null
hypotheses of no difference or may mask true differences.
When used
Frequently employed for assessing the effectiveness of a
treatment or experimental procedure.
9. 9
17
Two Sample Paired t-test
A paired (samples) t-test is used when you have
two related observations and you want to see if
the means on these two variables differ from one
another. For example, using the hsb2.sav data
file we will test whether the mean of read is equal
to the mean of write.
t-test pairs = read with write (paired).
18
Two Sample Paired t-test
Decision: These results indicate that the mean
of read is not statistically significantly different
from the mean of write (t = -0.867, p = 0.387).
10. 10
19
Analysis of Variance (Test of k Population Means)
We test the null hypothesis that all population or
treatment means are equal against the alternative
that the members of at least one pair are not
equal. We may state the hypothesis formally as
follows:
H0: 1 = 2 = ….. = k
H1: Not all j are equal.
20
Analysis of Variance (Test of k Population Means)
Sources of
variation
Sum of squares Degrees of
freedom
Mean square Variance ratio
(F statistic)
Among samples SSA k-1 MSA = SSA/(k-1) V.R. = MSA/MSW
Within sample SSW N-k MSW = SSW/(N-k)
Total SST N-1
11. 11
21
Analysis of Variance (Test of k Population Means)
For example, using the hsb2.sav data file, say we
wish to test whether the mean of write differs
between the three program types (prog). The
command for this test would be:
oneway write by prog.
22
Analysis of Variance (Test of k Population Means)
Decision: The mean of the dependent variable
write differs significantly among the levels of
program type.
12. 12
23
Test of Association or Test Contingency Table
Suppose we want to test if a categorical variable is
associated with another categorical variable. We
first make a contingency table and perform Chi-
square test of association. We may state the
hypothesis formally as follows:
H0: No association
H1: There is association.
24
Test of Association or Test Contingency Table
Educated Uneducated Row Total
Male 80 20 100
Female 60 40 100
Column
Total
140 60 Total=200
Gender
Education
13. 13
25
Test of Association or Test Contingency Table
Using the hsb2.sav data file, let's see if there is a
relationship between the type of school attended
(schtyp) and students' gender (female). Remember that
the chi-square test assumes that the expected value for
each cell is five or higher.
crosstabs
/tables = schtyp by female
/statistic = chisq.
26
Test of Association or Test Contingency Table
Decision: These results indicate that there is no statistically
significant relationship between the type of school attended
and gender.
14. 14
Thank you for your
patience!
For further query: nawan@isrt.ac.bd
The End